3253
Alterations in cortical thickness and axonal density due to Experimental Autoimmune Encephalomyelitis in the Lewis Rat1Neuroscience, Canadian Centre for Behavioural Neuroscience, Lethbridge, AB, Canada
Synopsis
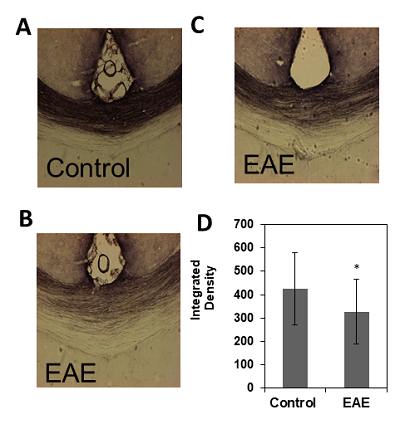
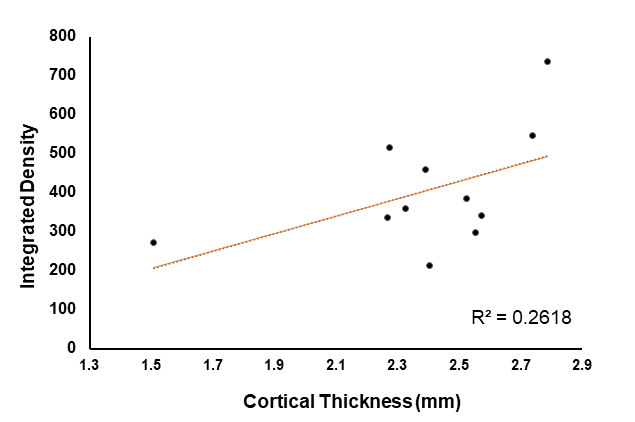
The animal model of experimental autoimmune encephalomyelitis (EAE) is characterized by inflammatory lesions and demyelination which leads to axonal damage and subsequent neuronal death within the central nervous system. The effect is debilitating, resulting in loss of motor and sensory functions. Here, we investigated changes in cortical thickness using MRI, and axonal density in the corpus callosum using a neuronal tract tracer, biotinylated dextran amine, in Lewis rats induced with EAE. Our study found that EAE leads to a decrease in cortical thickness, particularly in the primary somatosensory trunk region, and axonal density in the corpus callosum.
Introduction
Experimental autoimmune encephalomyelitis (EAE) is characterized by inflammatory lesions and demyelination which leads to axonal damage and subsequent neuronal death within the central nervous system. EAE is the most commonly used animal model of MS and mimics the hallmark neuropathological features of human MS1,4. Previous studies have found conflicting data for the effect of EAE on cerebral cortex volume2. In this study, we investigated changes in cortical thickness using MRI, and axonal density in the corpus callosum using a neuronal tract tracer, biotinylated dextran amine (BDA). Our hypothesis was that the disseminated loss of myelin reduces cortical thickness and axonal density in the corpus callosum.Methods
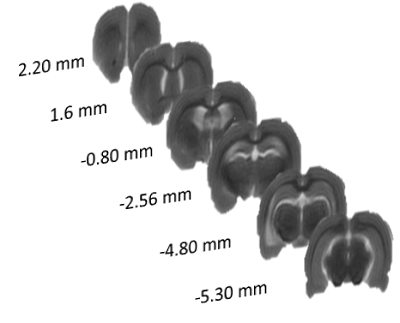
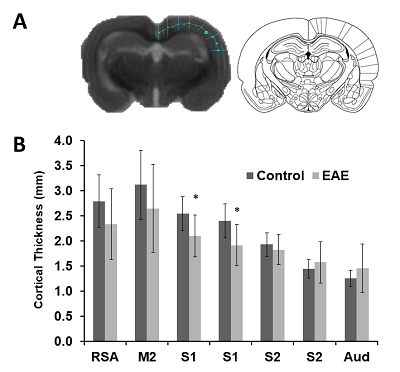
For this study, twelve female Lewis rats (Charles River Laboratories, Quebec) were used. The animals were housed in groups of two or three under standard environmental conditions (12:12 hour light/dark cycle with lights on at 7:30 AM). Animals had access to food and water ad libitum. Experimental and surgical procedures were performed in accordance with the guidelines of the Canadian Council on Animal Care at the University of Lethbridge. In order to induce EAE, rats were immunized with guinea pig (GP) myelin basic protein (MBP) (segment 69-88: YGSLPQKSQRSQDENPVVHF) obtained from GenScript (Piscataway, NJ) for monophasic EAE 3,4. Experimental groups were (1) MBP-inoculated control (n=7; EAE) and (2) CFA injected (n=5; Control). EAE was induced by subcutaneous immunization at the base of the tail with GP MBP69-88 emulsified in Freund’s adjuvant (Difco Laboratories, BD Bioscience). Freund’s adjuvant was supplemented with 4 mg/ml heat killed Mycobacterium tuberculosis H37Ra (Difco Laboratories, BD Biosciences) to make complete Freund's adjuvant (CFA; 1 mg/ml). After onset of symptoms, all animals were injected for white matter tract tracing with 1uL of BDA in to the motor cortex. MRI was performed on a 4.7T 330 mm bore Oxford magnet (Oxford, UK) and a MR6000 (MR Solutions, UK) console, using a quadrature volume transmit-receive coil (OD=40 mm, ID=20 mm, Active Volume Length =20 mm, Morris Instruments, Ottawa). Structural T2-weighted images (SEMS: TE/TR 75/ 3000 ms, 0.23 x 0.23 x 2 mm3, slice positioning: coronal) were acquired. To ensure reproducibility between rats, the third slice was positioned to be tangential to the occipital bone. Slices positioned from Bregma 2.20 mm to Bregma -5.60 mm (Figure 1) were used for cortical thickness analysis (ImageJ, NIH). Seven measurements on the right hemisphere were obtained per slice (Figure 2A) in addition to the area of each slice. Measurements were hand drawn by a student that was blind to the group, and purpose of the experiment. Thickness coordinates were compared to Paxinos and Watson rat atlas5 to determine location of measurement. Two sets of data were collected: thickness measurements and proportional thickness derived from brain slice area. Rats were euthanized 2 weeks after symptom onset and brains were extracted for tissue processing. Data was analyzed using SPSS (v21.0, IBM, NY).Results
Discussion and Conclusion
These results provide insight into cortical plasticity in EAE and indicate white matter loss in the corpus callosum. Interestingly, cortical thickness was significantly decreased in the somatosensory region corresponding to the trunk of the animal. It should be noted that in this animal model, EAE also reduces mechanical nociceptive responses to von Frey hair stimulation of the hind-paw, however, the trunk region was not measured4. This region could provide a useful target area for the detection of sensation loss as this is one of the earliest symptoms in MS6. Generally, a loss of sensation in trunk regions would go unnoticed. This finding possibly offers a new strategy for the identification of predictive biomarkers of MS. Further investigations will include the measurement of whole brain cortical thickness and segmentation using automated methods by Lee and Colleagues7, along with tract density analysis in the spinal cord.Acknowledgements
This research was supported by the Natural Sciences and Engineering Research Council of Canada (GM), and Alberta endMS (GM). JKM and BG were endMS SPRINT scholars.References
1. Gold, R., Linington, C., & Lassmann, H. (2006). Understanding pathogenesis and therapy of multiple sclerosis via animal models: 70 years of merits and culprits in experimental autoimmune encephalomyelitis research. Brain, 129(Pt 8), 1953-1971. doi:10.1093/brain/awl075
2. Mackenzie-Graham, A., Rinek, G. A., Avedisian, A., Gold, S. M., Frew, A. J., Aguilar, C., Alger, J. R. (2012). Cortical atrophy in experimental autoimmune encephalomyelitis: In vivo imaging. Neuroimage, 60, 95-104. doi: 10.1016/j.neuroimage.2011.11.099.
3. Mannie, M., Swanborg, R. H., & Stepaniak, J. A. (2009). Experimental autoimmune encephalomyelitis in the rat. Current Protocols in Immunology. doi: 10.1002/0471142735.im1502s85.
4. Gerrard, B., Singh, V., Babenko, O., Gauthier, I., Wee Yong, V., Kovalchuk, I., . . . Metz, G. A. S. (2017). Chronic mild stress exacerbates severity of experimental autoimmune encephalomyelitis in association with altered non-coding RNA and metabolic biomarkers. Neuroscience, 359, 299-307. doi:10.1016/j.neuroscience.2017.07.033
5. Paxinos, G., & Watson, C. (1998). The rat brain in stereotaxic coordinates (4th ed.). San Diego, CA: Academic Press
6. Yang, G., Parkhurst, C. N., Hayes, S., & Gan, W. B. (2013). Peripheral elevation of TNF-α leads to early synaptic abnormalities in the mouse somatosensory cortex in experimental autoimmune encephalomyelitis. Proceedings of the National Academy of Sciences of the United States of America, 110, 10306-10311. doi: 10.1073/pnas.1222895110.
7. Lee, J., Ehlers, C., Crews, F., Niethammer, M., Budin, F., Paniagua, B., . . . Oguz, I. (2011). Automatic cortical thickness analysis on rodent brain. Proc SPIE Int Soc Opt Eng, 7962, 7962481-79624811. doi:10.1117/12.878305
Figures