3252
Alterations in Cortical Thickness with Hydroxyurea Therapy in Children Treated for Sickle Cell Anemia1Diagnostic Imaging, St. Jude Children’s Research Hospital, Memphis, TN, United States
Synopsis
Sickle cell anemia is a devastating hematological disease leading to brain injury and neurocognitive deficits. Twenty-five patients (16 Hydroxyurea treated; 9 not) were imaged twice one year apart. Cortical thickness was assessed using FreeSurfer and compared between groups. Treated patients had thicker cortex in frontal and bilateral parietal lobes and in superior temporal and bankssts regions. Preservation of cortex in these regions may have implications for neurocognitive functions supported by associated networks such as central executive, attention and memory networks. These findings should be further evaluated for their impact on neurocognitive performance and Diffusion Tensor Imaging.
PURPOSE
Sickle cell anemia is a devastating hematological disease with cerebrovascular changes leading to vasculopathy, brain injury, stroke and neurocognitive deficits.1 Patients are at increased risk for overt stroke2 or focal ischemic damage without overt stroke.3,4 Hydroxyurea (HU) has shown great promise in the normalization of cerebral blood flow in this population. In this study, we examined patients before beginning HU therapy and at a one year follow-up after reaching therapeutic concentrations. Cortical thickness was assessed at both time points and compared between patients on therapy and those who refused therapy or were non-compliant.PATIENTS AND METHODS
Subjects included 25 patients with SCD, (7.2 to 17.7 years at baseline; median=12.2 years; 13 Males), diagnosed with HbSS or HbS/ß0-thalassemia who were not receiving either HU or transfusion therapy at time of enrollment and were able to successfully complete an MRI examination both at baseline and at one year follow-up. Patients had the opportunity to begin HU therapy after baseline imaging, and were divided into those who were compliant with their medication therapy (treatment group) and those who were non-compliant or declined medication (observation group). Treatment and imaging protocols were approved by the local Institutional Review Board, and written informed consent was obtained from the patient, parent, or guardian, as appropriate.
A conventional T1-3D MPRAGE imaging sequence [TR/TE/TI = 1560/2.75/900 ms] with 1mm isotropic resolution was collected on all patients using a 3.0T whole-body system (Siemens Medical Systems, Iselin, NJ). These isotropic images were processed using the FreeSurfer pipeline (http://surfer.nmr.mgh.harvard.edu/) to assess the cortical thickness of 68 anatomic parcellations of the cortex. This method uses both intensity and continuity information from the entire three dimensional MR volume in segmentation and deformation procedures to produce representations of cortical thickness, calculated as the closest distance from the gray/white boundary to the gray/CSF boundary at each vertex on the tessellated surface.5 The maps are created using spatial intensity gradients across tissue classes and are therefore not simply reliant on absolute signal intensity. The maps produced are not restricted to the voxel resolution of the original data thus are capable of detecting submillimeter differences between groups. Paired T-tests were performed using the general linear model tools provided in FreeSurfer to assess where the longitudinal difference that occurred between assessments differed between the treatment and observation groups. All clusters with a p-value less than 0.01 were recorded and localized by cortical parcellation in this exploratory analysis.
RESULTS
The treatment group consisted of 16 patients (7.2 to 17.7 years at baseline; median=12.3 years; 7 Males) while there were 9 patients (7.6 to 16.6 years at baseline; median=12.0 years; 6 Males) in the observation group. The observation group consisted of 4 subjects who declined HU therapy and 5 who were non-compliant with HU administration. Follow-up imaging was generally completed on time, 1 year after baseline (0.9 to 1.4 years; median=1.0 years).
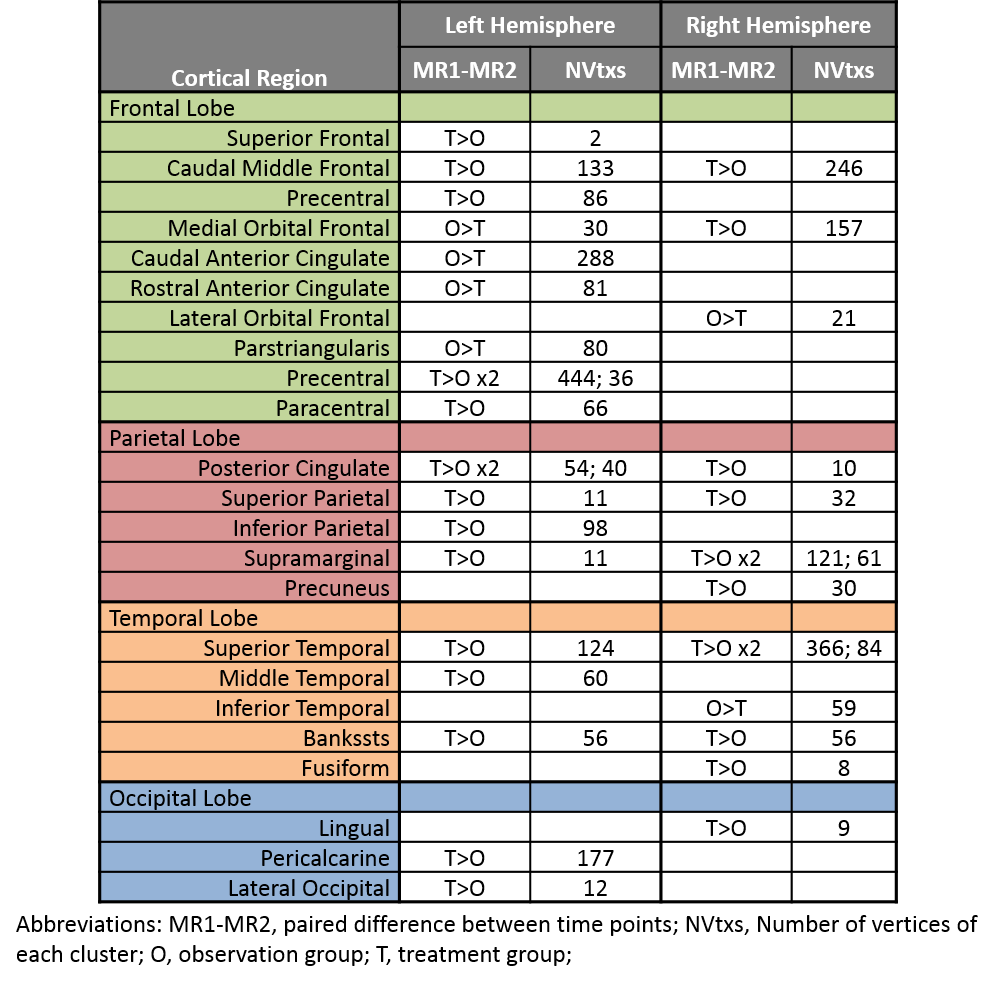
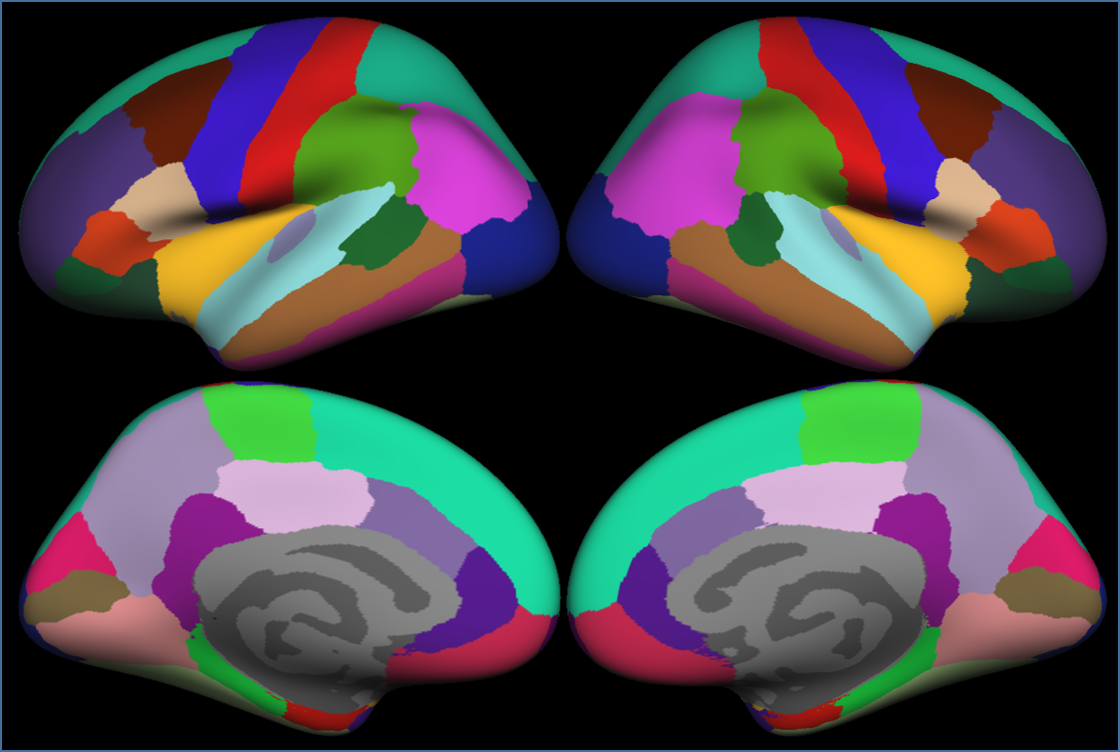
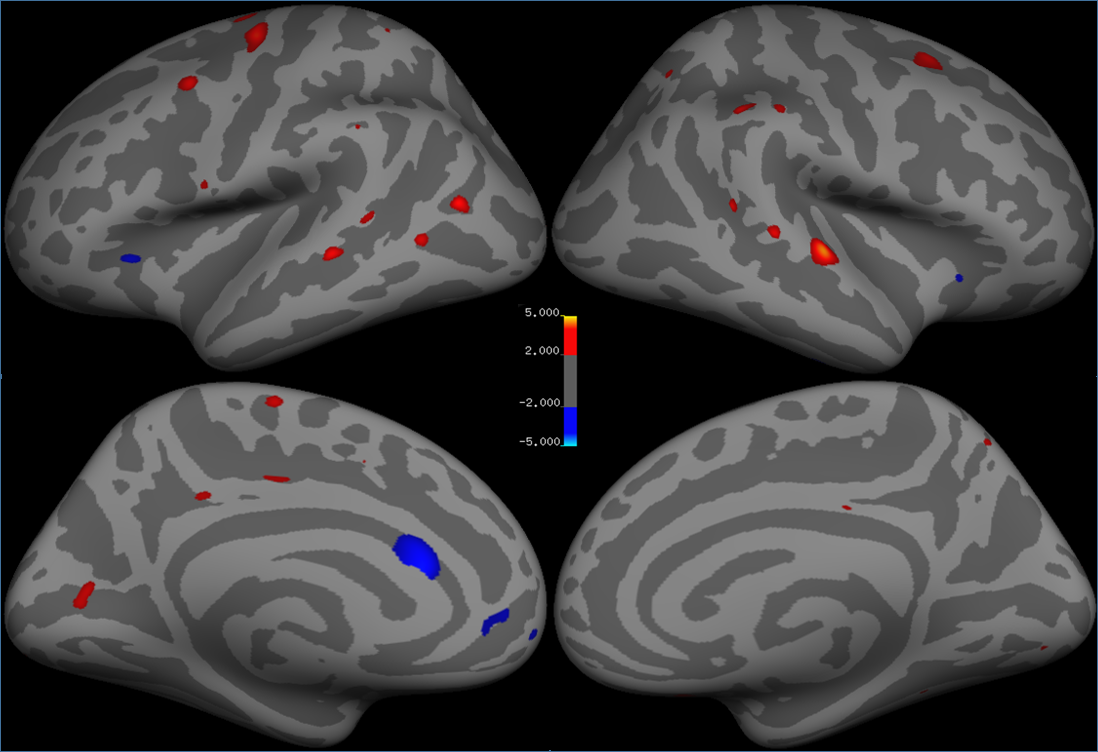
Significant clusters for the left and right hemispheres are reported in Table 1. The left hemisphere contained 20 significant clusters: 10 in the frontal lobe, 5 in the parietal lobe, 3 in the temporal lobe, and 2 in the occipital lobe. The right hemisphere had 3 clusters in the frontal lobe, 5 in the parietal lobe, 5 in the temporal lobe, and 1 in the occipital lobe. Thicker frontal regions were predominantly left sided and parietal regions were bilateral. These regions included caudal middle frontal, medial orbital frontal, anterior cingulate, and superior parietal which are part of the central executive and attention networks. Bilateral superior temporal and bankssts regions are part of the memory network. The cortical parcellations provided by FreeSurfer are shown in Figure 1. The localization of the statistically significant clusters in our patient population are provided in Figure 2.
DISCUSSION
The results reveal generally thicker cortex in the treatment group when compared to the observation group. There were five areas of thicker frontal cortex in the observation group, possibly suggesting a compensatory network. Thicker cortex in the patients treated with HU found in the frontal and parietal regions suggests that the central executive and attention networks may be preserved in the treatment group more than the observation group. Additionally, bilateral significant differences in the temporal lobes could indicate preserved memory performance in treated patients.CONCLUSION
Our preliminary imaging findings suggest that there are significant differences between patients receiving HU therapy and an observational group. The implications of these findings should be further evaluated for their impact on neurocognitive performance and Diffusion Tensor Imaging.Acknowledgements
We acknowledge the funding in part by the Cancer Center Support Grant P30 CA-21765 from the National Cancer Institute, and ALSAC.References
1. Brandling-Bennett EM, White DA, Armstrong MM, Christ SE, DeBaun M. Patterns of verbal long-term and working memory performance reveal deficits in strategic processing in children with frontal infarcts related to sickle cell disease. Dev Neuropsychol. 2003; 24(1):423-434.
2. Ohene-Frempong K, Weiner SJ, Sleeper LA, et al. Cerebrovascular accidents in sickle cell disease: rates and risk factors. Blood. 1998; 91(1):288-294.
3. Miller ST, Macklin EA, Pegelow CH, et al. Silent infarction as a risk factor for overt stroke in children with sickle cell anemia: a report from the Cooperative Study of Sickle Cell Disease. J Pediatr. 2001; 139(3):385-390.
4. Pegelow CH, Macklin EA, Moser FG, et al. Longitudinal changes in brain magnetic resonance imaging findings in children with sickle cell disease. Blood. 2002; 99(8):3014-3018.
5. Fischl B, Dale AM. Measuring the thickness of the human cerebral cortex from magnetic resonance images. Proc Natl Acad Sci U S A. 2000; 97(20):11050-11055.
Figures