3244
An Automatic Classification of Alzheimer’s Disease Based on Structural MRI Data Compared with Voxel-Based Morphometry Method1Department of Radiology, Peking University Third Hospital, Beijing, China, 2University of Chinese Academy of Sciences, Beijing, China, 3University of Electronic Science and Technology of China, Chengdu, China, 4MR Research, GE Healthcare, Beijing, China
Synopsis
In this study, a compartmental sparse feature selection method was used with feature parameter identified, and compared with classical voxel-based morphometry method (VBM) for classification of Alzheimer ’s disease (AD) from the healthy subjects. Our method had high classification accuracy for AD diagnosis and a strong linear correlation between the extracted feature parameter and volume of hippocampus obtained by VBM. The feature parameter of hippocampus had a higher linear correlation with mini-mental state examination (MMSE) score than volume of hippocampus with MMSE. Hence, compartmental sparse feature selection is an effective computer-aided diagnosis method to help clinician identify AD.
Purpose
The purpose of this study is to develop a compartmental sparse feature selection method based on structural magnetic resonance imaging (MRI) data and compared with voxel-based morphometry method.Introduction
In recent years, some machine learning methods have been used to diagnosis Alzheimer’s disease (AD) based on MRI data due to the high feature dimensionality of MRI data [1]. In this study, we used a compartmental sparse feature selection method to determine feature dimensions for different regions of interest (ROIs) related to cerebral atrophy in AD patients[2,3].Then the estimated sparse principle component(SPCs) Yi of bilateral hippocampi of the test data was computed as follow:Yi=Y⋅B, where B is the sparse projection vector and Yi is the projection of the estimated test data Y in the sparse subspace, which can be used as extracted features to reflect the energy information of Y. The high classification accuracy for AD diagnosis and much stronger correlation with MMSE score than that of VBM ensure the feasibility of our method in AD diagnosis and feature parameter Yi can be automatically obtained instead of volume measurement.Method and materials
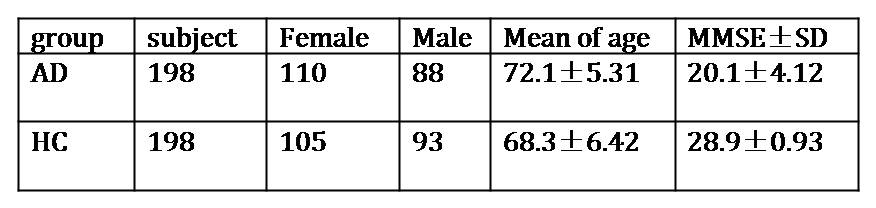
198 Alzheimer's disease (AD group) cases and 198 healthy control (HC group) cases were investigated (Table 1). For all cases, High-resolution 3D T1WI images were acquired on a SIEMENS Trio 3T scanner or a GE MR750 3T scanner. The acquisition parameters were: TR/TE = 2350/3.44 ms, voxel size = 1 X 1 X 1 mm3 on SIEMENS and TR/TE = 4.9ms / minimum, voxel size = 1 X 1 X 1 mm3 on GE scanner. 148 AD and 148 HC cases were randomly selected in training set and 50 AD and 50 HC for testing. 8 ROIs (bilateral amygdalae (AMY), hippocampi (HIP), parahippocampal gyri (PHG), fusiform gyri (Fus), putamina (Put), thalami (Tha), caudate nuclei (Cau) and amygdalae+ hippocampi+ parahippocampal gyri(AHP)) were selected according to AAL template. The proposed method partitioned the normalized 3D T1-weighted gray matter images into several compartments. It performs feature selection and classification compartmentally according to the local feature dimension estimation and local feature selection using sparse principal component analysis (SPCA) method followed with elastic-netlogistic regression (ENLR) classifier[2,3]. Voxel-based morphometry method was used and the same normalized T1 gray matter data were statistically analyzed on SPM8 by two-sample t-test for comparing AD with HC.
Results
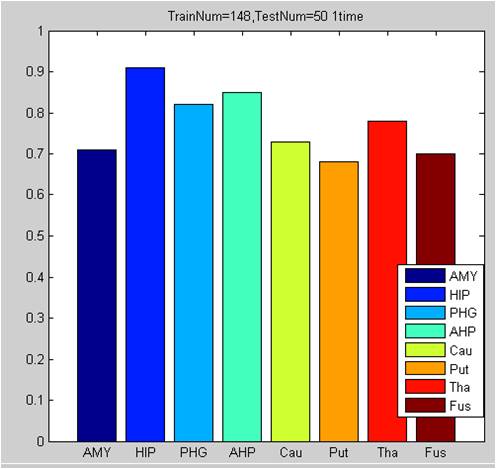
1. The classification accuracy of 8 specified brain regions are as follow (Figure 1). Accuracy of AMYG, HIP, PHG,AHP, Cau, PG, Put,Tha and Fus is 0.71, 0.91, 0.82, 0.85, 0.73, 0.68, 0.78 and 0.70 respectively(Figure 1).
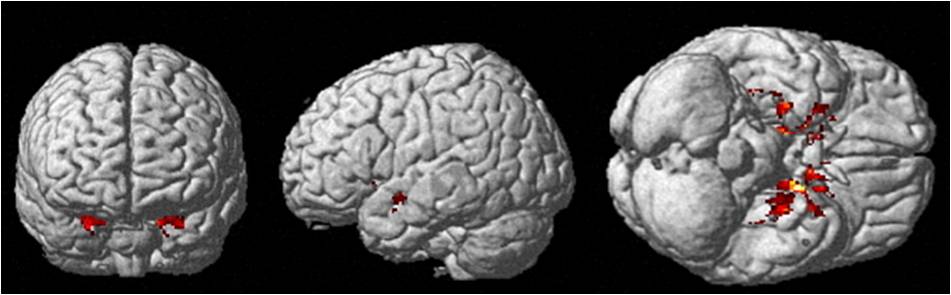
2. Cortical volumes decreased significantly (p corrected< 0.05, T=5.01,corrected for multiple comparisons, cluster>50 voxels) in AD compared to HC in bilateral hippocampi, parahippocampal gyri, amygdalae, caudate nuclei, putamina, thalami and left fusiform gyrus (Figure 2).
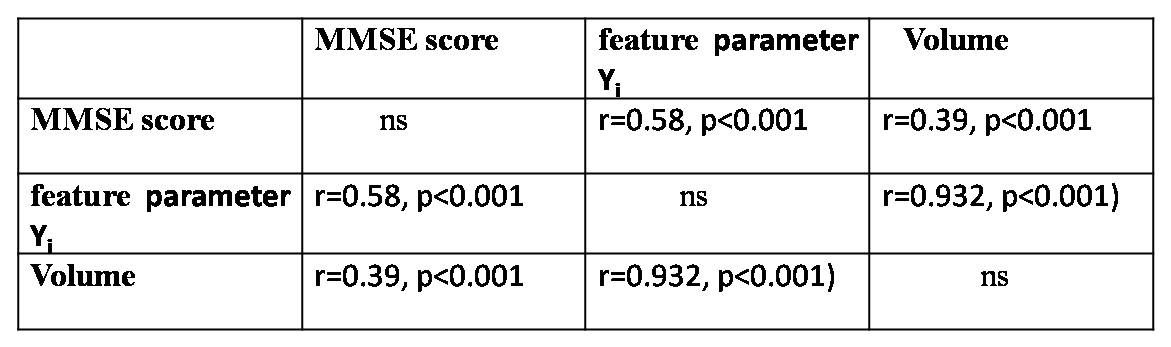
3. There is a strong correlation between feature parameter value Yi of bilateral hippocampi and its volume (r=0.932, p<0.001). Yi of bilateral hippocampi has much higher correlation with MMSE score (r=0.58, p<0.001) than volume with MMSE (r=0.39, p<0.001) (Table 2).
Discussion and Conclusion
Our results revealed high classification accuracy for AD diagnosis by using compartmental sparse feature selection method. The feature parameter value Yi of our method is more accurate than volume of gray matter obtained by classical VBM method to quantify cerebral atrophy and progress of AD. Compartmental sparse feature selection is an effective computer-aided diagnosis method to help clinician identify AD.Acknowledgements
No acknowledgement found.References
1. Falahati F, Westman E, Simmons A.Multivariate data analysis and machine learning in Alzheimer's disease with a focus on structural magnetic resonance imaging.J Alzheimers Dis. 2014;41(3):685-708.
2. Yan Liu , Ling Wang, Xiangzhu Zeng, Zheng Wang, Yajun Gao, Qiuyue Wang. Compartmental Sparse Feature Selection Method for Alzheimer’s disease Identification. EMBC’2017, pp: 3073 – 3076, 11-15, July, 2017, Seogwipo, South Korea.
3. Ling Wang, Yan Liu, Hong Cheng,Xiangzhu Zeng, Zheng Wang. Elastic Net based sparse feature learning and classification for Alzheimer’s disease identification. EMBC’2017, pp: 2288 -2291, 11-15, July, 2017, Seogwipo, South Korea.
Figures