3243
Brain morphometry using diffusion MRI data (DTBM) reveals abnormalities in Down Syndrome that are not detected by conventional DTI analysis.1Quantitative Medical Imaging Section, NIBIB, NIH, Bethesda, MD, United States, 2Department of Psychology, Drexel University, Philadelphia, PA, PA, United States
Synopsis
We performed Tensor Brain Morphometry (TBM) as well as conventional FA analysis to compare the brains of subjects with Down Syndrome (DS) to typically developing Healthy Controls (HC). TBM deformation fields were computed from T1 weighted images (T1-TBM), as well as from diffusion data (D-TBM). D-TBM identifies differences between DS and HC brains that would have gone completely undetected by conventional TBSS analysis of FA results.
Introduction
In a clinical research setting, Diffusion MRI data are typically processed by computing diffusion metrics, such as mean diffusivity and fractional anisotropy1 in each voxel. Potential differences between patients and controls are then assessed by performing statistical tests on the computed diffusion metrics after spatial normalization of data from different individuals into a given template. This approach aims at detecting brain abnormalities in local tissue composition, structure, and architecture by attempting to remove individual morphological variability. About 20 years ago, authors proposed to analyze the deformation fields used for spatial normalization to gain complementary information about the relative shape and size of anatomical structures2,3. A well-known approach, named Tensor Based Morphometry (TBM), consists in measuring the determinant of the Jacobian (J) of the transformation to morph the brain of each subject into the template of the control population3. A negative value of Log J signifies that the patient brain is smaller than the controls (Atrophy or hypoplasia) while a positive value indicates the opposite. Log J values can be computed locally before or after having performed an affine registration to account for global differences in brain volume. TBM is typically performed using T1 weighted images (T1WI). Recently, new methods for correcting EPI induced distortions that affect diffusion images4,5, as well as new methods to perform robust and accurate spatial normalization of diffusion MRI datasets6 have become available. These technical advances allow for the first time to perform morphometry using diffusion MRI data (D-TBM) rather than T1WI, taking advantage of the unique ability of diffusion MRI to depict individual white matter pathways in regions that appear homogeneous in T1WIs. Here we apply D-TBM to the study of potential differences between the brain of subjects affected by Down Syndrome (DS) and matched Healthy Controls (HC). We also analyze the same diffusion data with established conventional diffusion analysis methods for comparison.Methods
All scans were completed on a 3-Tesla General Electric Scanner. Usable MRI data were obtained in a group of 15 DS (age: mean=16.13; SD=6.64) and 29 HC (age: mean=14.5, SD=4.04). DTI datasets consisted of 60 volumes with 6 b=0, 12 b=300, and 42 b=1100s/mm2. Resolution was 2.5 mm isotropic zero-filled at the scanner to 1.87x1.87x2.5 mm. Data were processed using TORTOISE version 2.5.2 software7. T1WIs were collected with a 3D gradient echo sequence (resolution 0.94 × 0.94 × 1.2 mm). An average brain diffusion tensor (DT) template from the 29 HC was created using the DRTAMAS registration software6. The brain DT of each HC and DS subject was registered to the control template and Log J maps were computed. Fractional anisotropy (FA) and Mean Diffusivity maps were also computed from each subject’s spatially normalized DT. Similarly, spatial normalization of T1WIs was performed but using the ANTs software8. Group differences in FA, MD as well as in Log J maps for both DTI and T1WI were assessed using tract based spatial statistics (TBSS) and threshold free cluster enhancement (TFCE) analysis tools9,10. For all metrics effect size maps for the populations were computed using the Cohen’s d formula: ((mean of patients)-(mean of controls))/ pooled standard deviation.Results
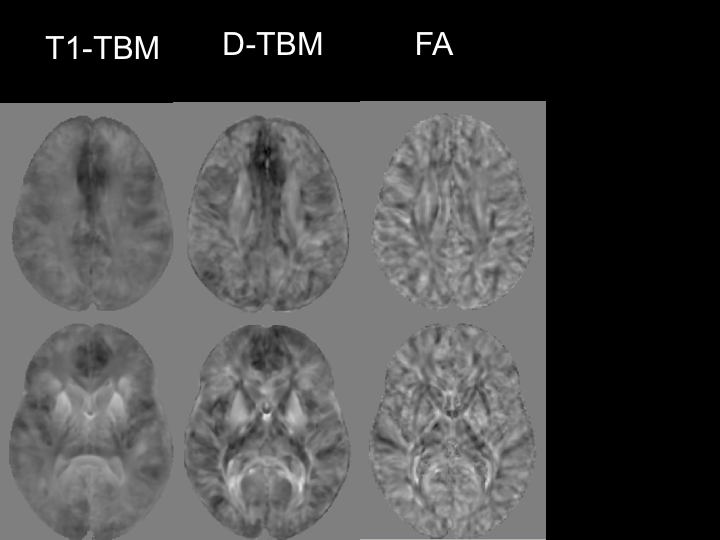
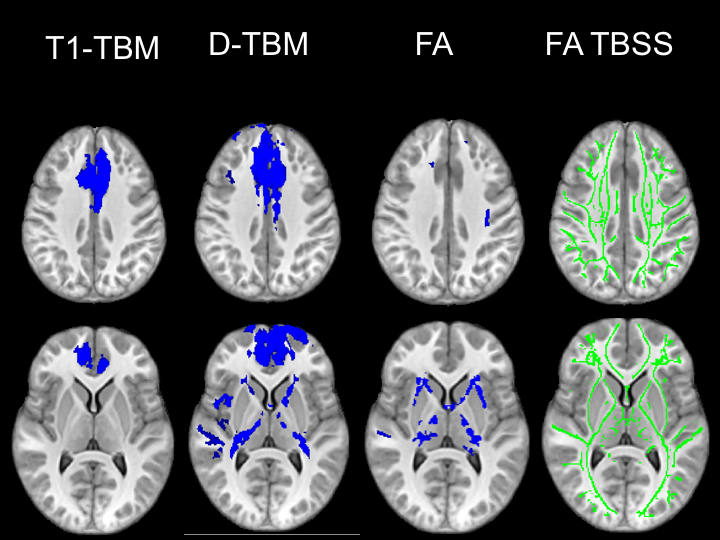
The mean Jacobian computed for the affine registration with D-TBM was 0.972±0.052 for HC and 0.897±0.081 for DS. Therefore, DS brains were on average about 10% smaller than HC brains (p=0.0003, unpaired t-test). Figures 1 and 2 show voxelwise maps of the effect size for Log J obtained from T1WI (T1-TBM), as it is typically done, as well as from Diffusion MRI data (D-TBM) as we are proposing. Figure 1 and 2 report also the effect size for FA. Note the striking pattern of fronto-pontine-cerebellar atrophy or hypoplasia revealed by D-TBM and the profound differences between the FA-based and TBM-based analysis. Figures 3 and 4 show in blue statistically significant differences at TFCE between DS and HC. This analysis is performed after having removed the effect of global scaling. The column on the right shows the TBSS analysis. TBSS analysis does not find any significant difference between DS and HC while the fronto-pontine-cerebellar atrophy/hypoplasia is strikingly evident with D-TBM.Discussion and Conclusions
A remarkable finding of our study is that the novel D-TBM method we propose identifies differences between DS and HC brains that would have gone completely undetected by conventional TBSS analysis of FA results. Moreover, compared to T1-TBM, D-TBM shows a better spatial localization of the abnormalities, in particular in white matter. D-TBM highlights selective severe atrophy/hypoplasia of fronto-pontine-cerebellar regions and of white matter tracts that may connect these regions. More generally, our results indicate that D-TBM can provide unique information that complement those obtained with more conventional diffusion analysis methods.Acknowledgements
This work was supported by the Intramural Research Programs of the National Institute of Biomedical Imaging and Bioengineering (NIBIB), and of the National Institute of Mental Health (NIMH).References
1) Basser PJ, Pierpaoli C. Microstructural and physiological features of tissues elucidated by quantitative-diffusion-tensor MRI. J Magn Reson B. 1996 Jun;111(3):209-19.
2) Davatzikos, C., Vaillant, M., Resnick, S. M., Prince, J. L., Letovsky, S., and Bryan, R. N. 1996. A computerized approach for morphological analysis of the corpus callosum. J. Comput. Assist. Tomogr. 20: 88–97.
3) Ashburner J1, Friston KJ. Voxel-based morphometry--the methods. Neuroimage. 2000 Jun;11(6 Pt 1):805-21.
4) Wu M. et al. (2008) Comparison of EPI Distortion Correction Methods in Diffusion Tensor MRI Using a Novel Framework. In: Metaxas D., Axel L., Fichtinger G., Székely G. (eds) Medical Image Computing and Computer-Assisted Intervention – MICCAI 2008. MICCAI 2008. Lecture Notes in Computer Science, vol 5242. Springer, Berlin, Heidelberg.
5) Irfanoglu MO, Modi P, Nayak A, Hutchinson EB, Sarlls J, Pierpaoli C. DR-BUDDI (Diffeomorphic Registration for Blip-Up blip-Down Diffusion Imaging) method for correcting echo planar imaging distortions. Neuroimage. 2015 Feb 1;106:284-99
6) Irfanoglu MO, Nayak A, Jenkins J, Hutchinson EB, Sadeghi N, Thomas CP, Pierpaoli C. DR-TAMAS: Diffeomorphic Registration for Tensor Accurate Alignment of Anatomical Structures. Neuroimage. 2016 May 15;132:439-454
7) C. Pierpaoli, L. Walker, M. O. Irfanoglu, A. Barnett, P. Basser, L-C. Chang, C. Koay, S. Pajevic, G. Rohde, J. Sarlls, and M. Wu, 2010, TORTOISE: an integrated software package for processing of diffusion MRI data, ISMRM 18th annual meeting, Stockholm, Sweden, #1597
8) Avants BB, Tustison NJ, Song G, Cook PA, Klein A, Gee JC. A reproducible evaluation of ANTs similarity metric performance in brain image registration. Neuroimage. 2011 Feb 1;54(3):2033-44
9) Winkler AM, Ridgway GR, Webster MA, Smith SM, Nichols TE. Permutation inference for the general linear model. NeuroImage, 2014;92:381-397
10) Smith SM, Nichols TE. Threshold-free cluster
enhancement: addressing problems of smoothing, threshold dependence and
localisation in cluster inference. Neuroimage. 2009;44(1):83-98.
Figures