3241
Oscillating gradient spin echo (OGSE) diffusion weighted imaging of the epidermoid cysts: simulation application1Department of Radiology, Juntendo University Graduate School of Medicine, Tokyo, Japan, 2Department of Radiology, Graduate School of Medicine, The University of Tokyo, Tokyo, Japan, 3LPixel Inc., Tokyo, Japan, 4Department of Radiological Sciences, Graduate School of Human Health Sciences, Tokyo Metropolitan University, Tokyo, Japan, 5Department of Human Pathology, Juntendo University School of Medicine, Tokyo, Japan, 6Hôpital Cochin, Paris, France
Synopsis
Diffusion weighted imaging with shorter diffusion time using oscillating gradient spin echo (OGSE) may reveal microstructural features among brain disorders. Here we observed apparent diffusion coefficient (ADC) values in three patients with intracranial epidermoid cysts. ADC values measured by OGSE were higher than those measured by pulsed gradient spin echo (PGSE; used in conventional MRI), indicating restricted diffusion due to spatial restriction. The results of our diffusion simulation based on the pathological feature of epidermoid cysts suggest that spatial restriction of “Rugby Ball” regions formed by keratin layers should mainly affect the extent of restricted diffusion.
INTRODUCTION
Apparent diffusion coefficient (ADC) values in diffusion weighted imaging (DWI) depend on the effective diffusion time (⊿eff), which is the time allowed for water molecules to diffuse and probe the microstructural information in vivo.1,2 Oscillating gradient spin echo (OGSE) enables shorter diffusion time than pulsed gradient spin echo (PGSE; used in conventional MRI). Thus, OGSE DWI may reveal microstructural changes among brain disorders.3,4 In the 1980s, intracranial epidermoid cyst was a key disease to develop DWI, and its radiologic-pathologic correlation has been delineated.5-8 So far, however, no study has revealed the details of restricted diffusion in the epidermoid cyst using shorter diffusion time. The aim of this study was to analyze the factor of restricted diffusion in the epidermoid cyst using OGSE through simulation.METHODS
Three patients (3 females, mean age 30.0 years, age range 20-39 years) were included in this study, and scanned on a 3T MR scanner (MAGNETOM Prisma, Siemens Healthcare, Germany) with a 20-channel head coil. DWI was performed with prototype sequences using b-values of 0 and 1500 s/mm2 (number of excitations 1 and 4, respectively) and three diffusion-encoding directions for each PGSE (⊿eff = 47.3 ms; diffusion gradient pulse duration [δ], 41.3 ms; diffusion gradient separation [Δ], 57.1 ms) and OGSE with trapezoid-sine waveforms (frequency = 50 Hz; ⊿eff = 8.5 ms; δ = 7.1 ms; Δ = 50 ms).4 Other parameters were as follows: repetition time (TR), 4600 ms; echo time (TE), 120 ms; field-of-view, 200 x 200 mm2; matrix size, 72 x 72; slice thickness, 4 mm; and acquisition time, 76 seconds for PGSE and 93 seconds for OGSE. Regions of interest (ROIs) 0.3 cm2 in size were placed within the epidermoid cysts on the ADC maps.
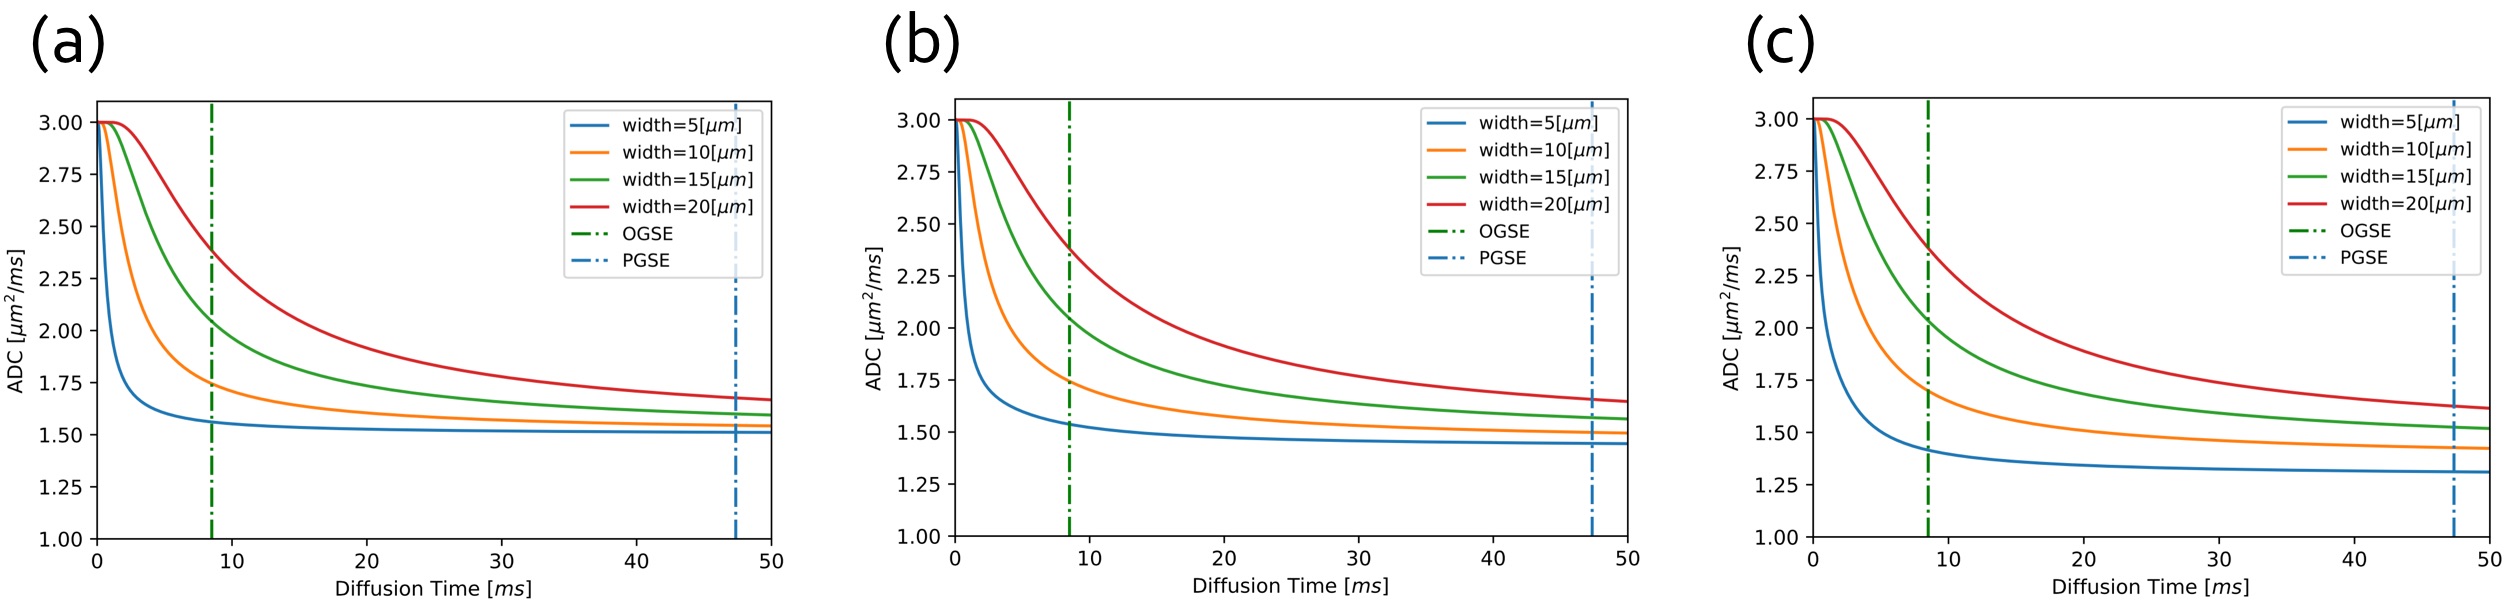
On simulation modelling, diffusion equation was discretized by finite-difference methods.9 The rectangle with infinite length was assumed as keratin layers within epidermoid cysts. Water molecules diffused throughout the rectangle with diffusion coefficient of 3.0 µm2/ms, and performed total reflection after hitting the layer. Also, sine curve layers with a period of 50 µm and 200 µm were considered. Width between the layers (5, 10, 15 and 20 µm) and diffusion times were variable. ADC values were measured by the estimation of existence probability of water molecules in the time interval of 0.0001 ms and square length of 0.05 µm.
RESULTS
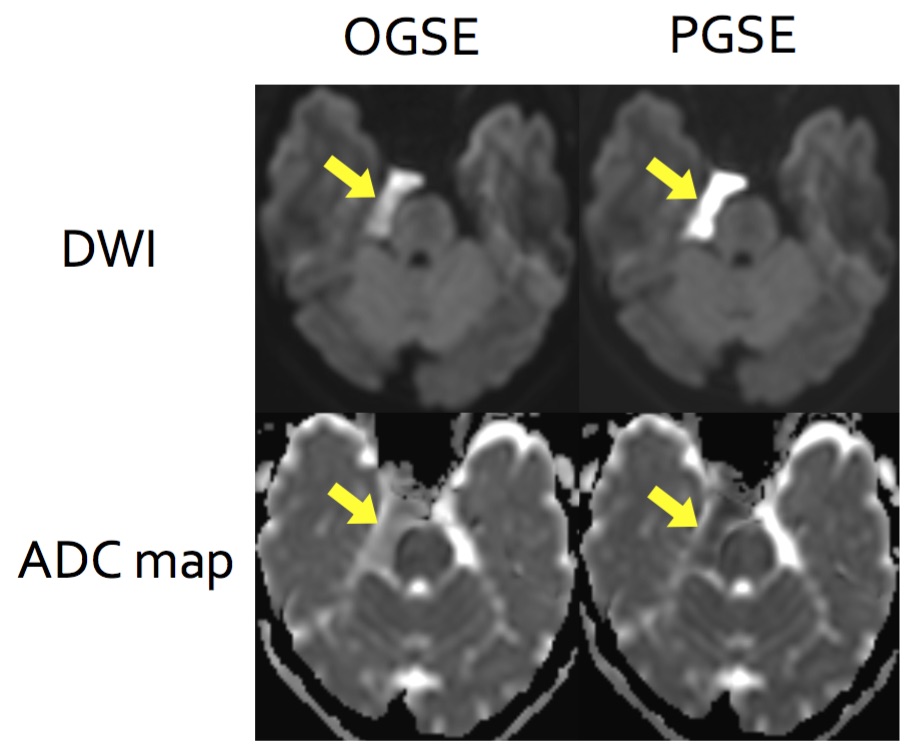
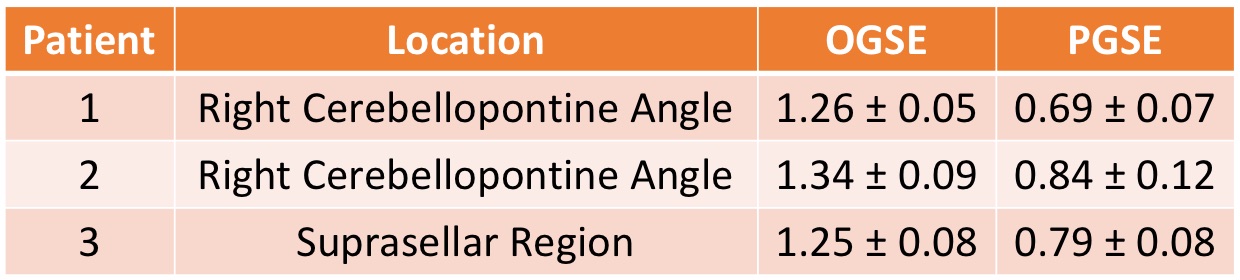
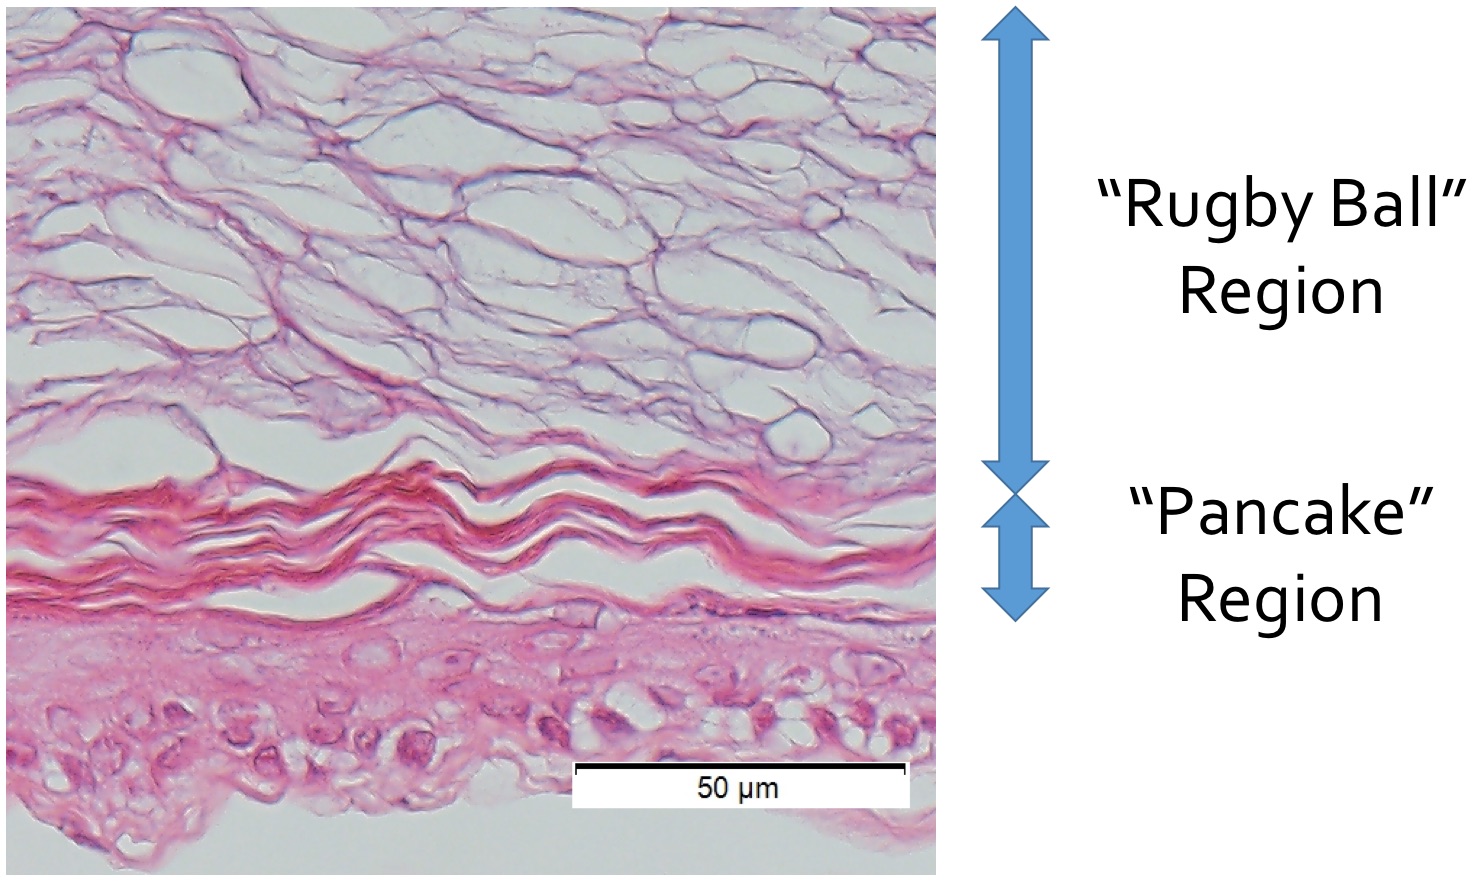
A representative case of epidermoid cyst was shown in Figure 1. ADC values of epidermoid cysts measured by OGSE (average 1.28 µm2/ms) were higher than those measured by PGSE (average 0.77 µm2/ms) (Table 1). Histopathology of epidermoid cysts revealed a squamous epithelial lining with laminated layers of keratin filaments (Figure 2). There seems to be two regions formed by layers: “Rugby Ball” region and “Pancake” region. The distance between two layers of keratin was approximately 5-20 µm, and thus we modeled the rectangles and sine curves shown in Figure 3. ADC values of rectangle simulation (Figure 4(a)) were mostly similar to those of wide sine curve simulation (Figure 4(b)). On both simulations, ADC range on OGSE was from 1.55 (width = 5 µm) to 2.38 µm2/ms (width = 20 µm), and converged to 1.50 µm2/ms with increasing diffusion time. In the narrow sine curve simulation (Figure 4(c)), ADC range on OGSE was from 1.40 (width = 5 µm) to 2.38 µm2/ms (width = 20 µm), and converged to 1.30 µm2/ms.
DISCUSSION
The difference in ADC values between OGSE and
PGSE reflects restricted diffusion due to spatial restriction. ADC
values of our diffusion simulation based on the “Pancake” region of epidermoid
cysts were totally higher than those of epidermoid cyst cases, since dimension
should be considered in the diffusion equation. Even though our two-dimensional simulation extends to
three-dimensional one, ADC values of the “Pancake” simulation may be still
higher than those of real cases, although the amplitude and frequency of sine
curves can affect the degree of ADC values. The above discussion indicates that
spatial restriction of “Rugby Ball” region, which has more number of walls than
“Pancake” region, should mainly affect the extent of
restricted diffusion.CONCLUSION
The results of our diffusion simulation based on the “Pancake” region of epidermoid cysts suggest that spatial restriction of “Rugby Ball” regions formed by keratin layers should mainly influence ADC values and the extent of restricted diffusion.Acknowledgements
We gratefully acknowledge thoughtful comments of Katsutoshi Murata and Dr. Thorsten Feiweier from Siemens Healthcare. There are no conflicts of interest with any authors.References
1. Novikov DS, et al. Revealing mesoscopic structural universality with diffusion. Proceedings of the National Academy of Sciences 2014;111(14):5088-93.
2. Baron CA, Beaulieu C. Oscillating gradient spin-echo (OGSE) diffusion tensor imaging of the human brain. Magn Reson Med 2014;72(3):726-36.
3. Hori M, et al. Teaching Neuroimages: Obscured Cerebral Infarction on MRI. Clin Neuroradiol 2017.
4. Van AT, et al. In vivo investigation of restricted diffusion in the human brain with optimized oscillating diffusion gradient encoding. Magn Reson Med, 2014;71(1):83-94.
5. Smith AB, et al. From the archives of the AFIP: lesions of the pineal region: radiologic-pathologic correlation. Radiographics 2010;30(7):2001-20.
6. Osborn AG, Preece MT. Intracranial cysts: radiologic-pathologic correlation and imaging approach. Radiology 2006;239:650-64.
7. Annet L, et al. Apparent diffusion coefficient measurements within intracranial epidermoid cysts in six patients. Neuroradiology 2002;44:326-28.
8. Santhosh K, et al. Diffusion tensor and tensor metrics imaging in intracranial epidermoid cysts. J Magn Reson Imaging 2009;29:967-70.
9. Warming RF, Hyett BJ. The modified equation approach to the stability and accuracy analysis of finite-difference methods. Journal of Computational Physics 1974;14(2):159-79.
Figures