3238
Reliability of Neurite Orientation Dispersion and Density Imaging (NODDI) at 9.4 Tesla1CFMM, Robarts Research Institute, London, ON, Canada, 2Medical Biophysics, Western University, London, ON, Canada
Synopsis
Neurite Orientation Dispersion and Density Imaging (NODDI) is a rapidly emerging diffusion MRI (
Purpose
Neurite orientation dispersion and density imaging (NODDI) is a novel diffusion MRI method that may improve upon the specificity of diffusion weighted MRI (DWI) by distinguishing unique diffusion patterns within three separate microstructural environments: intra-neurite, extra-neurite, and cerebral spinal fluid compartments.1 The sensitivity of this method to in-vivo neurite morphology may provide unique information regarding neural health. While the development and application of NODDI in humans2-6 has proceeded rapidly, the use of NODDI in pre-clinical models is still relatively new. Due to the common use of rodent models in pre-clinical imaging, the purpose of this work was to determine the reliability of NODDI in a rat model at 9.4 Tesla.Methods
Imaging: MRI was performed on a 9.4-T/31-cm small animal MRI scanner (Agilent, Santa Clara, CA, USA). A 7-channel phased array receive coil with a 2-channel transmit coil was designed for this study. 8 Male Sprague Dawley Rats (age 102 ± 13 days, weight 323 ± 37g) were scanned twice with 7 days ± 1 day between scans.
Sequence: The NODDI diffusion encoding scheme utilized a multi-shot spin-echo echo planar imaging (SE-EPI) acquisition pulse sequence (slice thickness = 500 mm, 250 x 250 mm in plane resolution, 31 total slices, TE = 36 ms, TR=5.0s, 4 shot EPI acquisition, 2 averages). A two-shell diffusion protocol was used resulting in a total imaging time of 96 minutes (Shell one: 36 directions, b-value = 1000 s/mm2, G = 149 mT/m, Δ = 17 ms, δ = 4.5 ms, TR = 5.0s, 4 b=0 volumes; Shell two: 72 directions, b-value = 2000 s/mm2, G = 298 mT/m, Δ = 17 ms, δ = 4.5 ms, TR = 5.0s, 8 b=0 volumes).
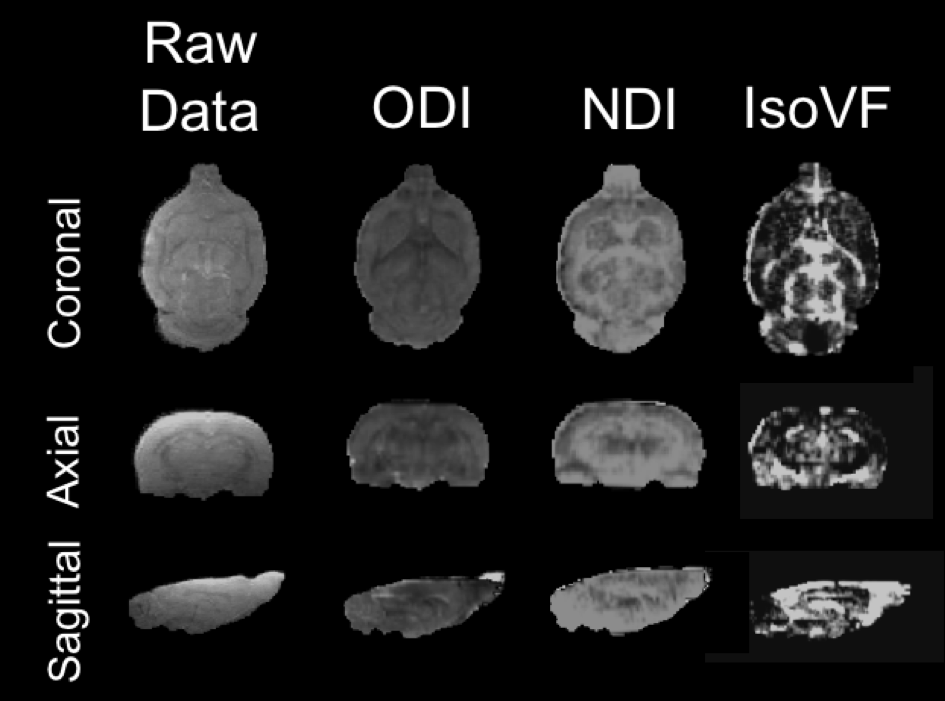
Analyses: Images were pre-processed using fMRI Software Library (FSL, v.5.0.10, Oxford, UK). EDDY was used to correct for eddy current and susceptibility-induced distortions.7 The NODDI Matlab toolbox (UCL Microstructure Imaging Group) was then used to produce maps of ODI, NDI, and IsoVF. Both mean region of interest (ROI) analyses, and whole brain voxel-wise analyses were performed. ROI analyses focused on four relevant regions of interest (thalamus, corpus callosum, dentate gyrus, and hippocampus) as well as whole brain white and grey matter. In both the ROI and voxel-wise analyses the scan-rescan reproducibility and reliability were characterized using the coefficient of variation (CV).
Results
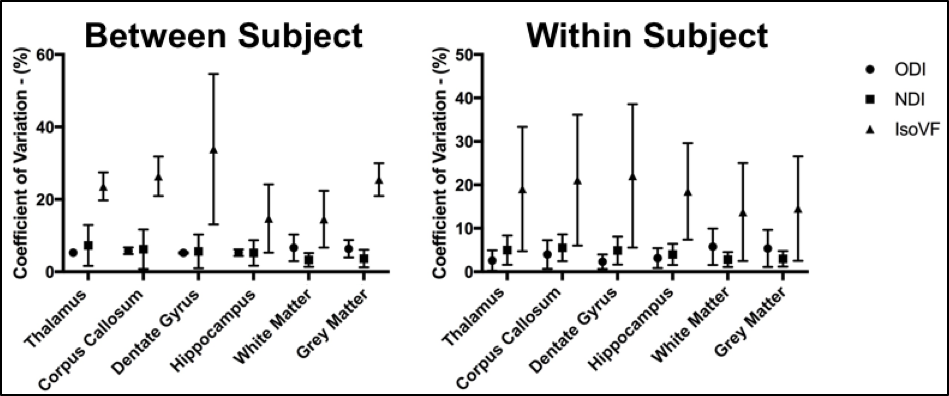
When analyzing the resulting NODDI maps (Figure 1) using mean values for a given ROI, both ODI and NDI showed low CVs within all regions, as well as low dispersion between values. Mean CVs for ODI ranged from 4-9% within all ROI’s while values of NDI ranged from 2-11% within all ROI’s. In contrast, mean IsoVF CVs were very high and widely dispersed, ranging from 9-49% (Figure 2).
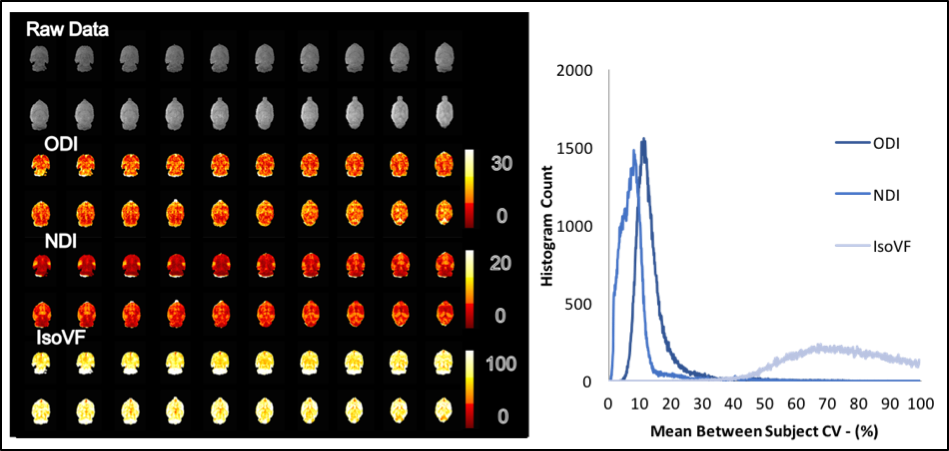
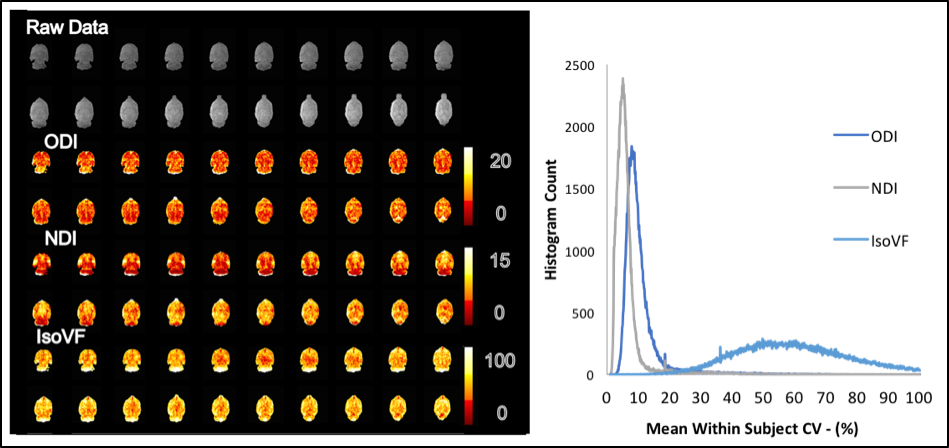
In the voxel-wise analysis, in the between subject histogram (Figure 3) over 90% of voxels fell below a CV of 20% for ODI and 15% for NDI. The within subject’s histogram showed even lower voxel-wise CV with over 90% of voxels below a CV of 17% for ODI and 12% for NDI (Figure 4). Again, high CVs were observed for IsoVF, ranging well above 100% for many voxels.
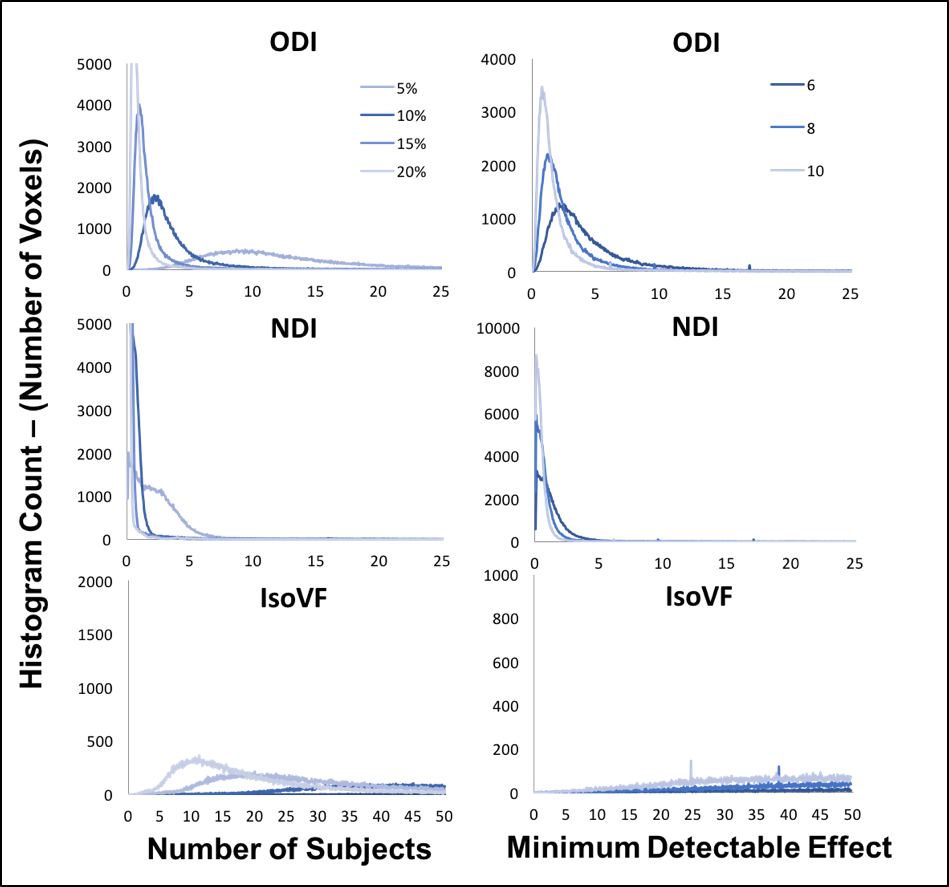
Using the between subject whole brain voxel-wise CV’s, the minimum number of subjects was determined on a voxel-wise basis that would allow detection of a statistically significant change in each metric of 5%-20% between subjects (Figure 5). NDI was the most sensitive metric, with detection of even subtle changes (on the order of 5%) in all voxels with feasible sample sizes (n < 6). ODI changes on the order 10% were detectable in all voxels for small sample sizes, but required large sample sizes (n > 10) for whole brain voxel-wise detection of very small changes. Very large sample sizes were found necessary to detect changes in IsoVF of any magnitude on a voxel-wise basis. Using the within subject whole brain voxel-wise CV’s, the minimum statistically significant change that could be detected in each metric on a voxel-wise basis was determined based on a scan re-scan protocol for sample sizes of 6, 8 and 10 within each group. Once again NDI was the most sensitive metric, detecting very small changes (<5%) with standard sample sizes. ODI was slightly less sensitive but again was able to detect small changes (<10%) on a scan-rescan basis with standard sample sizes. Finally, IsoVF again was unable to detect significant changes at feasible samples sizes.
Conclusions
This study indicates that NODDI measurement of ODI and NDI at 9.4 Tesla is reproducible for the study of rat models of neurological conditions and may detect subtle microstructural changes.Acknowledgements
No acknowledgement found.References
1. Zhang H, Hubbard PL, Parker GJM, Alexander DC. Axon Diameter Mapping in the Presence of Orientation Dispersion with Diffusion MRI. NeuroImage. 2011;56(3):1301–1315.
2. Zhang H, Schneider T, Wheeler-Kingshott CA, Alexander DC. NODDI: Practical in vivo neurite orientation dispersion and density imaging of the human brain. NeuroImage. 2012;61(4):1000–1016.
3. By S, Xu J, Box BA, Bagnato FR, Smith SA. Application and evaluation of NODDI in the cervical spinal cord of multiple sclerosis patients. NeuroImage: Clinical. 2017;15:333–342.
4. Chung AW, Seunarine KK, Clark CA. NODDI reproducibility and variability with magnetic field strength: A comparison between 1.5 T and 3 T. Human Brain Mapping. 2016;37(12):4550–4565.
5. Slattery CF, Zhang J, Paterson RW, Foulkes AJ, Mancini L, Thomas DL, Modat M, Toussaint N, Cash DM, Thornton JS, et al. Neurite orientation dispersion and density imaging (NODDI) in young-onset Alzheimers disease and its syndromic variants. Alzheimers & Dementia. 2015;11(7).
6. Wen Q, Kelley DA, Banerjee S, Lupo JM, Chang SM, Xu D, Hess CP, Nelson SJ. Clinically feasible NODDI characterization of glioma using multiband EPI at 7 T. NeuroImage: Clinical. 2015;9:291–299.
7. Andersson JL, Sotiropoulos SN. An integrated approach to correction for off-resonance effects and subject movement in diffusion MR imaging. NeuroImage. 2016;125:1063–1078.
Figures