3236
Time-dependent diffusion modeling using a hollow textile-based Phantom1Learning Research and Development Center, University Of Pittsburgh, Pittsburgh, PA, United States, 2Biological Cybernetics, Max Planck Institute, Tuebingen, Germany, 3Learning Research and Development center, University of Pittsburgh, Pittsburgh, PA, United States, 4Phantom Metrics division, Psychology Software Tools, Inc, Pittsburgh, PA, United States, 51Learning Research and Development center, University of Pittsburgh, Pittsburgh, PA, United States
Synopsis
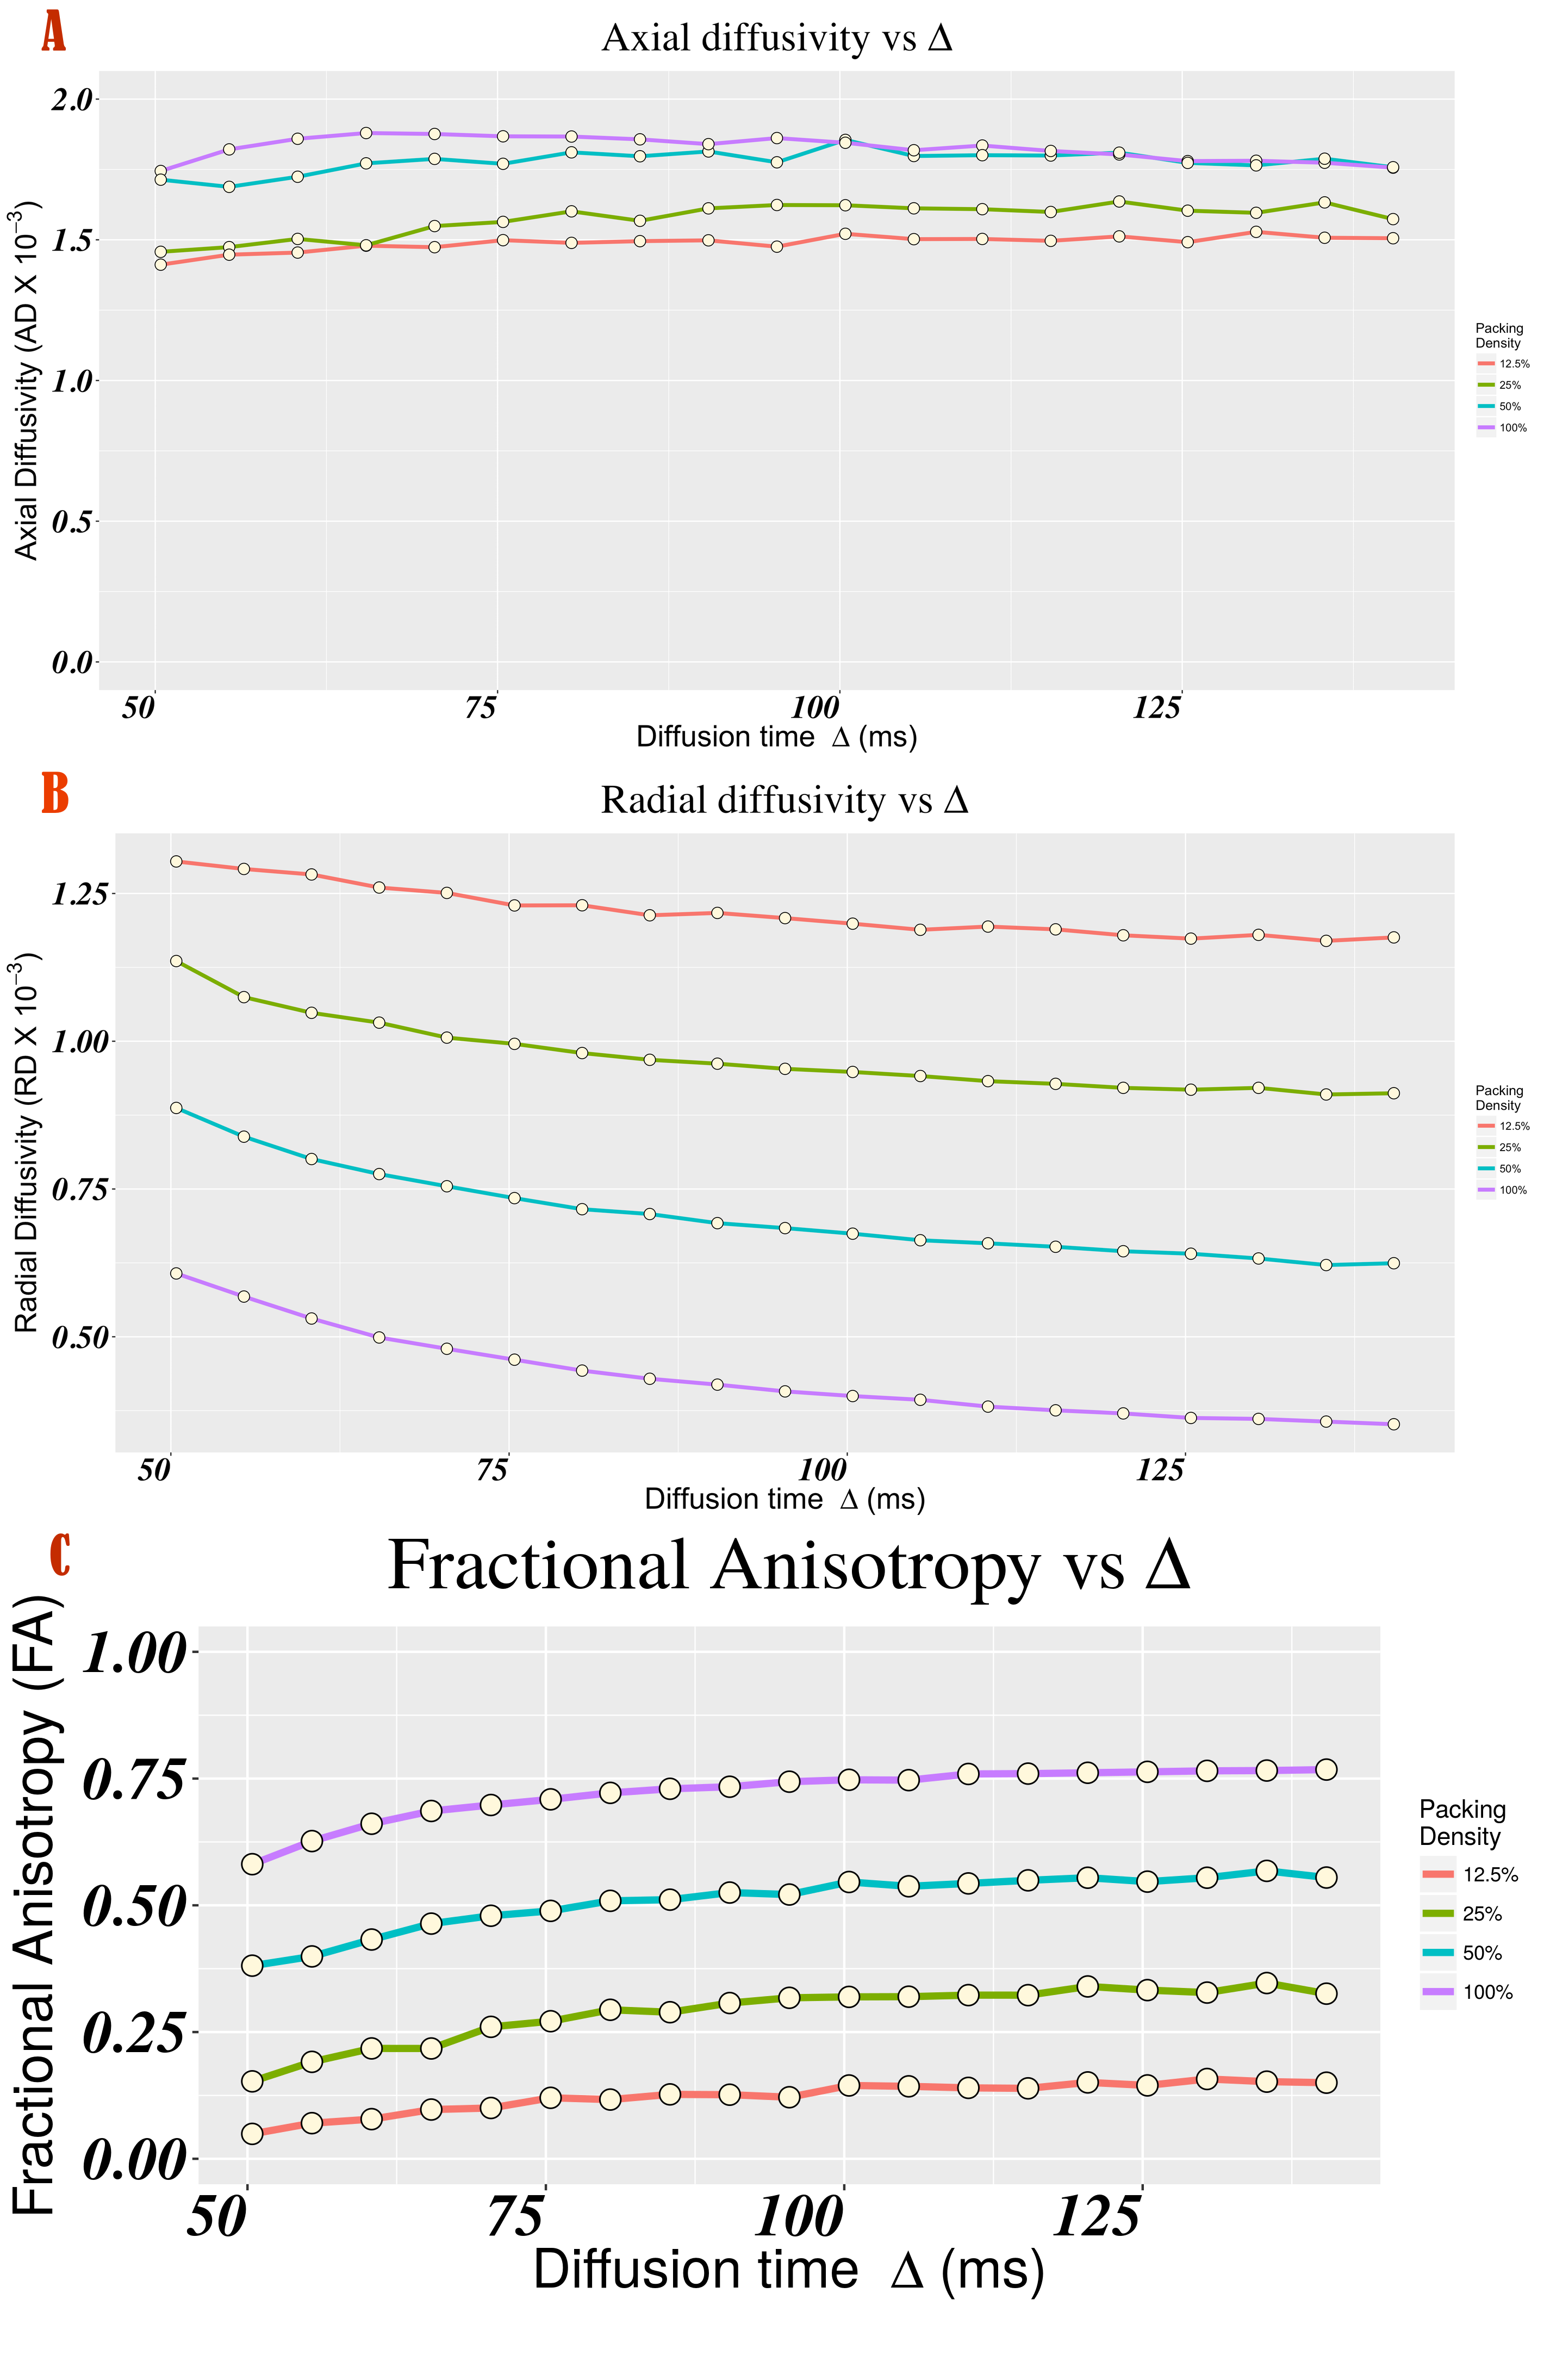
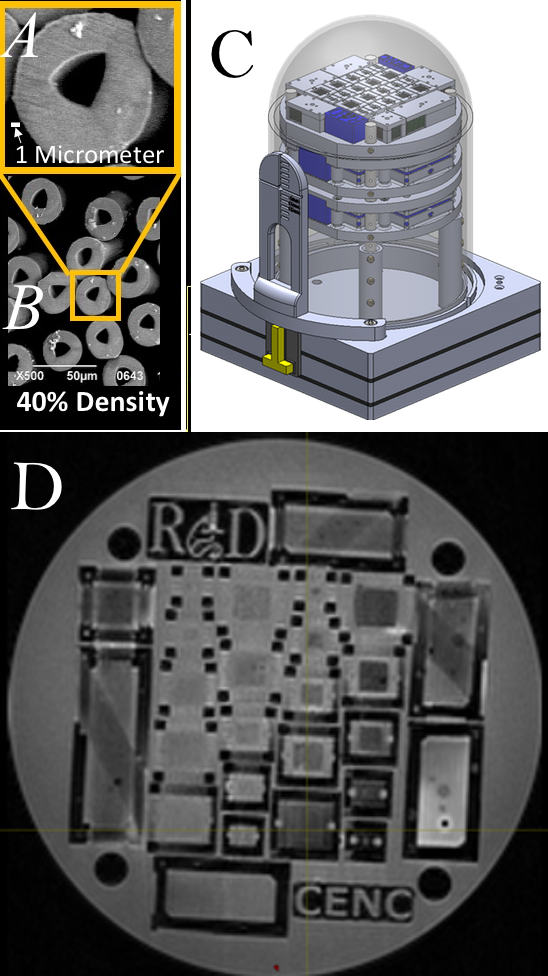
A Textile Anisotropic Brain Imaging Phantom incorporating textile water filled hollow fibers (taxons with inner/outer diameter 12/34 micron) is used to examine time-dependent diffusion. In this study, impermeable hollow tubes (taxons) with 12-micron diameter are used to test the relationship between axial and radial diffusivities with diffusion time (Δ) for a given taxon packing density. An inverse relationship of radial diffusivity with diffusion time (Δ) is established. A constant relationship of axial diffusivity with diffusion time is established. The dependence of these relationships on packing density is then tested and the radial diffusivity relationship is shown to vary with packing density.
Introduction
Diffusion MRI (dMRI) can estimate tissue microstructure that depends upon the cellular length scale. Diffusion length can be related axonal diameter(s) and packing density. By manipulating either diffusion gradient (G) and/or diffusion time (Big Delta, Δ), the sensitivity of length scale can be studied using diffusion imaging (PGSE sequence4). Equation (1) shows the relationship between diffusion time, gradient strength and b-value that can be used to vary diffusion time length. Investigation of these relationships to date2,3,5,6 has been limited by a need to confirm results with histological analysis. Empirical determination of the relationship between Δ and diffusion measurements such as radial and axial diffusivity in a sample with manufactured microstructure can validate and calibrate dMRI biophysical modeling such as mathematical models for restricted and hindered compartments.
$$b = \gamma^{2} G^{2} \delta^{2} \left( \Delta - \frac{\delta}{3} \right) $$
In this study diffusion time (Δ) was manipulated by making b-value constant and varying the diffusion gradient (G). Axial and radial diffusivity measurements are derived from the imaging data using DTI reconstruction9. The relationship between these diffusivity measurements and diffusion time was tested with linear regression as described by equation:
$$ D(\Delta) = \beta_{0} + \frac{\beta_{1}}{\Delta} $$
The functional form of depends upon the structural exponents and effective spatial dimensionality (d) as proposed by Burcaw2 and Novikov3. The mathematical form of the time-dependence of axial (d=1) and radial (d=2) diffusivity is dependent on the structural disorder along the fibers. In this study, hollow impermeable fibers with constant radius are used to test the relationship (2). This suggests that axial diffusivity should be constant (no-time dependence) whereas radial diffusivity is dependent upon the packing density and should have the functional form described in equation (2).
Methods
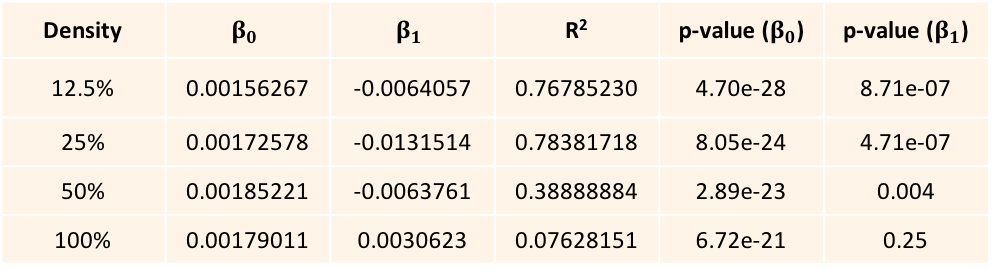
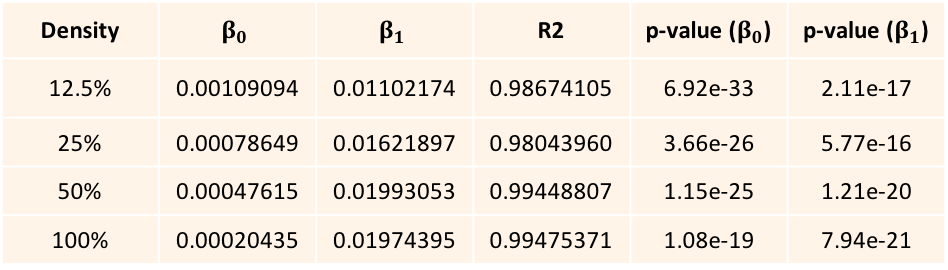
We are using a new Textile Anisotropic Brain Imaging Phantom (TABIP1), provided by an external firm (Psychology Software Tools, Inc). It has a manufactured microstructure of non-permeable textile hollow fibers called taxons with an inner/outer radius of 12/34 microns. TABIP can be configured with different test patterns; this study used a pattern of four packing densities (100%, 50%, 25% and 12.5%) with five different volume chambers (10x10, 8x8, 6x6, 4x4, 2x2 mm2 by 2.0 cm long). Taxons are arranged in a ribbon pattern that aligns parallel within the bundle. TABIP was scanned using a 3T MRI system (TIM Trio, Siemens, Erlangen, Germany) with a 20-channel coil with FOV= 224 mm x 224 mm, matrix size 224 x 224, slice thickness=2.0mm with 18 slices, b-values=3000 sec/mm2 with 64 gradient directions, TR=7000 ms. Diffusion time was manipulated for mono-polar diffusion gradient sequence by varying TE so that b-value was constant for all the measurements. Diffusion time was varied across 19 diffusion times from 50.4 ms to 140.4 ms. Diffusion data was denoised7 and corrected for Gibbs ringing8 using mrTRIX. Diffusion tensor imaging (DTI9) reconstruction was performed using mrTRIX software and Axial and Radial diffusivity maps were estimated. Manual ROIs were drawn to segment and average AD and RD over all voxels for each packing density chamber and each diffusion time. A linear regression was performed using equation (2) to estimate $\beta_{0}$ and $\beta_{1}$ for both AD and RD, and R2-squared was estimated for AD and RD regression models.Results and Discussion
The Axial and Radial diffusivity estimated for each taxon packing density chamber is plotted against the diffusion time (Fig. 1 A and B). The linear regression performed using equations (2) yielded R2 of 0.5 and 0.99 for AD and RD regression models respectively. This indicates that RD follows the inverse relationship described in equation (2). Modest coefficient of variation is estimated for AD (Figure 1) suggesting that AD is constant over diffusion time. For a given density, constant AD over delta implies that taxon radius is not changing along the fiber bundle. The regression coefficient ($\beta_{0}$) of the radial diffusivity with diffusion time (Table B) is correlated with the packing density (r = 0.72), which suggests that radial diffusivity is also dependent on extra-cellular volume fraction which was suggested in [2,3]. For Fractional Anisotropy measurement, we found 7.2% to 25% coefficient of variation w.r.t diffusion time (Figure 1C).Conclusions
The Textile Anisotropic Brain Imaging Phantom can be used to assess time-dependence diffusivity relationship for known taxon diameters. Diffusion tensor derived estimates of axial and radial diffusivity show different functional forms with respect to diffusion time. Axial diffusivity does not depend upon diffusion time. Radial diffusivity shows a statistically significant inverse relationship with diffusion time as described in equations (2).Acknowledgements
Contract support US Army W911QY-15-C-0043, VA ECNC F1880References
[1] Pathak et al 2017, Poster ISMRM 25th Meeting Hawaii. [2] Burcaw et al 2015. [3] Novikov et al 2014. [4] Stejskal EO, Tanner et al. 1965. [5] Budde and Frank et al 2010. [6] Nilsson et al 2012. [7] Veraart et al Jul 2016. [8] Veraart et al Nov 2016. [9] Basser et al 1994Figures