3234
Histological breast cancer stroma patterns correlate with diffusion MR signal1Centre for Medical Image and Computing, University College London, London, United Kingdom, 2Centre for Advanced Biomedical Imaging, University College London, London, United Kingdom, 3King's College London, London, United Kingdom
Synopsis
We report on the histological analysis of the stroma compartment of two formalin-fixed breast cancer ex-vivo samples that were scanned under a wide range of PGSE acquisitions. Our histological analysis of stroma approach shows that mature regions present higher ADC values compared to immature regions. Mature regions are mainly composed by highly organised fibres, normally following the same direction, which may facilitate directional movement of molecules. This increases the effective tortuosity in the tumour and its interstitial fluid pressure and osmotic pressure, which inhibits water diffusion and subsequently results in a lower ADC value.
Introduction
Establishing correspondence between histopathological features and radiological image signal could improve understanding of this relationship with respect to changes that occur in the tumour and its microenvironment.1 We explore the relationship between the diffusion MRI signal and histological stromal changes - here defined as stroma maturity - in invasive breast cancer. We expand on work done by 2,3, where we focus on quantitative histological analysis of two specimens, and use this to assess whether stromal maturity is reflected in ADC values.Methods
Sample description and MR acquisition
For this experiment, we selected two samples from the dataset obtained at King’s Health Partners Cancer Biobank and used in 2,3. These were ex-vivo breast tissue samples containing part of the excised tumour and surrounding stroma and were classified as grade 1 no special type (NST) (sample 1) and grade 3 NST (sample 2). Before imaging, the specimens were rehydrated with saline and scanned at 9.4-T (Varian Inc.). The MRI scan procedure is explained in detail in 2. In summary, ADC was calculated from a wide range of PGSE acquisitions (three directions at 42 gradient durations, strengths and separations). MRI T2-weighted and diffusion tensor images were also acquired.
Stroma maturity histology analysis
In 4 we presented a framework for automated classification of stromal regions using a combination of Derivative-of-Gaussian filters and local binary patterns to determine the maturity of breast stroma. Breast cancer stroma is classified as mature when composed of highly organised fine, elongated collagen fibres, normally following the same orientation with flattened nuclei of fibrocytes wrapped into multiple layers. Stroma is immature when consisting of randomly oriented fibres surrounded by high concentration of fibroblasts and exhibiting regions with oedema. For both samples the H&E slides matching the diffusion MRI slice were identified and a tile-based stroma classification framework adaptation described in 4 was applied to generate maturity maps. In addition, we used oriented BIFs (oBIFs),5 which combine local symmetry with the local orientation of an image, to compute the stroma directionality. For sample 1, we also analysed 24 consecutive H&E slides and generated maturity maps for each individual slice, to assess change across slices.
Results
To locate which H&E slides matched the diffusion image, the consecutive H&E slides were stacked into a 3D volume and registered to the T2-weighted MRI.2,3
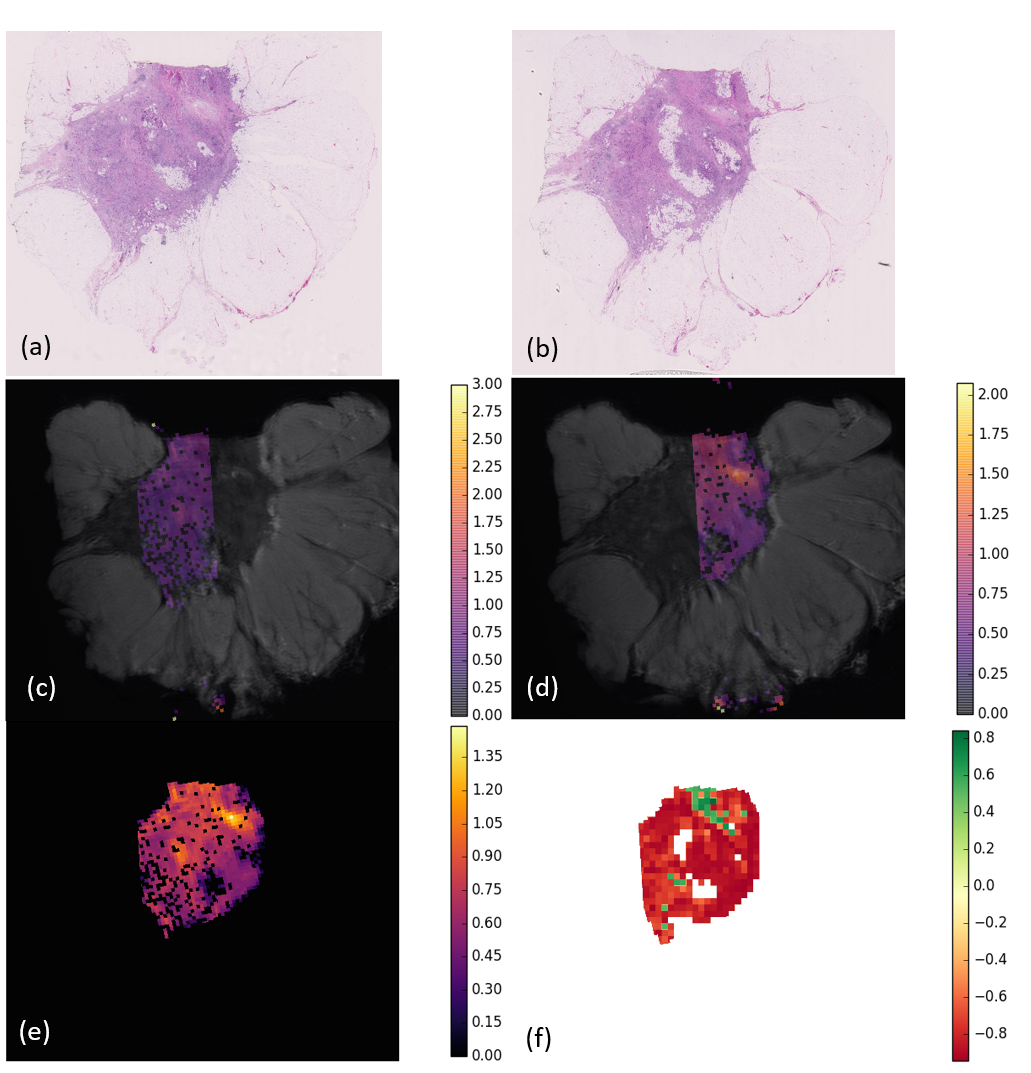
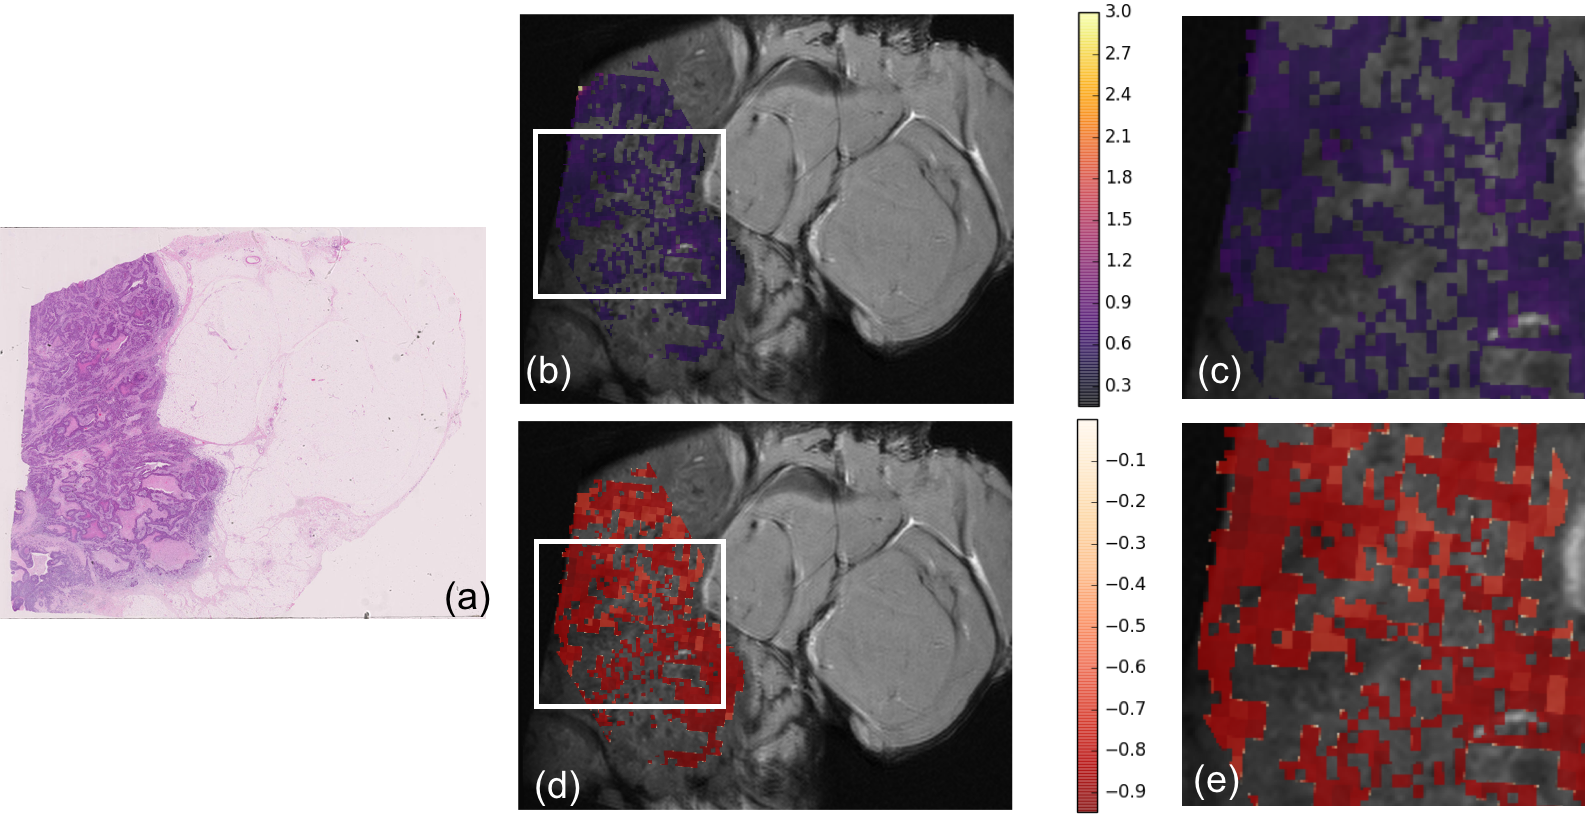
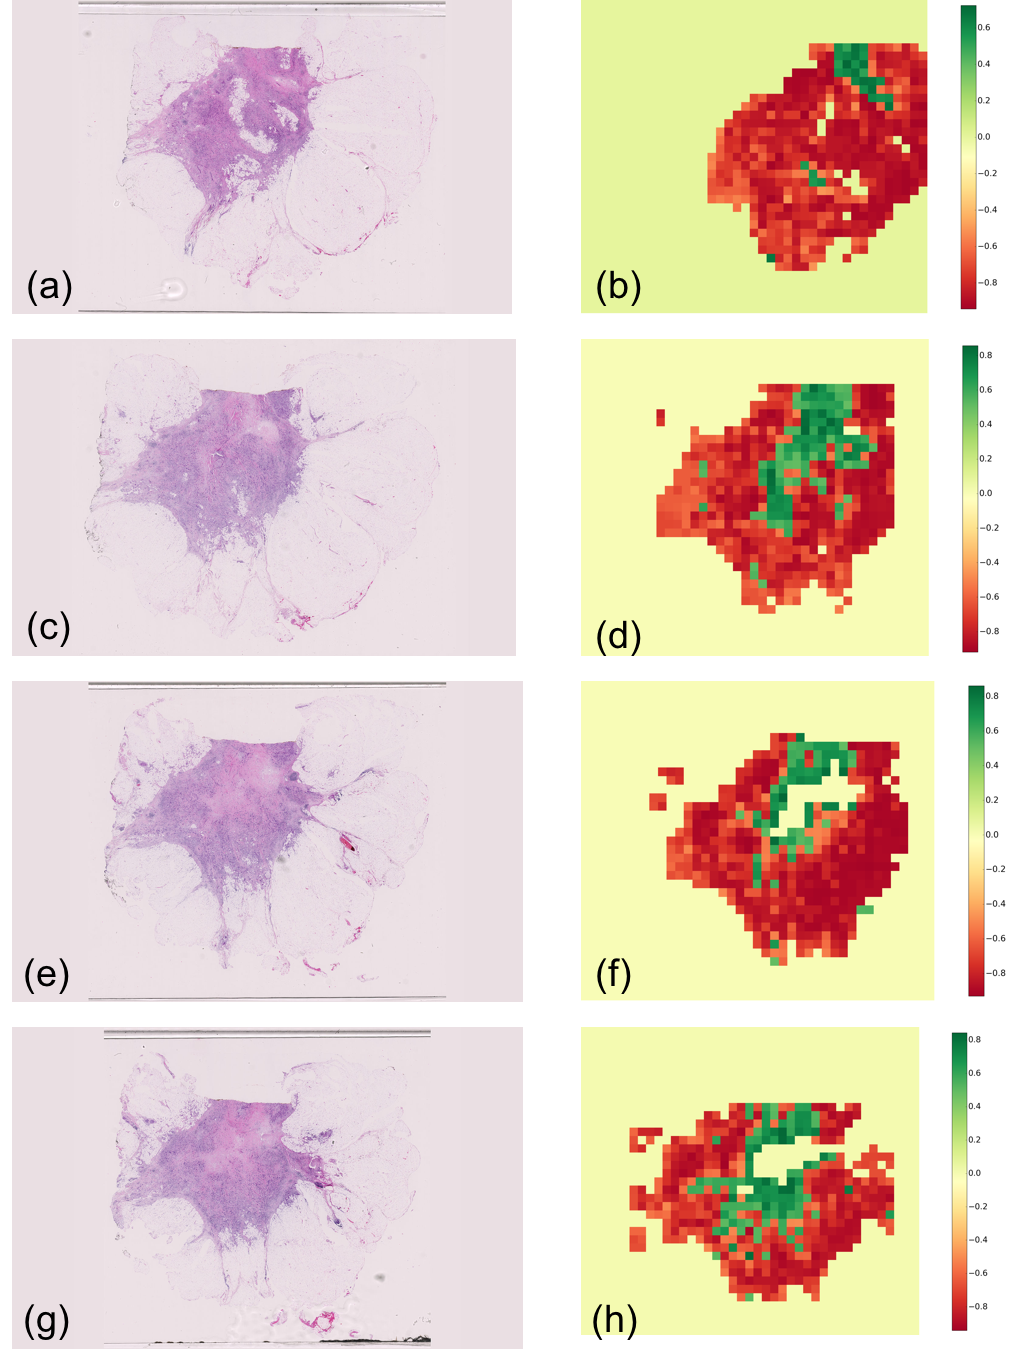
Figure 1 and 2 show the ADC and corresponding stroma maturity maps resulted from the analysis of the samples.
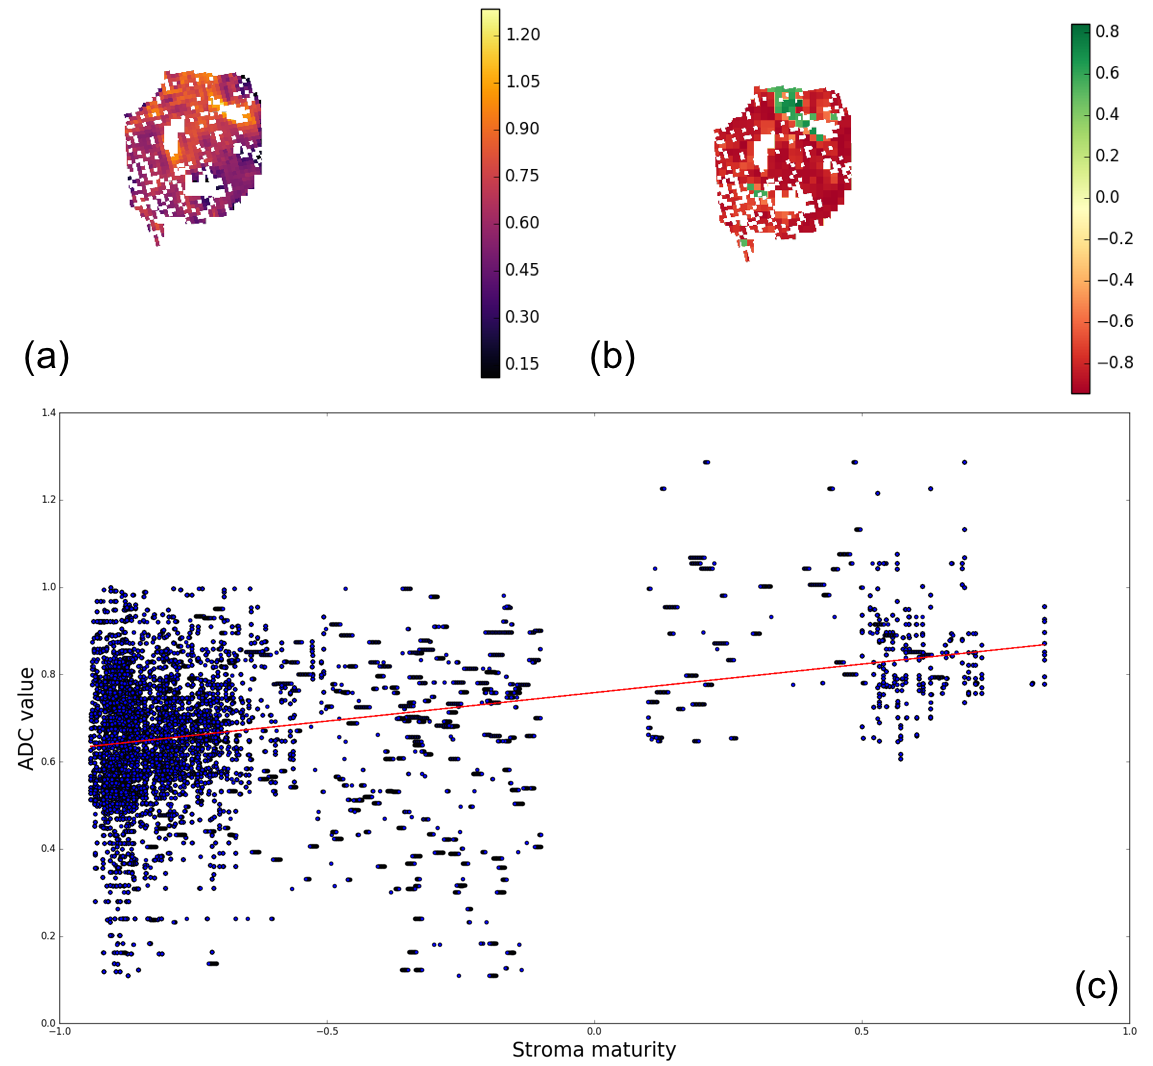
Figure 3 shows a scatter plot showing a roughly positive correlation between the ADC and stroma maturity.
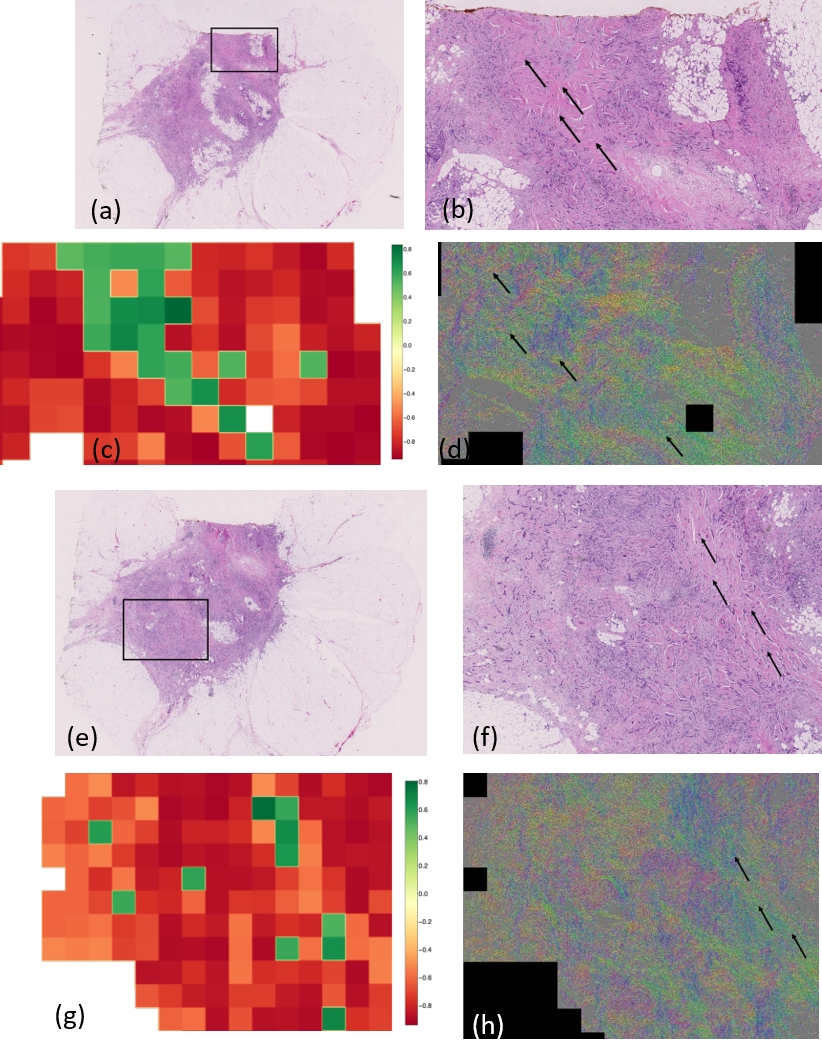
Figure 4 shows zoomed regions of higher values of ADC for sample 1, where regions classified as mature and low immature tend to follow a single direction, as opposed to random combination of directions.
Figure 5 shows results of the tile-based stroma classification in four of the 24 H&E slices analysed. These images capture different stromal patterns across the whole tumour, and show how crucial proper sampling of the tumour is necessary to preserve as much information as possible relevant for diagnosis.
Discussion
The majority of image tiles were assigned to the immature class (red). However, we identify two regions classified as mature (green). Those same regions show higher values of ADC. Moreover, zooming in (Figure 4) and looking at the corresponding stroma directionality map, mature and low immature regions seem to follow a single, more coherent direction, as opposed to random combination of directions. The scatter plot of Figure 3 seems to suggest that there is a positive, roughly linear relationship between ADC and stroma maturity.
Our findings are in good agreement with previous work,6,7 where regions of disorganised collagen resulted in lower ADC values. This has been observed in DTI studies of human articular cartilage,8 and porcine carotid artery,9 in which the directionality of water diffusion was consistent with the distribution of collagen fibre orientation. Stroma directionality maps derived from the oBIFs histology analysis were in accordance with FA maps generated by 2. One limitation of this study is that it does not consider the effects of cells on ADC. However, there is evidence that dense aligned fibres observed in mature stroma may facilitate directional movement of molecules, as opposed to a disorganised, highly cellular and heterogeneous stroma. This increases the effective tortuosity in a tumour and its interstitial fluid pressure and osmotic pressure. This in turn inhibits water diffusion and subsequently results in a lower ADC value.7
Conclusions
A pilot study on the relationship between stroma maturity and the ADC from diffusion MR of fixed samples was undertaken and results on two breast cancer tissue samples showed that mature regions correspond to higher ADC values compared to immature regions.Acknowledgements
Engineering and Physical Sciences Research Council (EPSRC) grant ‘MIMIC’ (EP/K020439/1)
EU FP7 Virtual Physiological Human grant ‘VPH‐PRISM’ (FP7‐ICT‐2011‐9, 601040)
NIHR BRC (RCF107/DH/2014)
References
1. Mertzanidou et al. 3D volume reconstruction from serial breast specimen radiographs for mapping between histology and 3D whole specimen imaging, Medical Physics, 44: 935–948 (2017)
2. Bailey et al. Microstructural models for diffusion MRI in breast cancer and surrounding stroma: an ex vivo study, NMR in Biomedicine, 30, (2017)
3. Bailey et al. Diffusion anisotropy in breast cancer tissue corresponds to spatial patterns of collagen alignment from structure tensor analysis of histology, ISMRM, 2017
4. Reis et al. Automated Classification of Breast Cancer Stroma Maturity From Histological Images, IEEE Transactions on Biomedical Engineering, 64(10) 2344-2352 (2017)
5. Newell et al. Natural Image Character Recognition Using Oriented Basic Image Features, International Conference on Digital Image Computing: Techniques and Applications, 191–196 (2011)
6. Kakkad et al. Collagen fibers mediate MRI-detected water diffusion and anisotropy in breast cancers, Neoplasia, 18, 585–593 (2016)
7. Ko et al. Apparent Diffusion Coefficient in Estrogen Receptor–Positive Invasive Ductal Breast Carcinoma: Correlations with Tumor-Stroma Ratio, Radiology 271, 30–37 (2013)
8. Deng et al. Diffusion tensor imaging of native and degenerated human articular cartilage, Magnetic Resonance Imaging 25, 168–171 (2007)
9. Ghazanfari et al. A comparative analysis of the collagen architecture in the carotid artery: Second harmonic generation versus diffusion tensor imaging, Biochemical and Biophysical Research Communications, 426, 54–58 (2012)
Figures