3233
Pre-treatment intra- and inter- voxel magnetic resonance diffusion heterogeneity correlates with chemoradiotherapy treatment outcome of patients with head and neck squamous cell carcinoma1Centre of Medical Imaging, Division of Medicine, University College of London, London, United Kingdom, 2Centre for Vision, Speech and Signal Processing, University of Surrey, London, United Kingdom, 3Department of Radiology, University College Hospital, London, United Kingdom, 4Research Department of Oncology, University College Hospital, London, United Kingdom, 5Radiotherapy Department, University College Hospital, London, United Kingdom
Synopsis
Heterogeneity assessment and diffusion weighted magnetic resonance imaging (DW-MRI) have been considered powerful diagnostic tools in predicting chemoradiotherapy treatment outcome in patients with cancer. In this study, pre-treatment microstructural heterogeneity derived by intra- and inter-voxel MR diffusion rates was assessed in patients with neck squamous cell carcinoma (HNSCC). A correlation was presented between the pre-treatment MR diffusion heterogeneity and the chemoradiotherapy treatment outcome of patients with HNSCC. Future work, to ascertain the mechanisms of these correlations would open the opportunity to tailor therapies to individuals in clinical practice.
Introduction
In oncology, diffusion weighted magnetic resonance imaging (DW-MRI) and apparent diffusion coefficient (ADC) are considered powerful diagnostic tools 1. ADC utility has been explored as imaging biomarker for prediction and treatment response assessment in head and neck squamous cell carcinoma (HNSCC) 2. However, ADC doesn’t provide a breakdown across different sources of diffusion and is a broad representation of all diffusion processes within a voxel. Heterogeneity has been suggested as an important parameter in predicting outcome of cancer patients 3. MR diffusion heterogeneity can be assessed: a) between voxels by the population distribution of ADC parameters 4 and b) within voxels by alpha (a) value derived by stretched exponential model 5 within an area of interest (ROI).Purpose
To determine whether pre-treatment microstructural heterogeneity, reflected through intra- and inter-voxel MR diffusion rates, is correlated with chemoradiotherapy treatment outcome of patients with HNSCC.Materials and methods
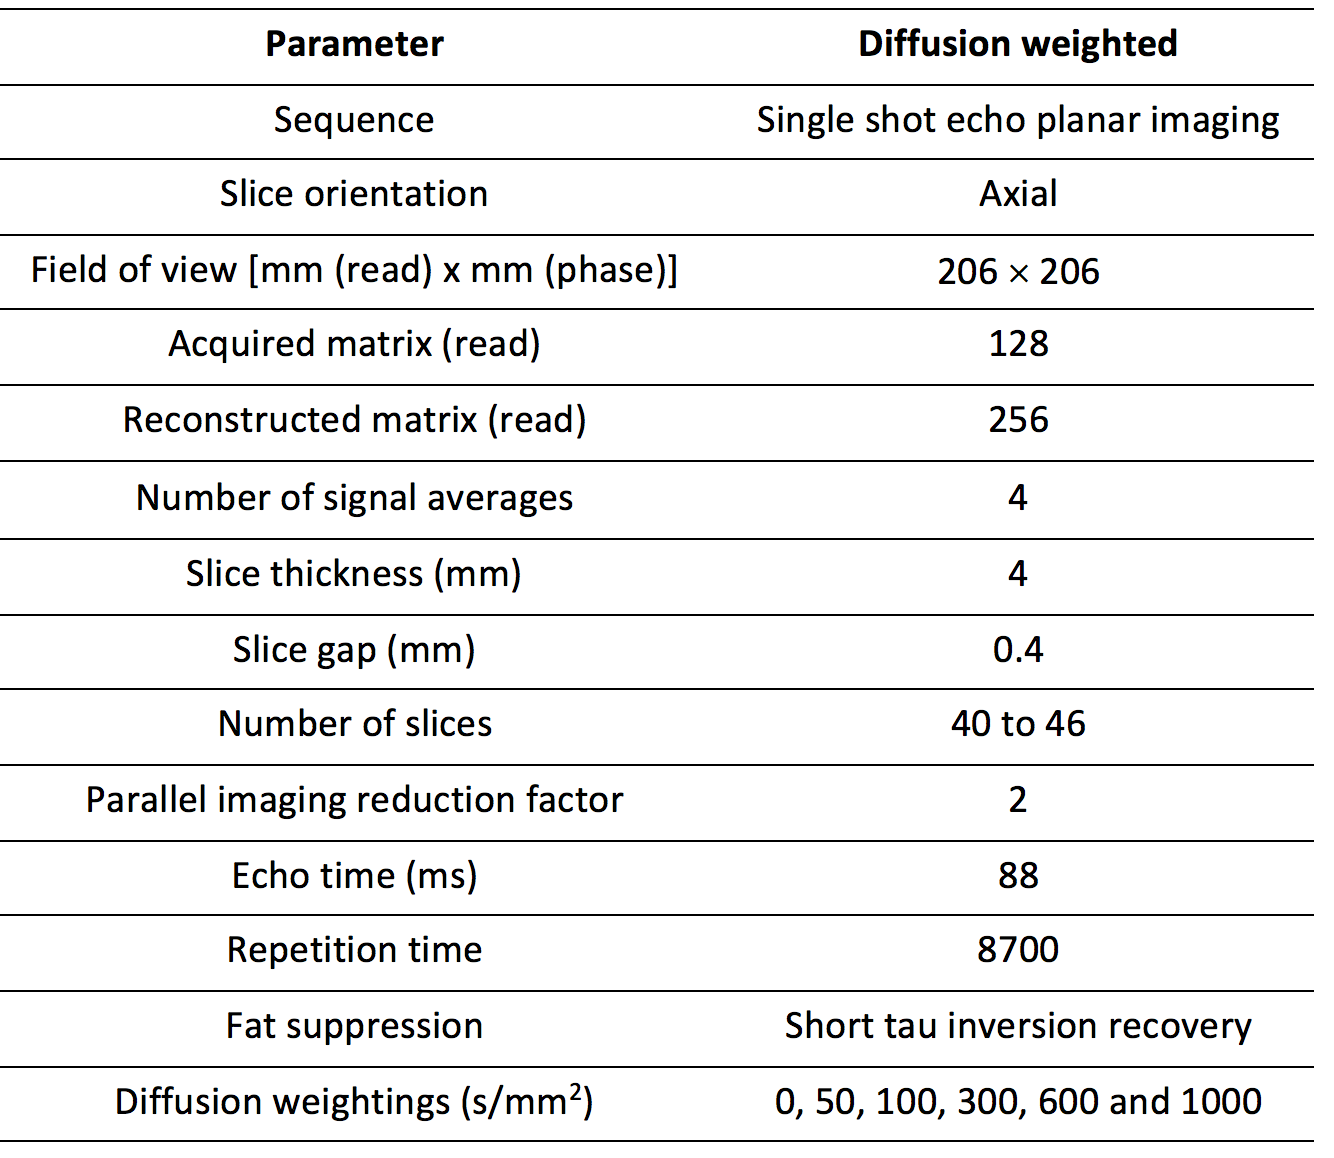
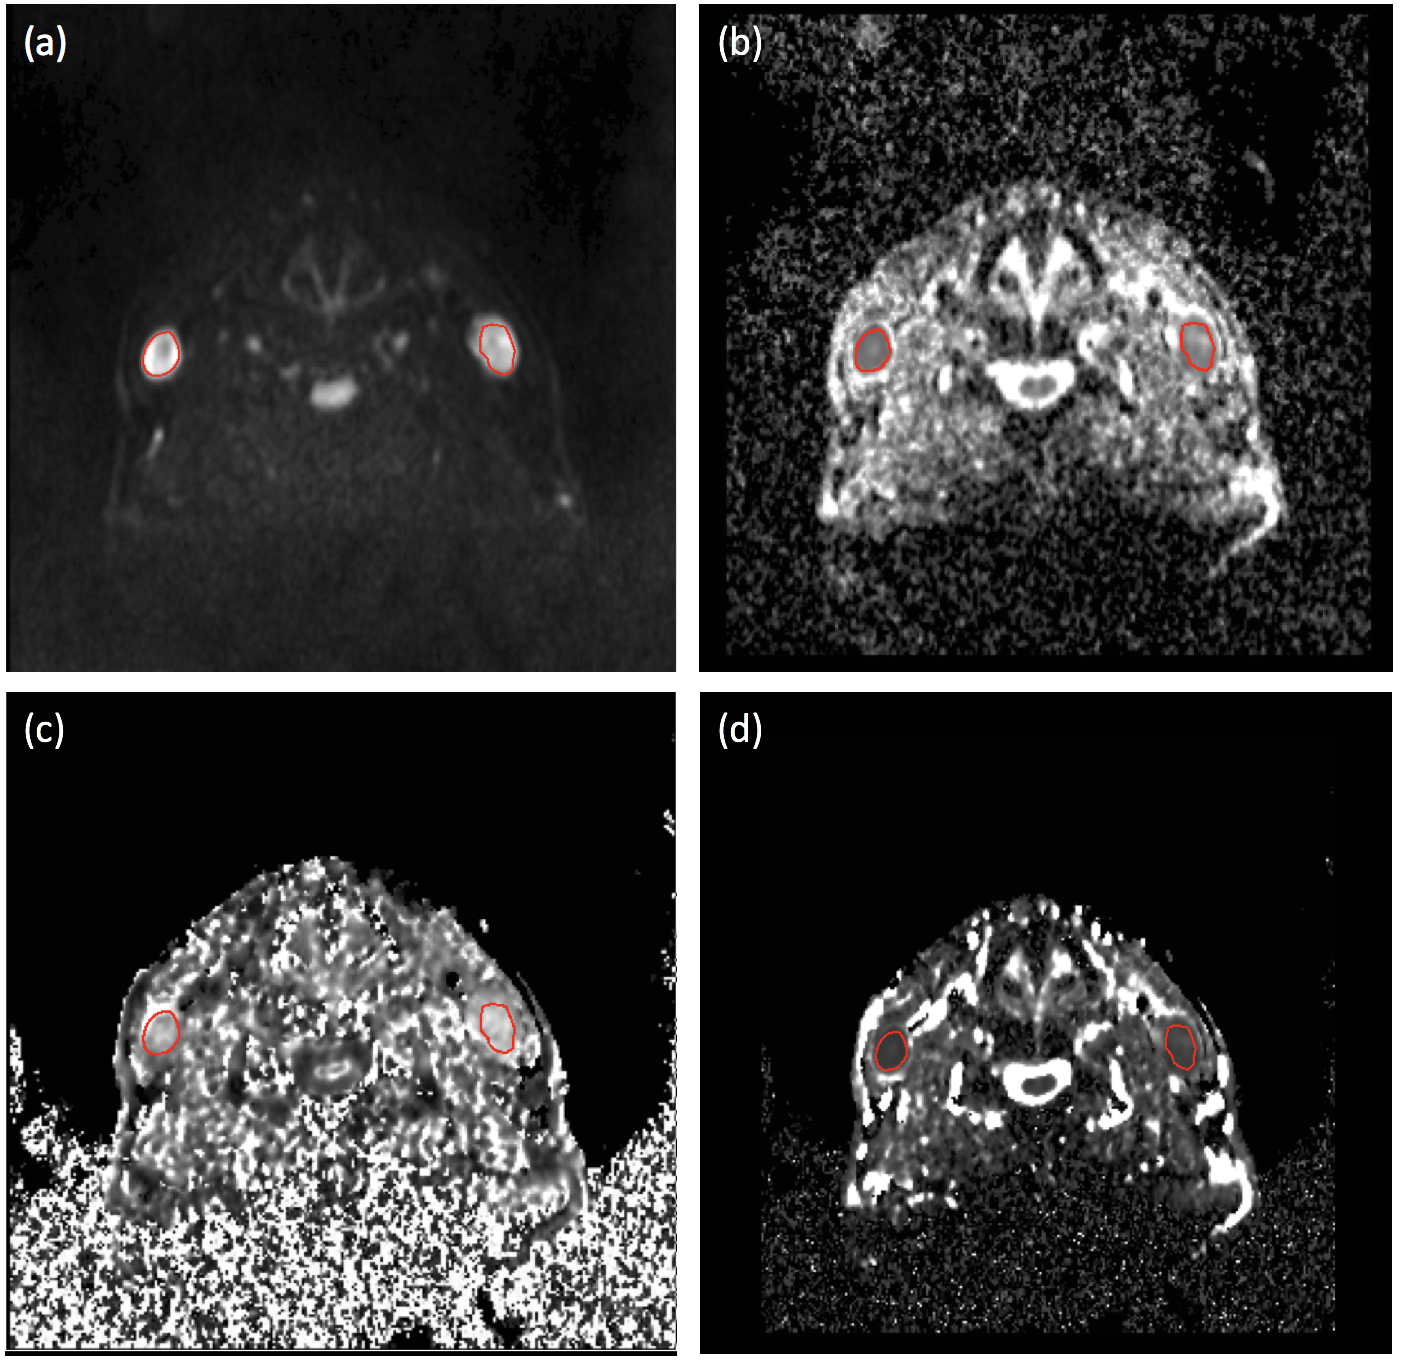
After institutional approval, 51 patients with histologically confirmed HNSCC metastatic lymph node (N2/N3) disease were recruited prior chemoradiotherapy with their informed consent. Inclusion criteria were 2-year of clinical, imaging and histopathological follow-up. Exclusion criterion was poor image quality of MRI. Based on multidisciplinary consensus review of the follow-up, patients were categorised into post-therapy local complete response (CR) and nodal recurrent disease (RD) depending on presence or absence of any local disease recurrence. To compare microstructural heterogeneity between diseased and healthy nodes, 8 healthy volunteers were recruited. Patients (pre-treatment) and volunteers were scanned on a 1.5T MR scanner (MAGNETOM Avanto, Siemens AG, Erlargen, Germany) using carotid coils in supine position. Axial DW images were acquired covering the base of skull to upper thorax (Table 1). Mono-exponential and stretched exponential models were fitted to all b-values for each pixel (MATLAB 2016; MathWorks Inc., Natick, MA). A radiologist drew ROIs on DW images (b=300s/mm2), containing the metastatic node (Figure 1a) for patients and the nodal tissue of one or more normal nodes for volunteers using Jim 5.0 software (Xinapse Systems, Thorpe, Waterville, UK). The ROIs were transferred to the calculated maps (Figure 1b-1d), ADC and distributed diffusion coefficient (DDC) histogram distributions and median alpha (a) value were estimated for patients and volunteers and were statistically compared (StataCorp 2013. Stata Statistical Software: Release 13. College Station, TX: StataCorp LP).Results
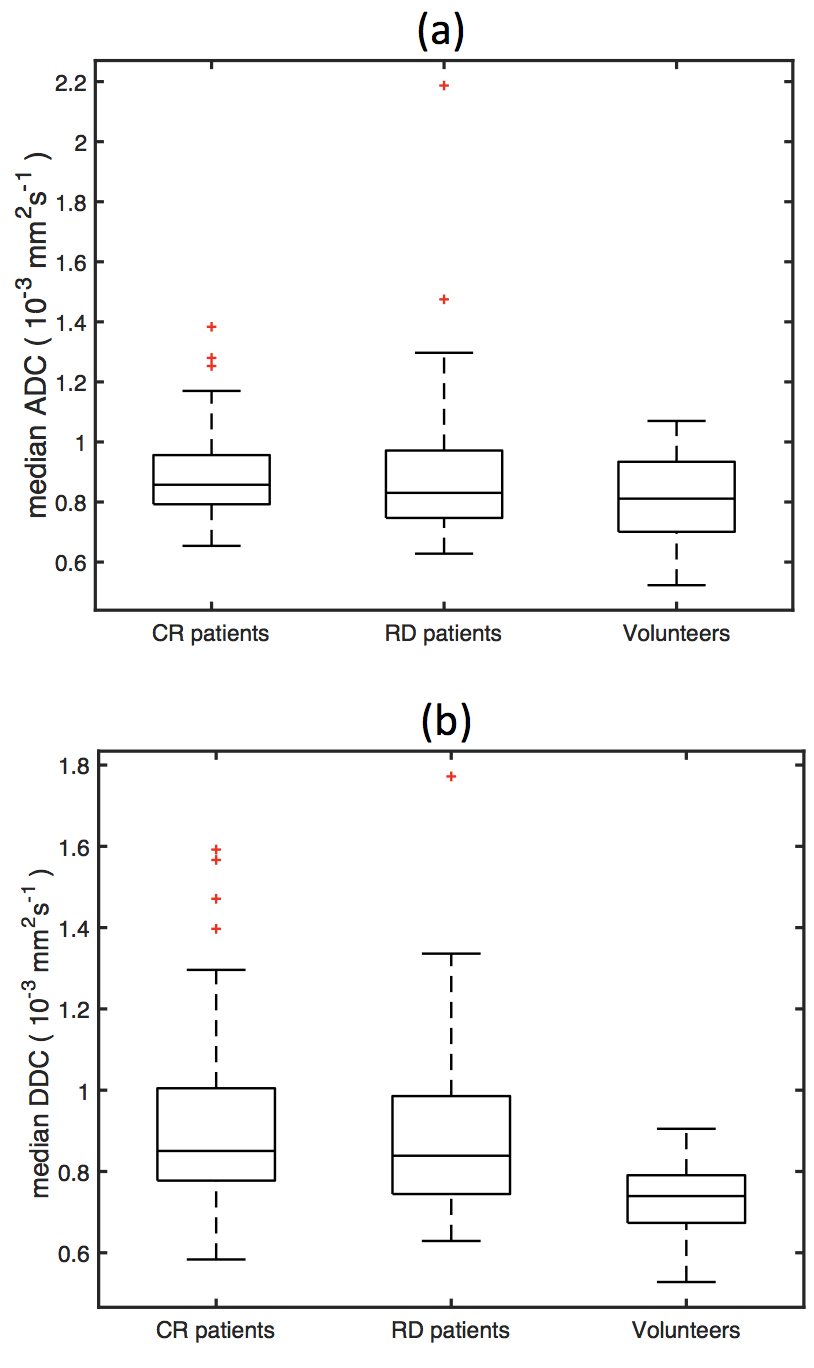
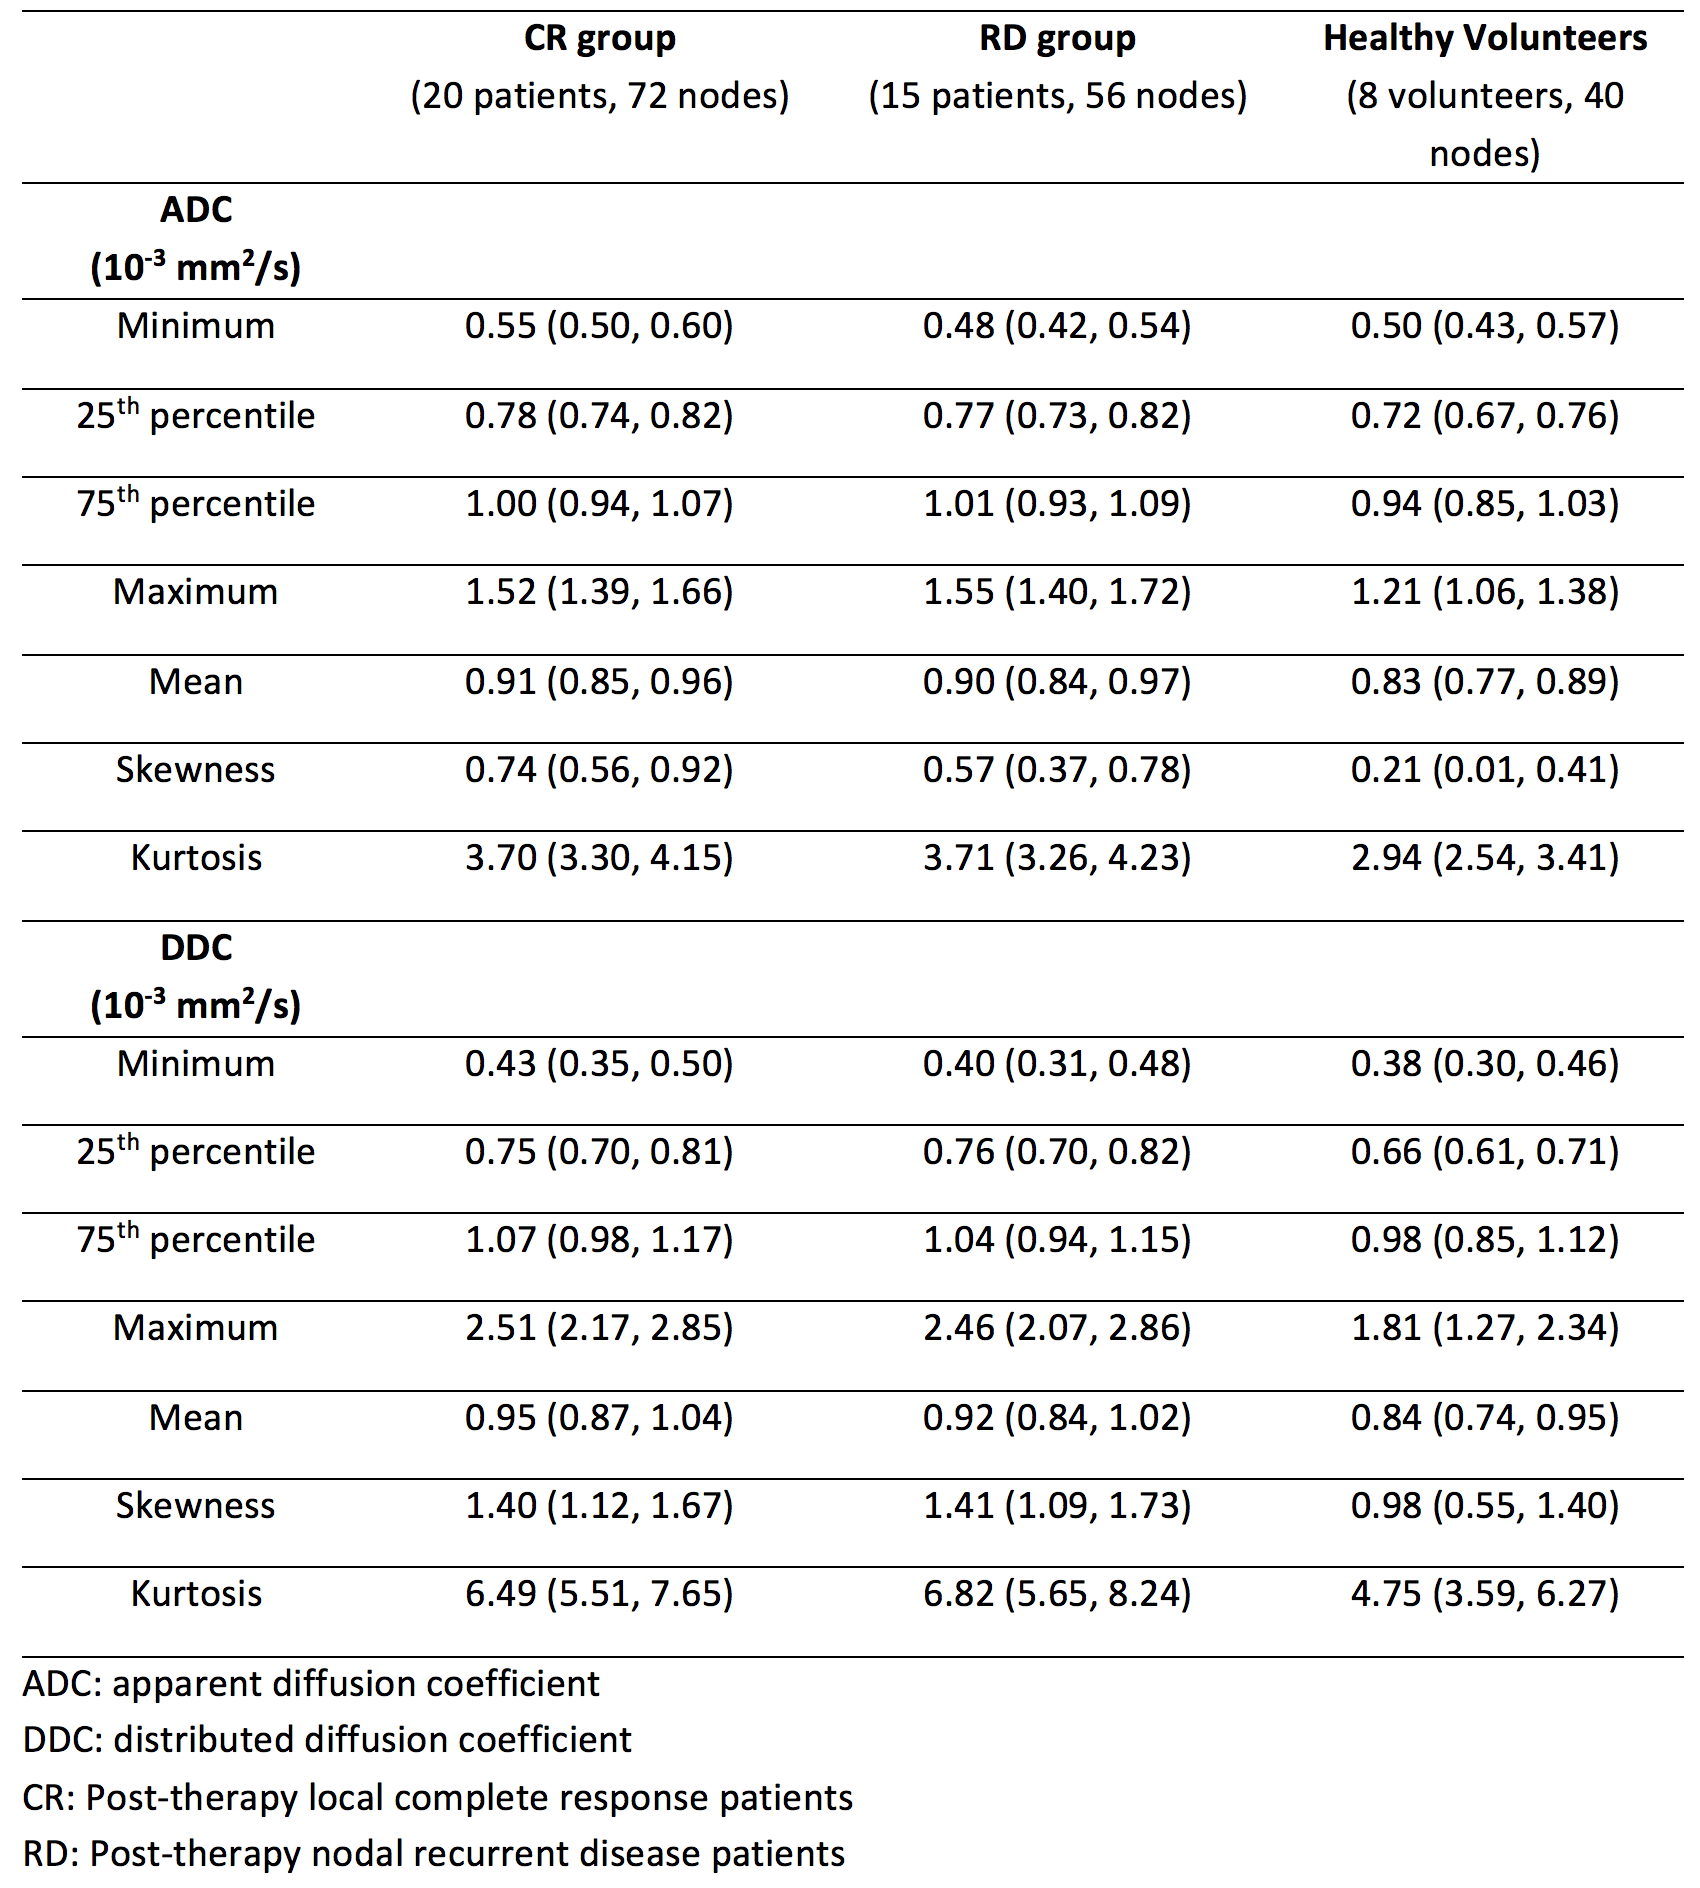
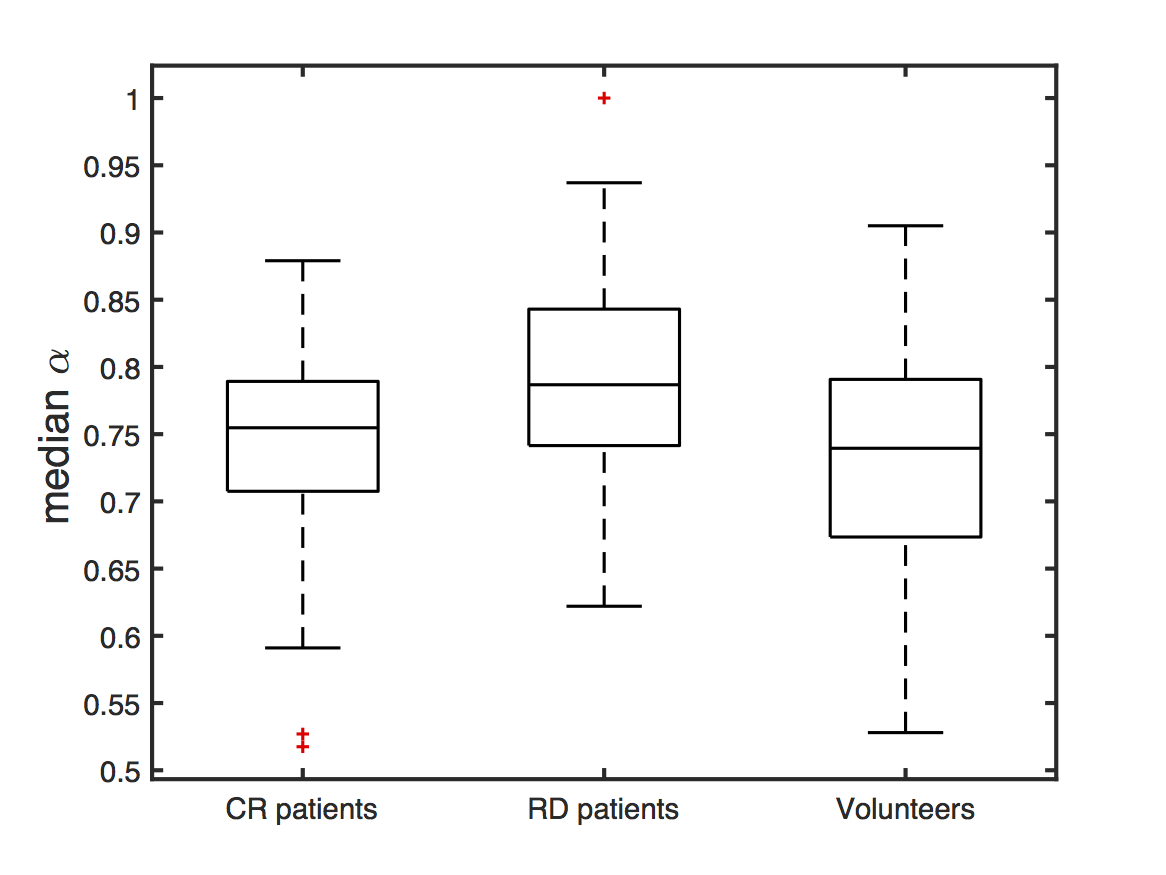
After the 2-year follow-up, 20 patients had confirmed local complete response (CR patients) and 15 patients local nodal recurrent disease (RD patients). Median ADC and DDC values didn’t present significant differences between the patient groups (p=0.91 for ADC and p=0.92 for DDC comparisons) and between each patient group and the volunteers (Figure 2). From ADC histogram analysis (Tables 2), skewness was larger in CR group than in RD group, but not statistically significant (p=0.25) and kurtosis was almost similar. The comparisons between each patient group and the volunteers revealed significant differences in skewness (p<0.0001 between CR group and volunteers, p=0.02 between RD group and volunteers) and kurtosis (p=0.01 between each patient group and volunteers). The ADC distributions were more skewed and more “peaked” in patient groups than in volunteers. The DDC distributions exhibited larger kurtosis for the RD patient group (Table 2), but not significant (p=0.70), whereas skewness was almost similar between the two patient groups (p=0.94). Significant differences were reported only in kurtosis between the RD group and the volunteers (p=0.04). A significant difference (p=0.02) was observed in median a values between the patients’ groups presenting increased a values in RD than in CR group (Figure 3).Discussion
The pre-treatment median ADC values of CR patient group were lower than in RD group and lower compared to volunteers, but not significant, in agreement with reported trend towards increased ADC values in non-responders 6. Since pre-treatment ADC distributions were significantly more skewed and more “peaked” in patient groups than in healthy volunteers, nodal disease could be identified by assessing inter-voxel diffusion heterogeneity. This difference may be ascribed to inter-voxel diffusion changes between diseased and normal nodes. The increased skewness in patient groups may be interpreted as an increase in voxels with high cellularity compared to healthy volunteers. Significantly higher pre-treatment median a values were presented in RD group than in CR and volunteers; although no significance difference was presented between volunteers and patient groups. A higher a value in RD patients supports more homogeneity in diffusion coefficients, reflecting less heterogeneity caused by intravascular perfusion and extravascular diffusion processes existing within the same voxel.Conclusion
Our quantitative analysis of pre-treatment DW-MRI suggest that assessment of intra-voxel and inter-voxel MR diffusion heterogeneities by stretched exponential and mono-exponential models can correlate with chemoradiotherapy treatment outcome of patients with HNSCC.Acknowledgements
This research was supported by grants from the KCL/UCL Comprehensive Cancer Imaging Centre and the UCLH NIHR Biomedical Research Centre.References
1) Padhani AR, Liu G, Mu-Koh D, Chenevert TL, Thoeny HC, Takahara T, et al. Diffusion-Weighted Magnetic Resonance Imaging as a Cancer Biomarker: Consensus and Recommendations. Neoplasia. 2009;11(2):102-25.
2) King AD, Mo FK, Yu KH, Yeung DK, Zhou H, Bhatia KS, et al. Squamous cell carcinoma of the head and neck: diffusion-weighted MR imaging for prediction and monitoring of treatment response. Eur Radiol. 2010;20(9):2213-2.
3) Burrell RA, McGranahan N, Bartek J, Swanton C. The causes and consequences of genetic heterogeneity in cancer evolution. Nature. 2013;501(7467):338-45.
4) Tozer DJ, Jager HR, Danchaivijitr N, Benton CE, Tofts PS, Rees JH, et al. Apparent diffusion coefficient histograms may predict low-grade glioma subtype. NMR Biomed. 2007;20(1):49-57.
5) Bennett KM, Schmainda KM, Bennett RT, Rowe DB, Lu H, Hyde JS. Characterization of continuously distributed cortical water diffusion rates with a stretched-exponential model. Magn Reson Med. 2003;50(4):727-34.
6) AD King KC, KH Yu, FK Fai Mo, DKW Yeung, J Yuan, KS Bhatia, AC Vlantis, AT Ahuja. Head and Neck Squamous Cell Carcinoma: diagnostic performance of diffusion-weighted MR Imaging for the prediction of treatment response. Radiology. 2013;266(2):531-8.
Figures