3231
Apparent exchange rate mapping: relation to membrane permeability1Department of Medical Physics in Radiology, German Cancer Research Center (DKFZ), Heidelberg, Germany, 2Institute of Radiology, University Hospital Erlangen, Friedrich-Alexander-Universität Erlangen-Nürnberg (FAU), Erlangen, Germany
Synopsis
Apparent exchange rate (AXR) mapping might provide an insight into the exchange of water between intra- and extracellular space by using a double-diffusion encoded sequence with varying mixing time between the two gradient pairs. To investigate the connection between AXR and membrane permeability and to test the assumptions of the underlying theory, Monte Carlo simulations using simplified tissue models were performed. Simulations covered a broad range of membrane permeabilities to determine limits of the applicability of this technique. For the considered simplified tissue model, AXR-values could be reliably related to membrane permeabilities typically occurring in vivo.
Introduction
The exchange of water between intra- and extracellular space is an important biological process in human physiology. It is therefore of high interest to noninvasively measure this parameter in clinics, potentially leading to new diagnostic possibilities. For this purpose, the filter-exchange imaging (FEXI) technique, which is also called apparent exchange rate (AXR) mapping, was proposed by Lasič et al. [1,2]. The aim of this work was to investigate if the assumptions underlying this approach are valid for a range of permeabilities by using Monte Carlo simulations and whether membrane permeabilities can thus be determined from AXR data.
Methods
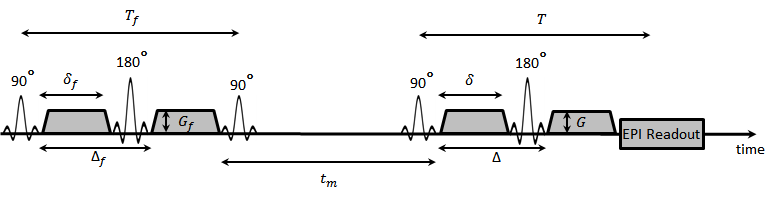
A simplified biological cell-system can be described by an exchanging two compartment model. The exchange between the compartments is characterized by the intra- and extracellular life-times $$$\tau_i$$$ and $$$\tau_e$$$. The signal equation for such a system was first calculated by Kärger in 1969 [3]. This was later expanded by Lasič [1] to FEXI. The sequence used for these experiments is basically a double-diffusion encoded sequence (see Fig.1) with varying mixing times between the two gradient pairs. Full description of the AXR-theory can be found in [1]. It was shown that the Apparent Diffusion Coefficient (ADC) for such a system can be described as:
$$ADC(t_m)=ADC_{eq}+(ADC(0)-ADC_{eq})e^{-AXR\cdot t_m}=ADC_{eq}(1-\sigma\cdot e^{-AXR\cdot t_m})\, (1),$$
with
the filter effectivity $$$\sigma=1-ADC(0)/ADC_{eq}$$$.
The theory assumes no exchange during the
diffusion weightings, as well as transfer of magnetization between the
compartments only during the mixing time. In order to investigate the appropriateness of
these assumptions, a large range of cell permeabilities was simulated. Random walks were performed using a Monte Carlo
simulation implemented in MATLAB (The MathWorks, Inc., Natick, MA)
for both CPU and GPU (CUDA) computation. Transition probabilities for the semi-permeable
membranes were calculated according to [4]. If a particle is not allowed to cross
the membrane, it is reflected elastically. For representation of an in vivo-like
system, a two-dimensional rectangular ordered cylinder-array covering a start
area of about $$$6\cdot$$$$$$10^4\mu m^2$$$ was
used. Beyond this area the two compartments were endlessly repeated. As cell-like
structures, cylinders with a diameter of $$$6\mu m$$$ were
used. The fraction of extracellular space was set to
$$$f_e=0.2762$$$, which
is a typical order of magnitude for biological tissues. See Fig.2 for a
schematic representation. Permeabilities
were evaluated between $$$\rho=0.0001\mu m/ms$$$ and $$$0.1\mu m/ms$$$. In
total $$$2\cdot$$$$$$10^6$$$ particles were simulated for each mixing time split up into 4
packets of $$$5\cdot$$$$$$10^5$$$ particles for statistical analysis. The step size was $$$dt=5\cdot$$$$$$10^{-7}s$$$. Echo-time
of the filter $$$T_f$$$ and
of the diffusion weighting $$$T$$$ was
set to $$$T_f=T=50ms$$$ ($$$T_f=0.1ms$$$ for high permeabilities) with the filter strength $$$b_f=1.5ms/\mu m^2$$$. Intra-
and extracellular diffusion constants were set to $$$D_i=1\mu m^2/ms$$$ and $$$D_e=2\mu m^2/ms$$$. Mixing
times were evaluated between $$$t_m=2ms$$$ and $$$t_m=2048ms$$$, with $$$t_{m,i}=2^i[ms]$$$ and $$$i=1...11$$$. For
high permeabilities, mixing times between $$$0.1ms$$$ and $$$50ms$$$ were
evaluated in addition. AXR values were fitted using equation (1) in MATLAB taking
the mean of the 4 particle packets.
Results
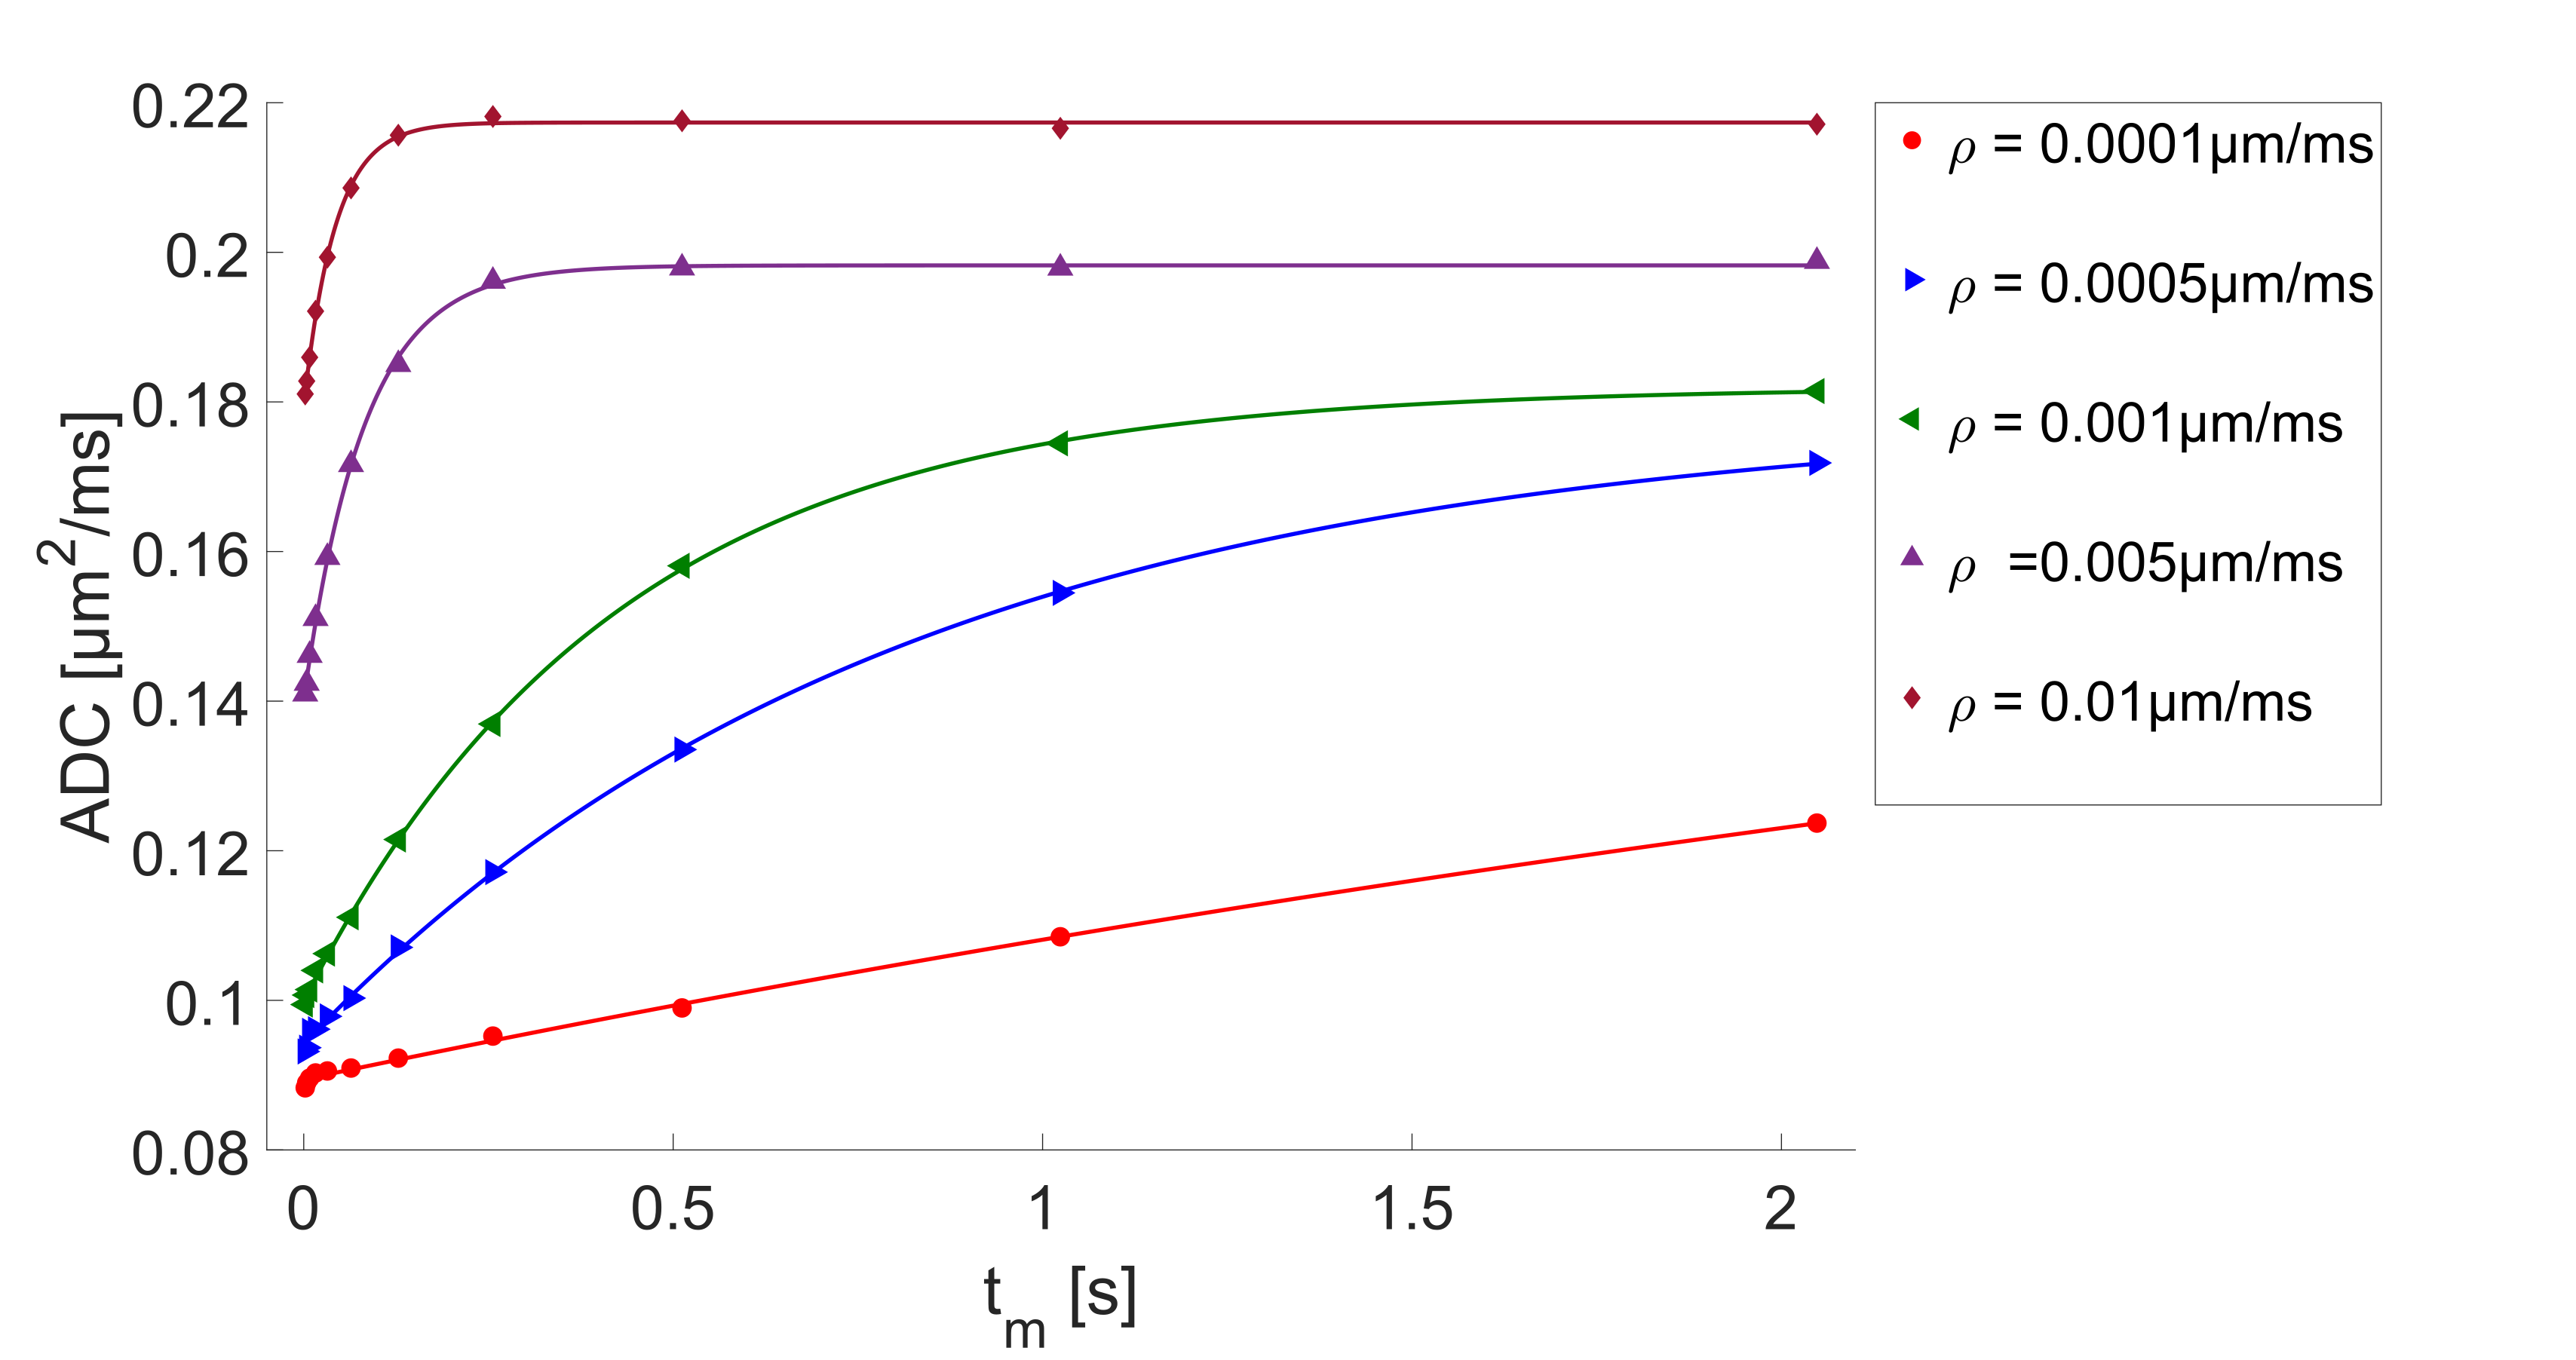
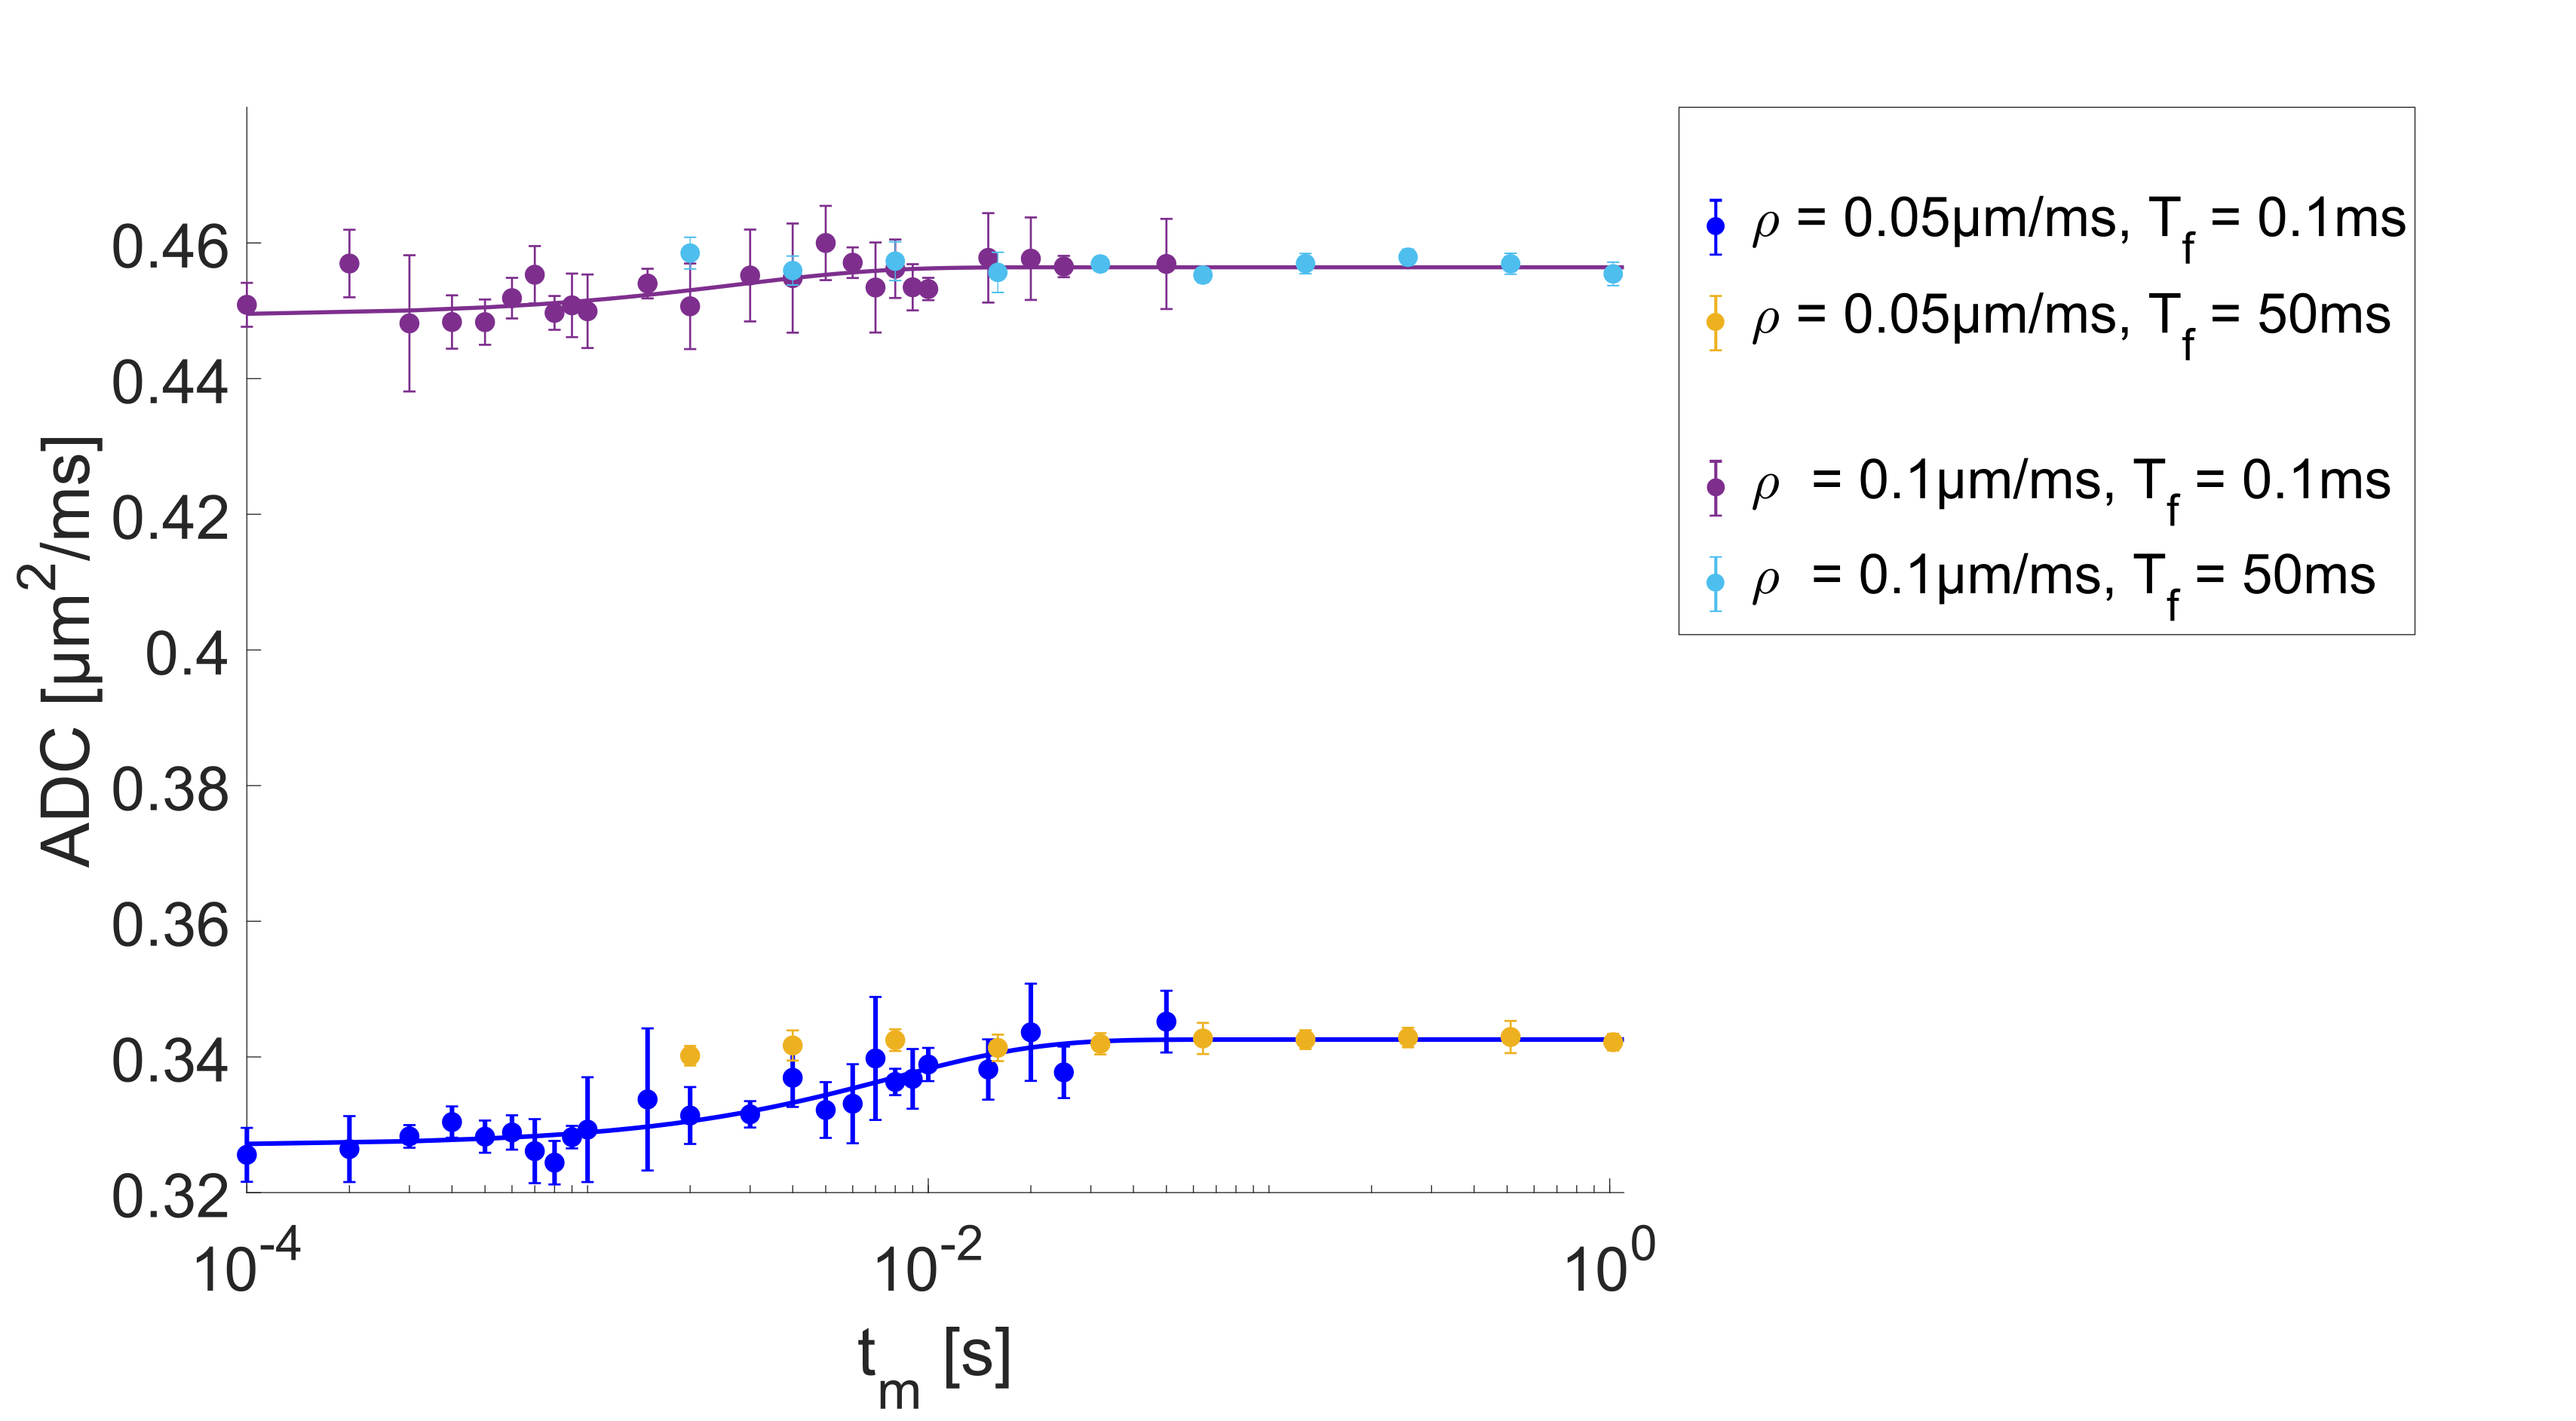
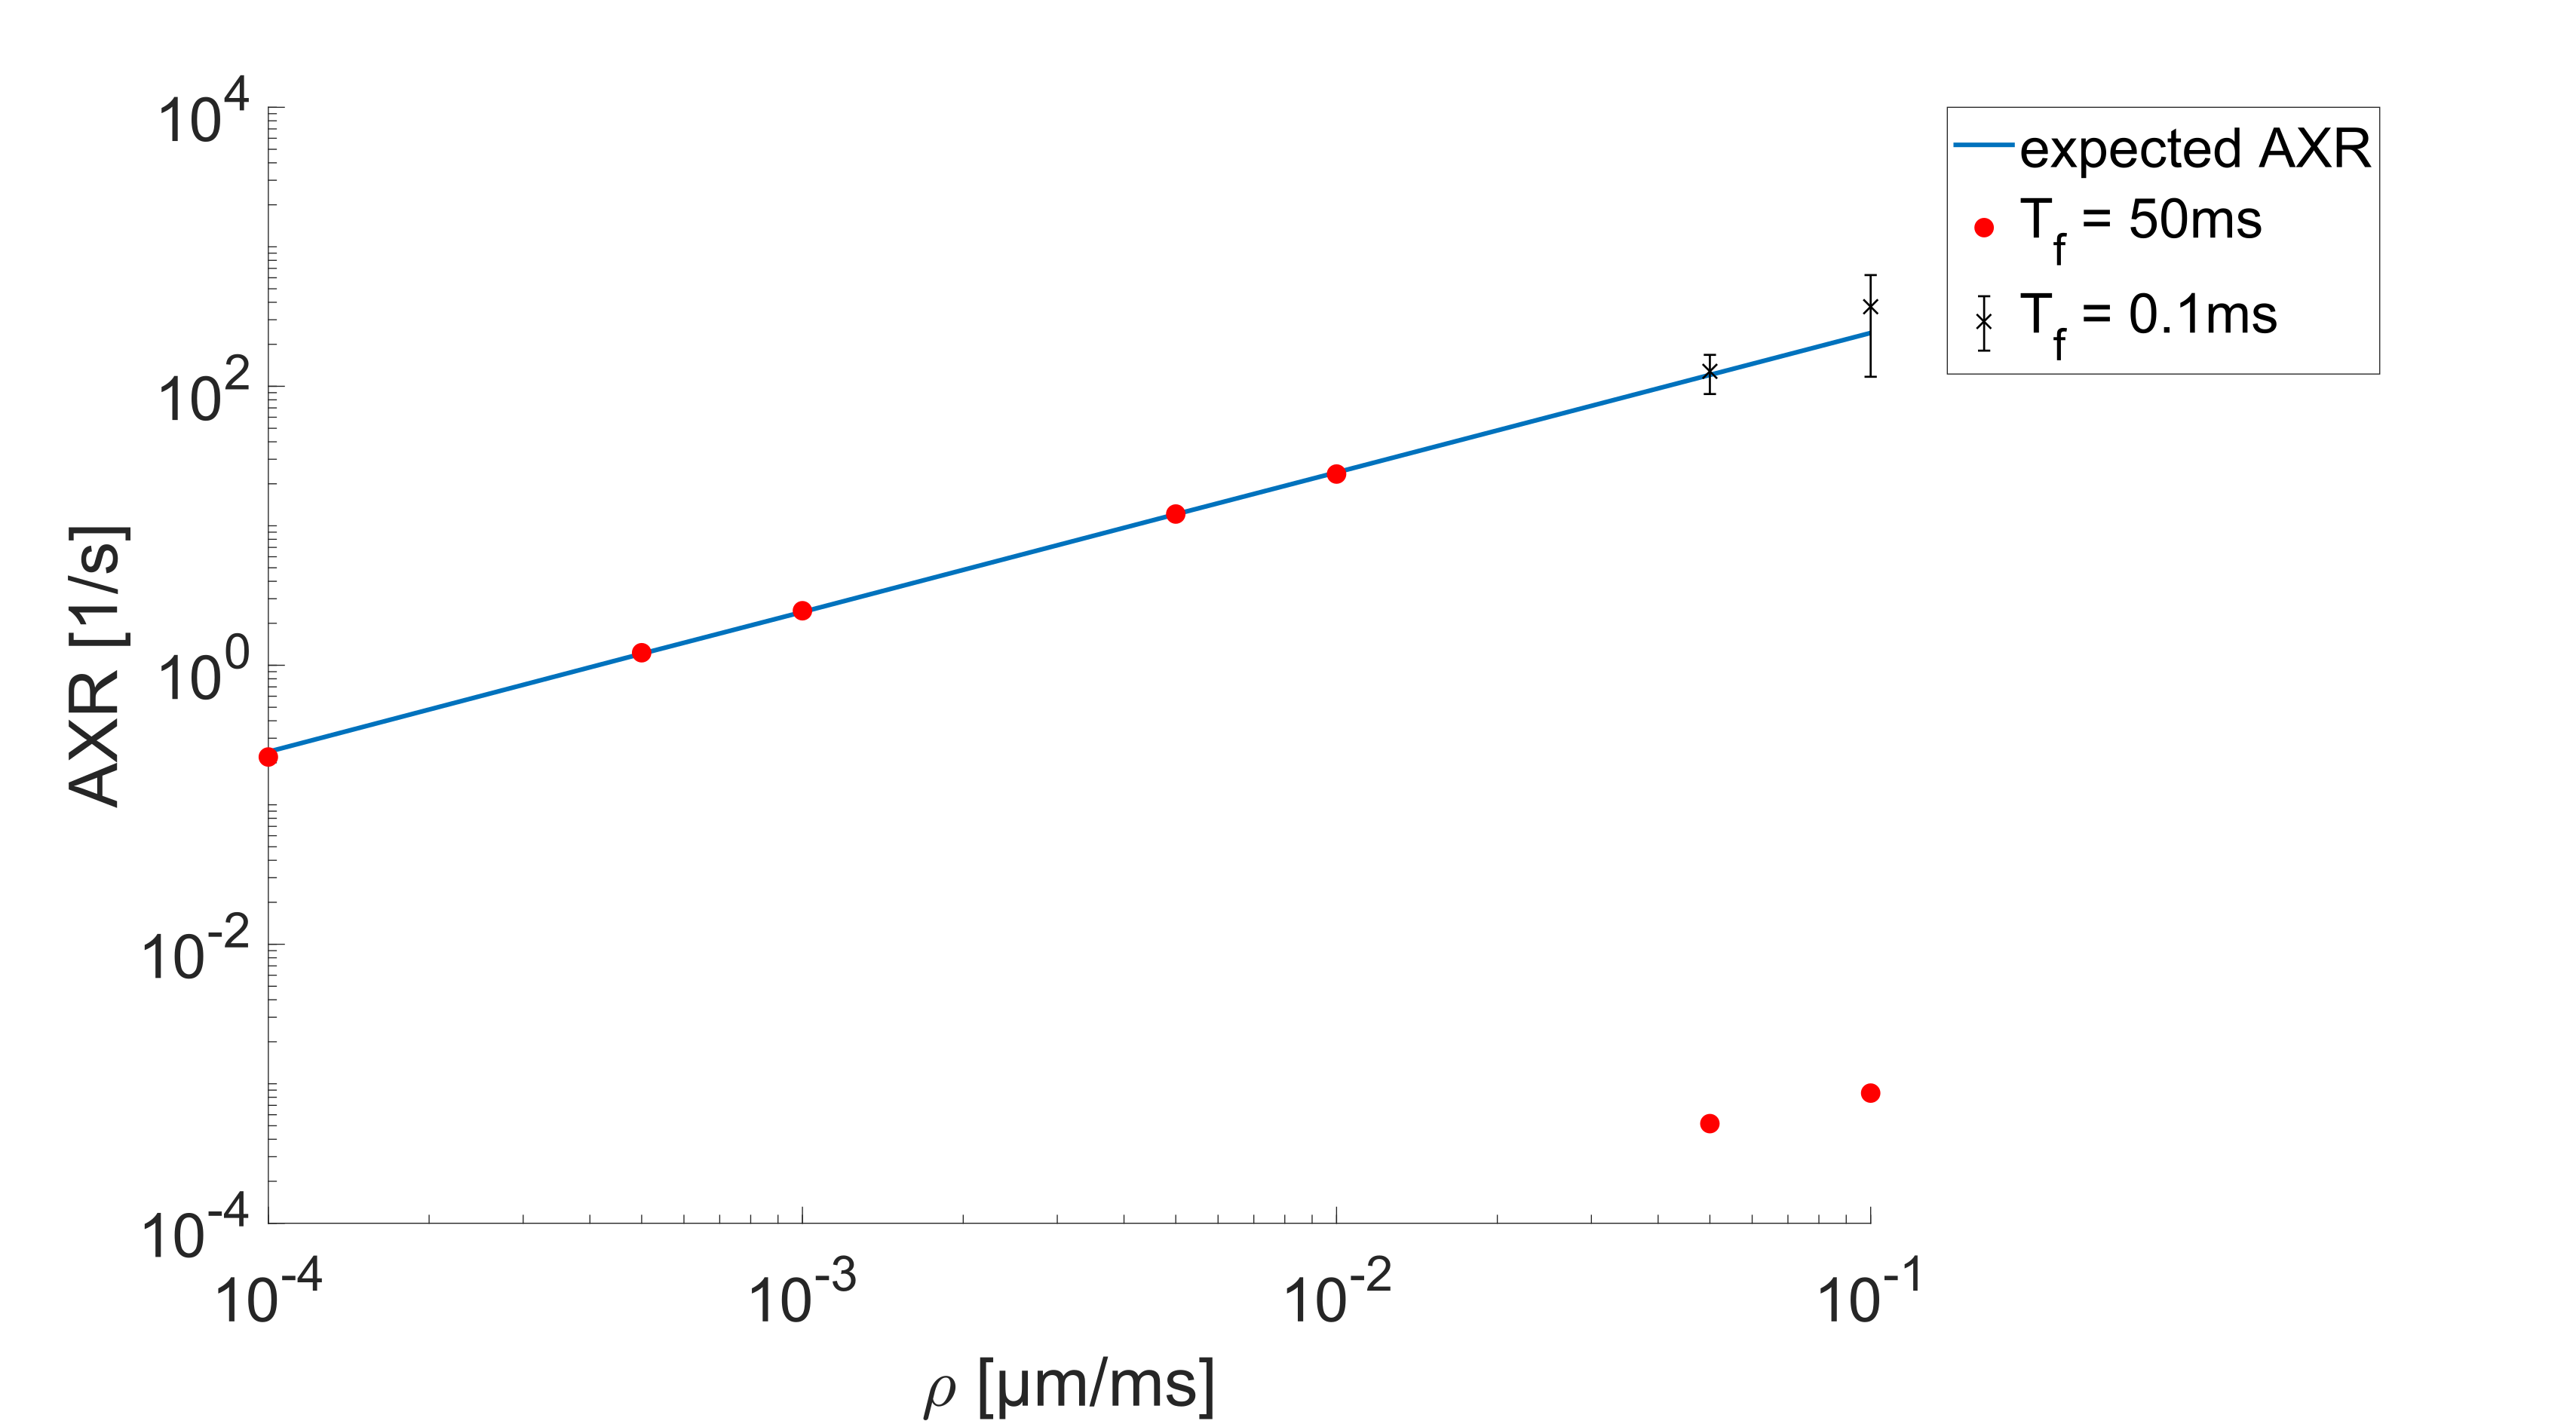
Using an Nvidia Geforce 1080 Ti the total computation time for the presented simulations was about 100h. The ADC-values as a function of the mixing time for the slowly exchanging regime ($$$\rho=0.0001$$$ to $$$0.01\mu m/ms$$$), with their corresponding AXR fits are shown in Fig.3. The simulations are well described by the AXR-model in this range. For higher permeabilities (see Fig.4) with the same filter duration, the system is already in its long-time limit (yellow and pale blue dots), where the ADC is indenpendent of $$$t_m$$$. This leads to an underestimation of the AXR-value. In this regime, the exchange during the diffusion weightings cannot be neglected anymore. When using the short filter setup, as wells as short mixing times (blue and purple dots), the AXR-value can be determined again. Used filters lead to a gradient amplitude of $$$G_f=0.045T/m$$$ for the long setup and $$$G_f=500T/m$$$ for the short setup. Fig.5 shows the fitted AXR-values as a function of the membrane permeability. The data show strong correspondence to the theoretical model, except for the two high permeabilities when using the long filter due to above named reasons.Discussion and Conclusion
The simulations show that the assumptions made in the derivation of the AXR-theory are valid, when exchange during diffusion weighting can be neglected. This restriction can to some extent be circumvented by shortening the filter times – while keeping in mind that filter lengths are of course restricted by maximum gradient amplitude in real world experiments. For the considered simplified tissue model, AXR-values can be reliably related to membrane permeabilities. For further investigations, simulations of more in vivo-like systems such as hexagonally ordered spheres should be considered, since the 2D cylinder arrangement only partially reflects in vivo conditions.Acknowledgements
Financial support by the DFG (Grant No. KU 3362/1-1) is gratefully acknowledged.References
[1] Lasič, Samo, et al. "Apparent exchange rate mapping with diffusion MRI." Magnetic resonance in medicine 66.2 (2011): 356-365.
[2] Nilsson, Markus, et al. "Noninvasive mapping of water diffusional exchange in the human brain using filter‐exchange imaging." Magnetic resonance in medicine 69.6 (2013): 1572-1580.
[3] Kärger, Jörg. "Zur Bestimmung der Diffusion in einem Zweibereichsystem mit Hilfe von gepulsten Feldgradienten." Annalen der Physik 479.1‐2 (1969): 1-4.
[4] Fieremans, Els, et al. "Monte Carlo study of a two‐compartment exchange model of diffusion." NMR in Biomedicine 23.7 (2010): 711-724.
Figures