3230
Multi-shell multi-tissue fODF tractography improves V1-V2 macaque connectivity mapping1Sherbrooke Connectivity Imaging Lab (SCIL), University of Sherbrooke, Sherbrooke, QC, Canada, 2Brainnetome Center, Institute of Automation, Chinese Academy of Sciences, Beijing, China, 3Institut des Sciences Cognitives Marc Jeannerod, CNRS/université Lyon1 (UMR 5229), Bron, France, 4Inserm, Stem Cell and Brain Research Institute U1208, Université Claude Bernard Lyon 1, Bron, France
Synopsis
We show that multi-shell (multi b-value), multi-directional, and high spatial resolution (300 microns isotropic) diffusion MRI combined with multi-tissue fiber orientation distribution function (fODF) tractography increases by 6% the number of true positive connections and uniformly increases the cortical coverage by 3%, while preserving the same percentage of false positive connections, with respect to a more standard single-tissue single-shell tractography. As a result, it is possible to find all 5 ground truth V1-V2 bundles (true positives), while reconstructing only 4 invalid bundles (false positives) corresponding to 4 pairs of spatially neighboring regions.
Purpose
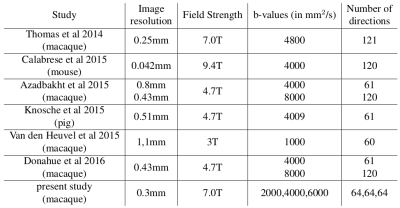
Validation of global structural connectivity is extremely challenging and the ground truth difficult to obtain. Currently, all validation studies for structural connectivity are based on the use of a single b-value dMRI, also called single-shell, for different high spatial resolutions and a range of number of gradients directions (see Table 1)1,2,3,4,5,6. The limitation of single-shell dMRI is that only the white matter tissue fODF is properly modeled through the fODF reconstruction, which leads to known gyral bias near the cortex, free water contamination in regions of partial volume with CSF, and partial voluming with deep nucleii7,8.
The purpose of this work is twofold: i) To investigate the applicability of multi-shell, multi-directional, and high spatial resolution dMRI for connectivity mapping of V1-V2 of the macaque visual field. ii) To investigate the importance of multi-shell multi-tissue (msmt) fODF reconstruction as opposed to single-tissue fODFs.
Dataset
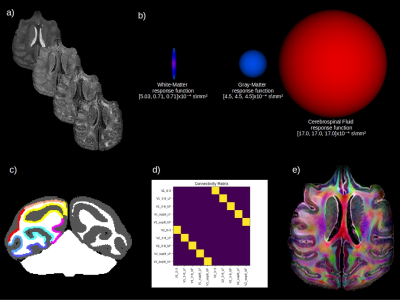
Diffusion-weighted (DW) images were acquired at 7 Tesla (Biospec 70/20, Brucker) with a three shells scheme, b=2000, 4000, 6000 mm2/s; 64 directions, one b=0 per shell (Figure 1a), isotropic 300 μm spatial resolution, 4 averages and total imaging time of 38 hours. All DW-images were bias-corrected using N4 and registered on the first b0 image. A three-tissue class segmentation was computed from the first eigenvalue map using the unified segmentation tool of SPM5/89 and the Mclaren-rhesus-macaque-atlas a priori maps10. The segmentation was manually corrected and cortical V1-V2 ground truth regions labeled by 2 experts (Figure 1c).fODF Reconstruction & Tractography
First, we computed the response functions for the single-11,12 and multi-tissue8 spherical deconvolution from the eigenvalue maps computed from the lower shell b2000 dMRI data (Figure 1b), using spherical harmonics of order 8 in Dipy13. Next, we used the anatomically constrained Particle Filtering Tractography algorithm14. It reduces some of the tractography biases in regions of partial volume and is more robust for quantitative connectivity analysis. We seeded from the GM/WM interface to obtain 1 million streamlines and kept streamlines in the [0.3, 15] mm range. Finally, the connectivity matrix of the number of streamlines (tract-count) connecting each pair of regions was reconstructed with a robust in-house streamline-grid intersection.
Evaluation
Tract-tracing is considered to be the gold standard for connectivity mapping, due to its precision and repeatability15,16. It is now understood that the V1 to V2 connectivity is retinotopic (i.e. the spatial arrangement of retina inputs is respected and can be mapped onto those areas) and point-to-point17,18, as shown in Figure 1d. There are therefore 5 valid bundles (VB) and a potential for 45 invalid bundles (IB)19. We thus computed valid connections (VC) and invalid connections (IC) as in19, and percentage of cortical coverage.Results
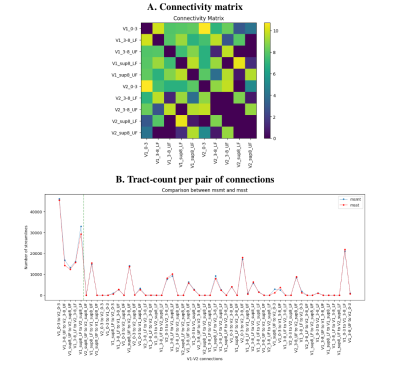
In Figures 2A,B, we see the raw and un-thresholded connectivity matrix and tract-count per pair of regions for multi-tissue fODFs. Overall, we note that msmt fODF tractography produces more valid connections (6.8% increase), while keeping a low increase in invalid connections (0.6% increase). Figure 2B shows 21 reconstructed invalid bundles (~4 times the number of valid bundles as similarly reported in 19). Single-shell single-tissue results (not shown here) are the same as the multi-shell single-tissue results.
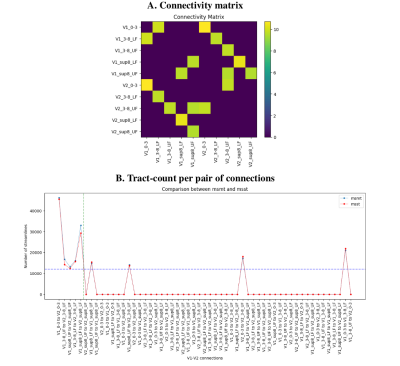
Using a threshold at 12000 streamlines (~1% of the total number of initial tractography seeds) leads to find all valid bundles and only 4 large invalid bundles, for a total of 65% of valid and 35% of invalid connections.
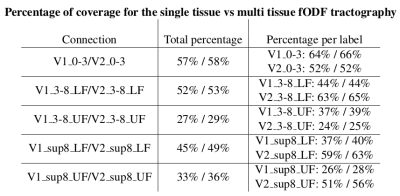
Finally, multi-shell multi-tissue fODF also shows a 3% improvement in cortical coverage (Table 2). All labels are better covered by the msmt fODF tractography algorithm. From highest to lowest, we note that the central and lower-field parts of the visual field are easier to connect than the upper-field parts.
Discussion & Conclusion
Visualizing the 4 densest invalid bundles shows that these connect side-by-side cortical ROIs, where invalid connections are positioned at the boundary of neighbouring labels. This suggests that the “ground truth” labels and tract-tracing maps may not perfectly reflect the individual macaque’s anatomy. A more precise individual-macaque based segmentation, potentially informed by tractography and other imaging modalities, could boost validation results.
In conclusion, we have shown that multi-shell multi-tissue fODF tractography improves connectivity mapping of the V1-V2 macaque connectivity. Further experiments are needed to determine a lower-bound for the number of shells and number of directions best suited for high resolution macaque dMRI tractography technologies. Validation between one invidual macaque histology measurements of labeled neurons and quantitative connectivity measures from in vivo and ex vivo tractography from the same macaque's cortical parcellation is a tremendous open challenge.
Acknowledgements
No acknowledgement found.References
[1] C. Thomas, F. Q. Ye, M. O. Irfanoglu, P. Modi, K. S. Saleem, D. A. Leopold, C. Pierpaoli, Anatomical accuracy of brain connections derived from diffusion MRI tractography is inherently limited, Proc. Natl. Acad. Sci. 111 (2014) 16574–16579.
[2] E. Calabrese, A. Badea, G. Cofer, Y. Qi, G. A. Johnson, A Diffusion MRI Tractography Connectome of the Mouse Brain and Comparison with Neuronal Tracer Data, Cereb. Cortex 25 (2015) 4628–4637.
[3] H. Azadbakht, L. M. Parkes, H. A. Haroon, M. Augath, N. K. Logothetis, A. de Crespigny, H. E. D’Arceuil, G. J. M. Parker, Validation of High-Resolution Tractography Against In Vivo Tracing in the Macaque Visual Cortex, Cereb. Cortex 25 (2015) 4299–4309.
[4] T. R. Knösche, A. Anwander, M. Liptrot, T. B. Dyrby, Validation of tractography: Comparison with manganese tracing, Hum. Brain Mapp. 36 (2015) 4116–4134.
[5] M. P. van den Heuvel, M. A. de Reus, L. Feldman Barrett, L. H. Scholtens, F. M. Coopmans, R. Schmidt, T. M. Preuss, J. K. Rilling, L. Li, Comparison of diffusion tractography and tract-tracing measures of connectivity strength in rhesus macaque connectome, Hum. Brain Mapp. 36 (2015) 3064–3075.
[6] C. J. Donahue, S. N. Sotiropoulos, S. Jbabdi, M. Hernandez-Fernandez, T. E. Behrens, T. B. Dyrby, T. Coalson, H. Kennedy, K. Knoblauch, D. C. Van Essen, M. F. Glasser, Using Diffusion Tractography to Predict Cortical Connection Strength and Distance: A Quantitative Comparison with Tracers in the Monkey, J. Neurosci. 36 (2016) 6758–6770.
[7] S. Jbabdi, H. Johansen-Berg, Tractography: Where Do We Go from Here?, Brain Connectivity 1 (2011) 169-183.
[8] B. Jeurissen, J.-D. Tournier, T. Dhollander, A. Connelly, J. Sijbers, Multi-tissue constrained spherical deconvolution for improved analysis of multi-shell diffusion MRI data, Neuroimage 103 (2014) 411–426.
[9] J. Ashburner, K. J. Friston, Unified segmentation, Neuroimage 26 (2005) 839–851.
[10] D. G. McLaren, K. J. Kosmatka, T. R. Oakes, C. D. Kroenke, S. G. Kohama, J. A. Matochik, D. K. Ingram, S. C. Johnson, A population-average MRI-based atlas collection of the rhesus macaque, Neuroimage 45 (2009) 52–59.
[11] M. Descoteaux, R. Deriche, T. R. Knösche, A. Anwander, Deterministic and probabilistic tractography based on complex fibre orientation distributions, IEEE Transactions in Medical Imaging 28 (2009) 269–286.
[12] J. D. Tournier, F. Calamante, A. Connelly, Robust determination of the fibre orientation distribution in diffusion MRI: Non-negativity constrained super-resolved spherical deconvolution, Neuroimage 35 (2007) 1459–1472.
[13] E. Garyfallidis, M. Brett, B. Amirbekian, A. Rokem, S. Van Der Walt, M. Descoteaux, I. Nimmo-Smith, Dipy, a library for the analysis of diffusion mri data, Frontiers in Neuroinformatics 8 (2014).
[14] G. Girard, K. Whittingstall, R. Deriche, M. Descoteaux, Towards quantitative connectivity analysis: Reducing tractography biases, Neuroimage 98 (2014) 266–278.
[15] J. H. Kaas, C. S. Lin, Cortical projections of area 18 in owl monkeys., Vision Res. 17 (1977) 739–41.
[16] M. Wong-Riley, Reciprocal connections between striate and prestriate cortex in squirrel monkey as demonstrated by combined peroxidase histochemistry and autoradiography., Brain Res. 147 (1978) 159–64.
[17] J. Tigges, W. B. Spatz, M. Tigges, Reciprocal point-to-point connections between parastriate and striate cortex in the squirrel monkey (Saimiri), J. Comp. Neurol. 148 (1973) 481–489.
[18] J. Tigges, W. B. Spatz, M. Tigges, Efferent cortico-cortical fiber connections of area 18 in the squirrel monkey (Saimiri), J. Comp. Neurol. 158 (1974) 219–235.
[19] K. H. Maier-Hein, P. Neher, J. Christophe, M.-A. Cote, E. Garyfallidis, J. Zhong, M. Chamberland, F.-C. Yeh, Y. C. Lin, Q. Ji, W. E. Reddick, J. O. Glass, D. Q. Chen, Y. Feng, C. Gao, Y. Wu, J. Ma, H. Renjie, Q. Li, C.-F. Westin, S. Deslauriers-Gauthier, J. O. O. Gonzalez, M. Paquette, S. St-Jean, G. Girard, F. Rheault, J. Sidhu, C. M. W. Tax, F. Guo, H. Y. Mesri, S. David, M. Froeling, A. M. Heemskerk, A. Leemans, A. Bore, B. Pinsard, C. Bedetti, M. Desrosiers, S. Brambati, J. Doyon, A. Sarica, R. Vasta, A. Cerasa, A. Quattrone, J. Yeatman, A. R. Khan, W. Hodges, S. Alexander, D. Romascano, M. Barakovic, A. Auria, O. Esteban, A. Lemkaddem, J.-P. Thiran, H. E. Cetingul, B. L. Odry, B. Mailhe, M. Nadar, F. Pizzagalli, G. Prasad, J. Villalon-Reina, J. Galvis, P. Thompson, F. Requejo, P. Laguna, L. Lacerda, R. Barrett, F. Dell’Acqua, M. Catani, L. Petit, E. Caruyer, A. Daducci, T. Dyrby, T. Holland-Letz, C. Hilgetag, B. Stieltjes, M. Descoteaux, The challenge of mapping the human connectome based on diffusion tractography, Nature communications in press (2017).
[20] T. Dhollander, R. E. Smith, J.-D. Tournier, B. Jeurissen, A. Connelly, Time to move on: an FOD-based DEC map to replace DTI’s trademark DEC FA, Proc. Intl. Soc. Mag. Reson. Med (2015) 1027.
Figures
