3228
Does neurite density as measured by diffusion-weighted MR imaging relate to neuronal density as measured by MR spectroscopy?1The University of Manchester, Manchester, United Kingdom, 2Bioxydyn Limited, Manchester, United Kingdom
Synopsis
Capturing the earliest signs of dementia with MR imaging relies on techniques that are sensitive to the subtle loss or disconnection of neurons before atrophy occurs. Models of multi-shell HARDI such as NODDI claim to quantify neurite density in vivo and non-invasively, but the specificity of these HARDI-based metrics remain unvalidated. This study aims to determine the sensitivity of NODDI’s neurite density and orientation dispersion index to regional variation of MRS markers of neuronal and glial cell density. We find that caution must be exercised when interpreting NODDI’s neurite density as related to neuronal density. Orientation dispersion instead appears to be a closer marker of neuronal density and may be a more sensitive marker of disease-related change.
Introduction
Capturing the earliest signs of dementia with MR imaging relies on techniques that are sensitive to the subtle loss or disconnection of neurons before atrophy occurs. Models of multi-shell high angular resolution diffusion MR imaging (HARDI) such as NODDI1 claim to quantify neurite density in vivo and non-invasively, where neurites are defined as dendrites in grey matter and axons in white matter. However, the specificity of these HARDI-based metrics to specific cell types and sensitivity to differences in their density is unclear. Meanwhile, MRS provides concentrations of N-acetylaspartate ([NAA]), which is known to be located within neuronal cell bodies in grey matter and in oligodendrocytes/myelin in white matter2,3, and myo-inositol ([MI]), which is claimed to be a glial-specific marker4, thereby offering independent measurements of neuronal and glial density. This study aims to determine the sensitivity of key HARDI metrics to regional variation of MRS markers of neuronal and glial cell density. Our hypotheses: (1) There would be a significant relationship between NODDI’s neurite density and [NAA]. (2) NODDI’s neurite density (i.e. intracellular volume fraction) would not be related to [MI] since glial cells belong to the extracellular tissue compartment1.Methods
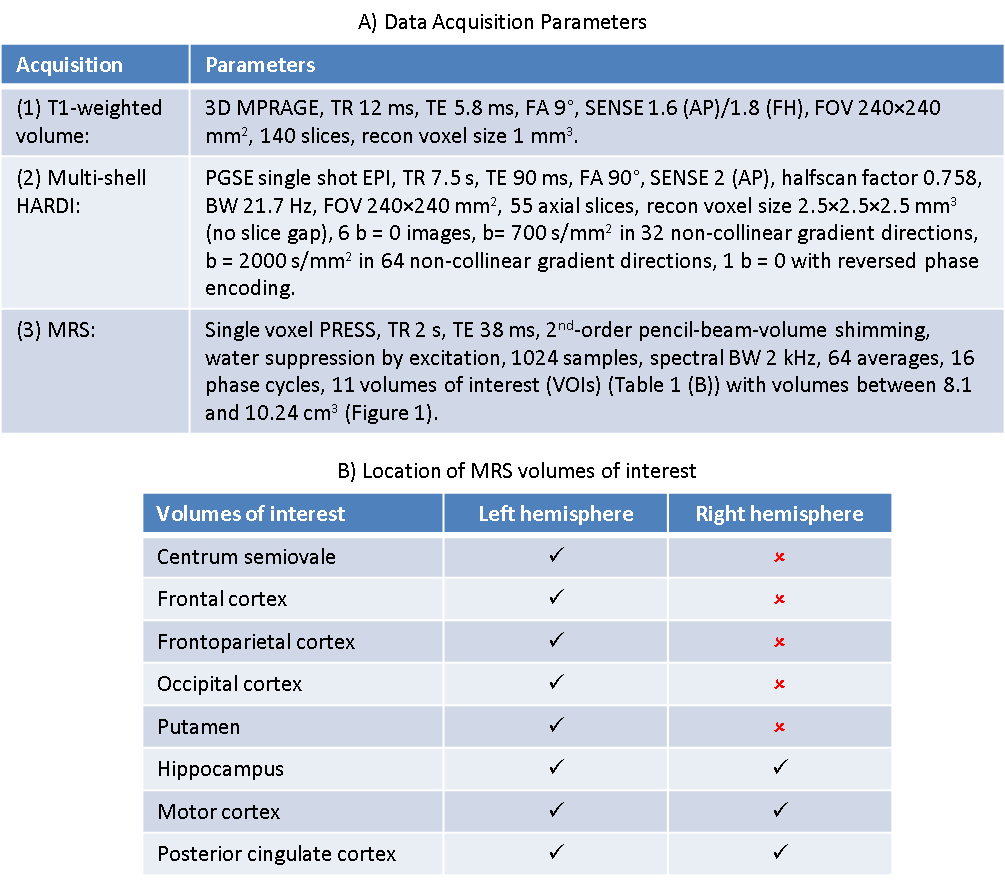
Data Acquisition: 6 healthy volunteers (3 F, age: range 20-50 years, median 27 years) underwent MR imaging on a 3.0 T Philips Achieva (Philips Medical Systems, Best, The Netherlands). We acquired: (1) High-resolution T1-weighted volume, (2) Multi-shell HARDI, and (3) MRS. Acquisition parameters are given in Table 1(A).
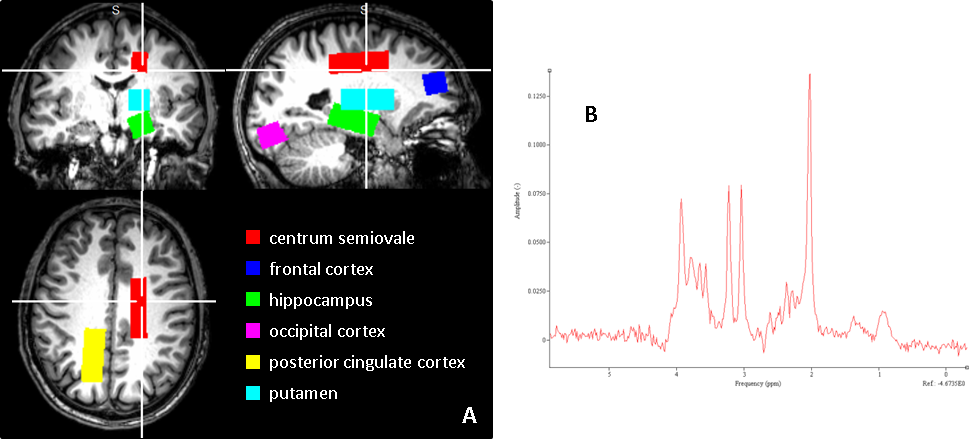
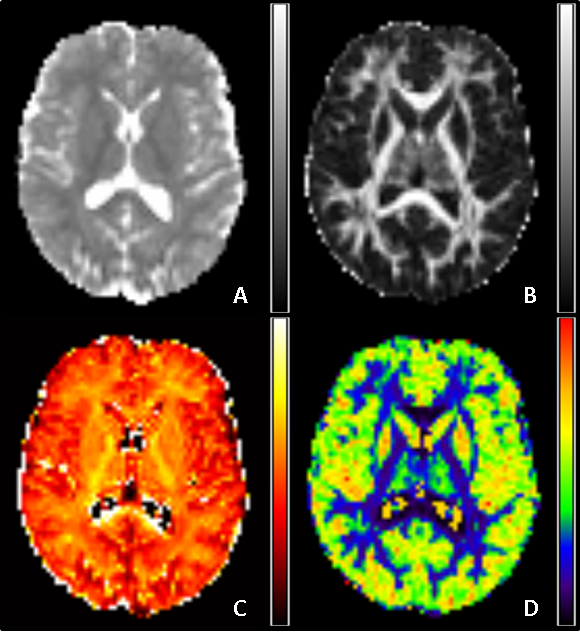
Analyses: (1) Matlab (The MathWorks, Natick, MA, USA) scripts were used to overlay spectroscopy VOIs on SPM8 (http://www.fil.ion.ucl.ac.uk/spm/) probabilistic segmentations of the T1-weighted volumes in order to obtain percentages of CSF (CSFp), grey matter (GMp) and white matter (WMp) in each VOI. Tissue grey matter fraction (GMf) was calculated as GMf=GMp/(GMp + WMp). (2) HARDI data were pre-processed with FSL’s (https://fsl.fmrib.ox.ac.uk/fsl/fslwiki) Topup and Eddy to correct distortions, and then analysed using FSL’s DTI-FIT to obtain maps of mean diffusivity (MD) and fractional anisotropy (FA) and also using the NODDI Matlab toolbox to obtain maps of neurite intracellular volume fraction (ICVF) and orientation dispersion index (ODI) (Figure 2). (3) The SPM8 segmentations and VOIs were registered to diffusion space using FSL’s FLIRT, and mean VOI values computed for MD, FA, ICVF (< 1) and ODI. (4) PRESS spectra were quantified in jMRUI v6.0 (http://www.jmrui.eu) using a simulated basis set of 8 metabolites including NAA and MI in QUEST. Metabolite concentrations were computed relative to water and corrected for CSFp.
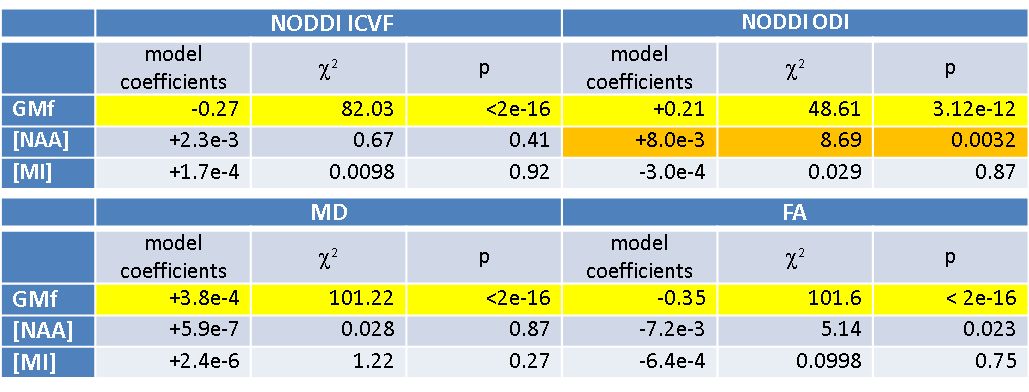
Statistics: Linear mixed-effects models were fit as follows in R (version 3.4.2, R Foundation for Statistical Computing, Austria) using the nlme package5. To account for repeated measurements across VOIs, subject ID was included as a random effect (random intercept) with GMf, [NAA] and [MI] included as fixed effects. Separate models were fit for ICVF, ODI, MD and FA as the response variable. Inference was conducted using asymptotic χ2 tests on the resultant fixed effect coefficients using the “car” package6. Significance was assessed as p<0.01 to correct for multiple comparison tests.
Results
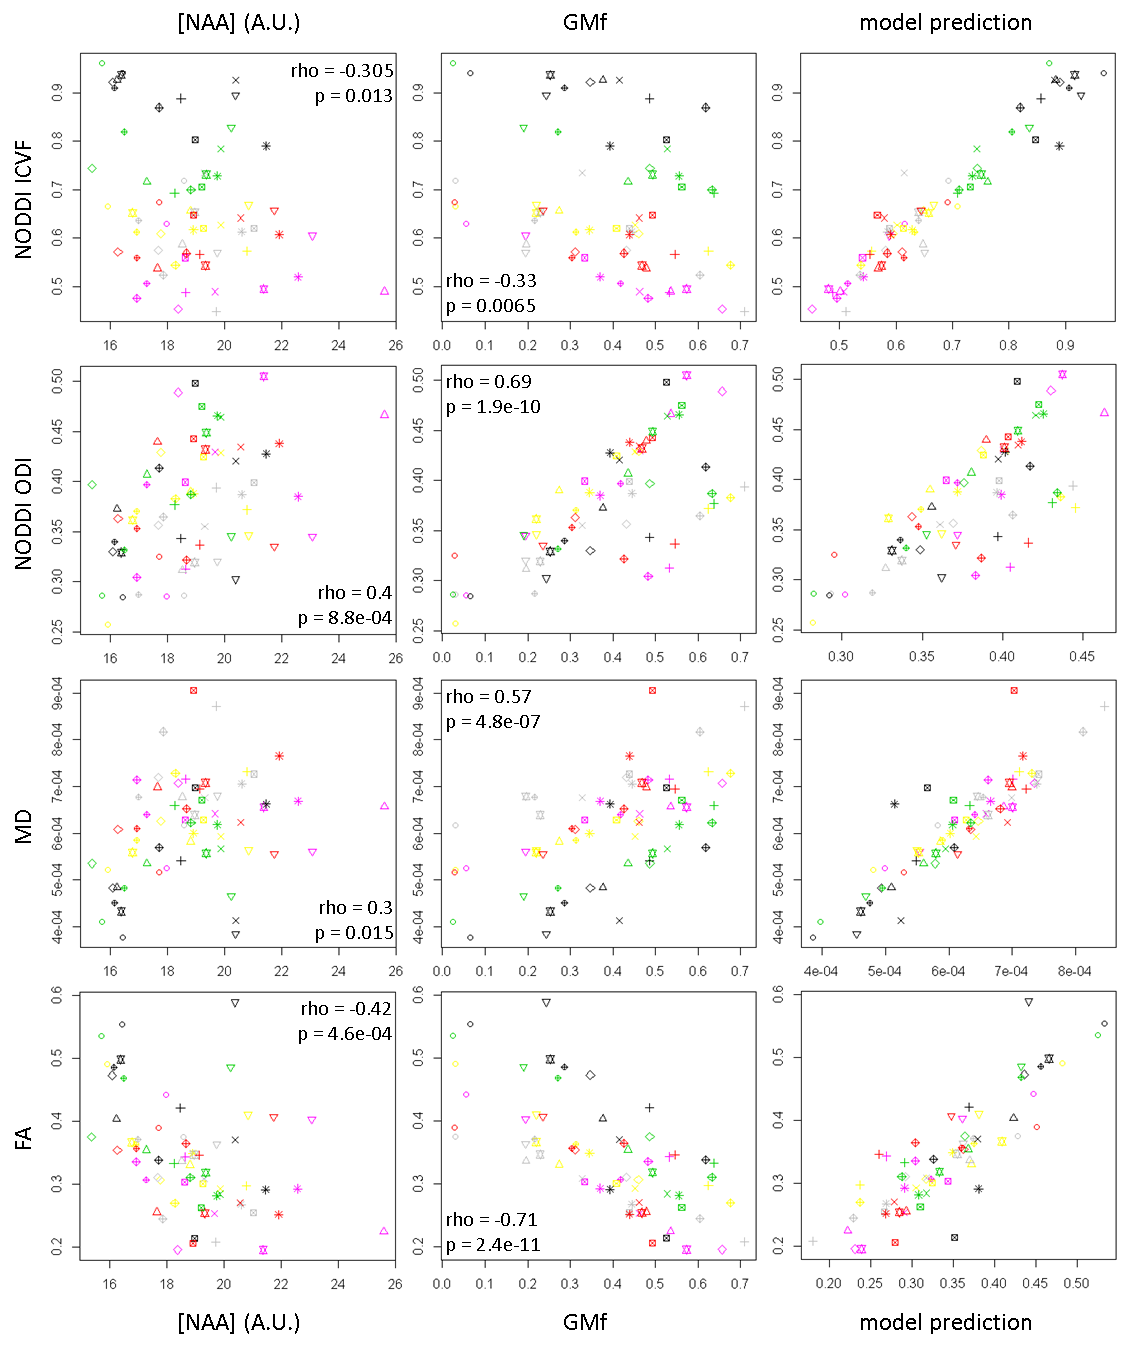
Results are presented in Table 2 and Figure 3.Discussion
The first striking finding is the very strong influence of GMf on all HARDI metrics. It is clear that any partial volume of grey matter with white matter or CSF will greatly influence HARDI metrics and care must be taken in interpretation, for example, in the case of altered cortical thickness in dementia. Contrary to our hypothesis, ICVF (neurite density) is not significantly related to [NAA], whereas ODI shows a positive correlation. This suggests that ODI is more sensitive to regional differences in neuronal density than the other metrics, with more neurons causing greater dispersion of the diffusion-weighted signal. Regional differences are likely to be driven by differences in the grey matter rather than the white matter as variability across the brain is greater (Figure 1), suggesting that differences in dendritic density rather than axonal density are driving the relationship. It appears therefore that altered dendritic density has a much larger impact on ODI than ICVF. MI has no influence on any of the HARDI metrics, supporting our hypothesis that glial cell density does not influence diffusion metrics in the healthy brain. One limitation of our study is the assumption that [NAA] is a marker of neuronal density, whereas it is also known to be a marker of neuronal integrity7,8.Conclusion
Caution must be exercised when interpreting NODDI’s ICVF as related to neural density. ODI instead appears to be a closer marker of neuronal density and may be a more sensitive marker of disease-related change.Acknowledgements
This work was supported by the EPSRC (SIDD grant EP/M005909/1), The University of Manchester Imaging Facilities, NIHR Manchester Clinical Research Facility and The University of Manchester Computational Shared Facility.References
1) Zhang H, et al. NODDI: practical in vivo neurite orientation dispersion and density imaging of the human brain. Neuroimage 2012; 61(4):1000-1016.
2) Urenjak J, et al. Specific expression of N-acetylaspartate in neurons, oligodendrocyte-type-2 astrocytes and immature oligodendrocytes in vitro. J Neurochem 1992; 59:55-61.
3) Nordengen K, et al. Localisation of N-acetylaspartate in oligodendrocytes/myelin. Brain Struct Funct 2015; 220(2):899-917.
4) Brand A, et al. Multinuclear NMR studies on the energy metabolism of glial and neuronal cells. Dev Neurosci 1993; 15:289-298.
5) Pinheiro JC and Bates DM. Mixed-effects models in S and S-Plus. Springer 2009.
6) Fox J and Weisberg S. An R companion to applied regression. 2nd edition. SAGE 2011.
7) Guimaraes AR, et al. Quantitative in vivo 1H nuclear magnetic resonance spectroscopic imaging of neuronal loss in rat brain. Neuroscience 1995; 69:1095-1101.
8) Tsai G and Coyle JT. N-acetylaspartate in neuropsychiatric disorders. Prog Neurobiol 1995; 46:531-540.
Figures