3227
MR Characterization and Temperature Dependence of Aqueous Polyvinylpyrolidone (PVP) Solutions for use as MR Phantoms1NINDS/NMRF, National Institutes of Health, Bethesda, MD, United States, 2NICHD, National Institutes of Health, Bethesda, MD, United States, 3Biomedical Engineering, Tel Aviv University, Tel Aviv, Israel, 4NIBIB, National Institutes of Health, Bethesda, MD, United States
Synopsis
Diffusion-weighted MRI methods often contain variability and bias in diffusion parameters that are measured between sites, scanners, and vendors. There is a clear need for a calibrated diffusion phantom to help identify and mitigate these differences. Here we utilize a 7T spectrometer to characterize MR parameters of T1, T2, and the water self-diffusion coefficient in aqueous Polyvinylpyrolidone (PVP) solutions and their dependence on temperature and PVP concentration, without imaging confounds. An empirical formula is presented for use wtih PVP aqueous solutions as a calibrated diffusion phantom. Data show that aqueous PVP solutions are well suited as a MR phantom material.
Introduction
Diffusion-weighted MRI (DWI) methods have widespread use both in clinical and research imaging. However, there is often variability and bias in the quantitative diffusion parameters that are measured between sites, scanners, and vendors. The sources of these differences may be hardware and software related, including both acquisition and reconstruction methods. There is a clear need for a calibrated diffusion phantom to help identify and mitigate these differences, as well as monitor quality control. Aqueous Polyvinylpyrolidone (PVP) solutions have been shown to be ideal for diffusion phantoms as they are non-toxic, stable, inexpensive, high viscosity, and mean diffusion coefficients in the range of biological tissues1,2. In this work, we characterize MR parameters of T1, T2, and the water self-diffusion coefficient (D) in aqueous PVP solutions and their dependence on temperature and PVP concentration. By utilizing small samples and acquiring spectroscopy data, the influence of hardware and software related imaging confounds and artifacts are negligible, allowing for the most accurate calibration.Methods
Studies were conducted using a 7T Bruker wide-bore vertical spectrometer with a micro2.5 insert set capable of 1475 mT/m maximum gradient strength. Solutions of 0% (distilled water), 24.3%, 34.5%, and 46.6% PVP (Sigma-Aldrich, K40) were prepared and placed in susceptibility matched 5mm Shigemi tubes. NMR spectroscopy data were acquired under controlled temperature with a Bruker VT unit and 10 mm RF coil. The concentration of the PVP solutions were determined by weighting the samples before and after drying. T2 relaxation data were acquired with a CPMG sequence, TR=5000ms, and 80 echoes with 20ms spacing. T1 relaxation data were acquired with an IR-SE sequence, TE/TR=20/7000 ms, and TI from 6-5000 ms. Diffusion-weighted data were acquired with a SE sequence, TE/TR=55/7000 ms, diffusion time (Δ) = 25ms, gradient length (δ) = 3 ms and 32 b-values from 0 to a b-value that attenuated the signal to between 6% and 2% to avoid sampling rectified noise. Measurements were taken at temperatures from 19.1 to 37° C. When changing to a new temperature, the sample was left to equilibrate for 30 minutes.Results
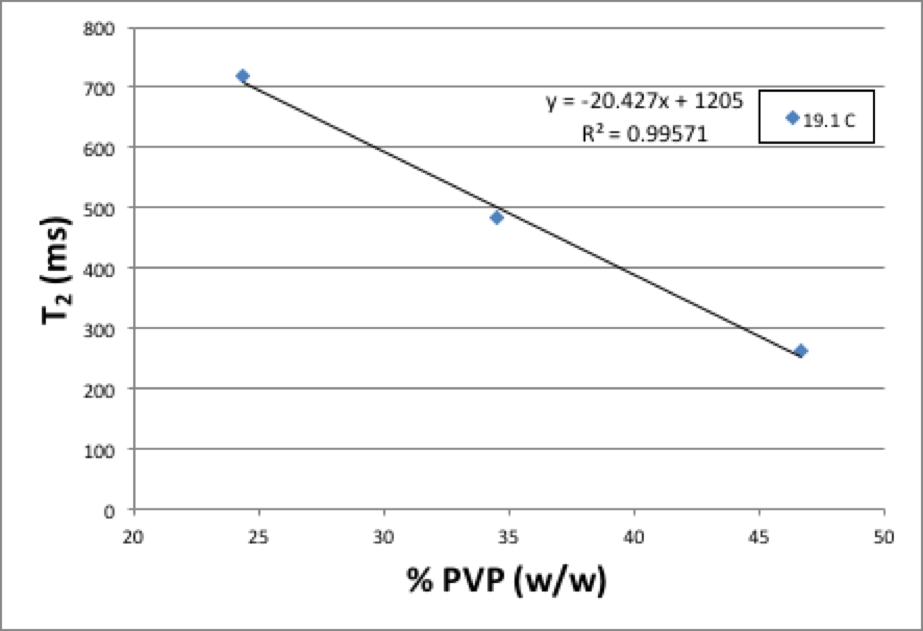
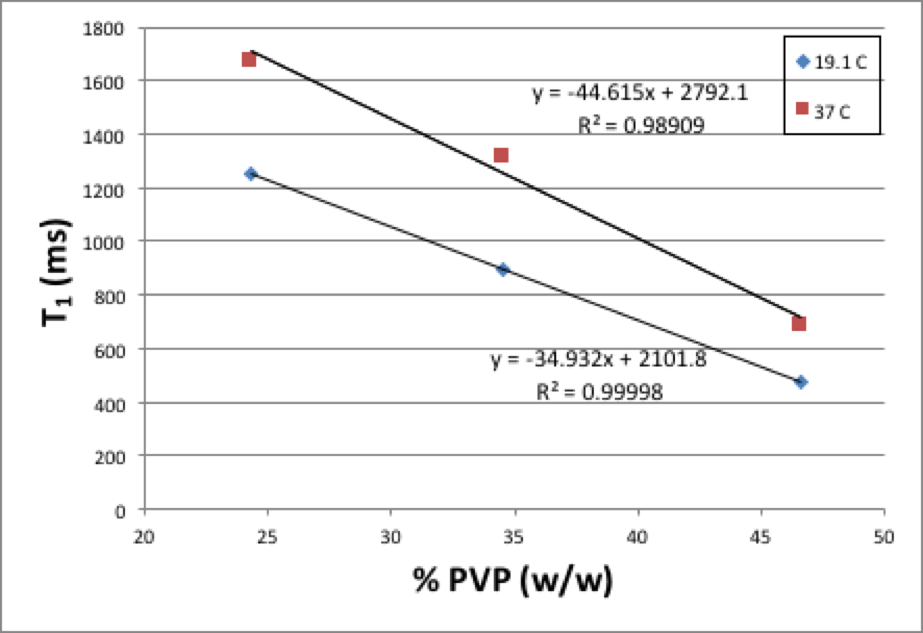
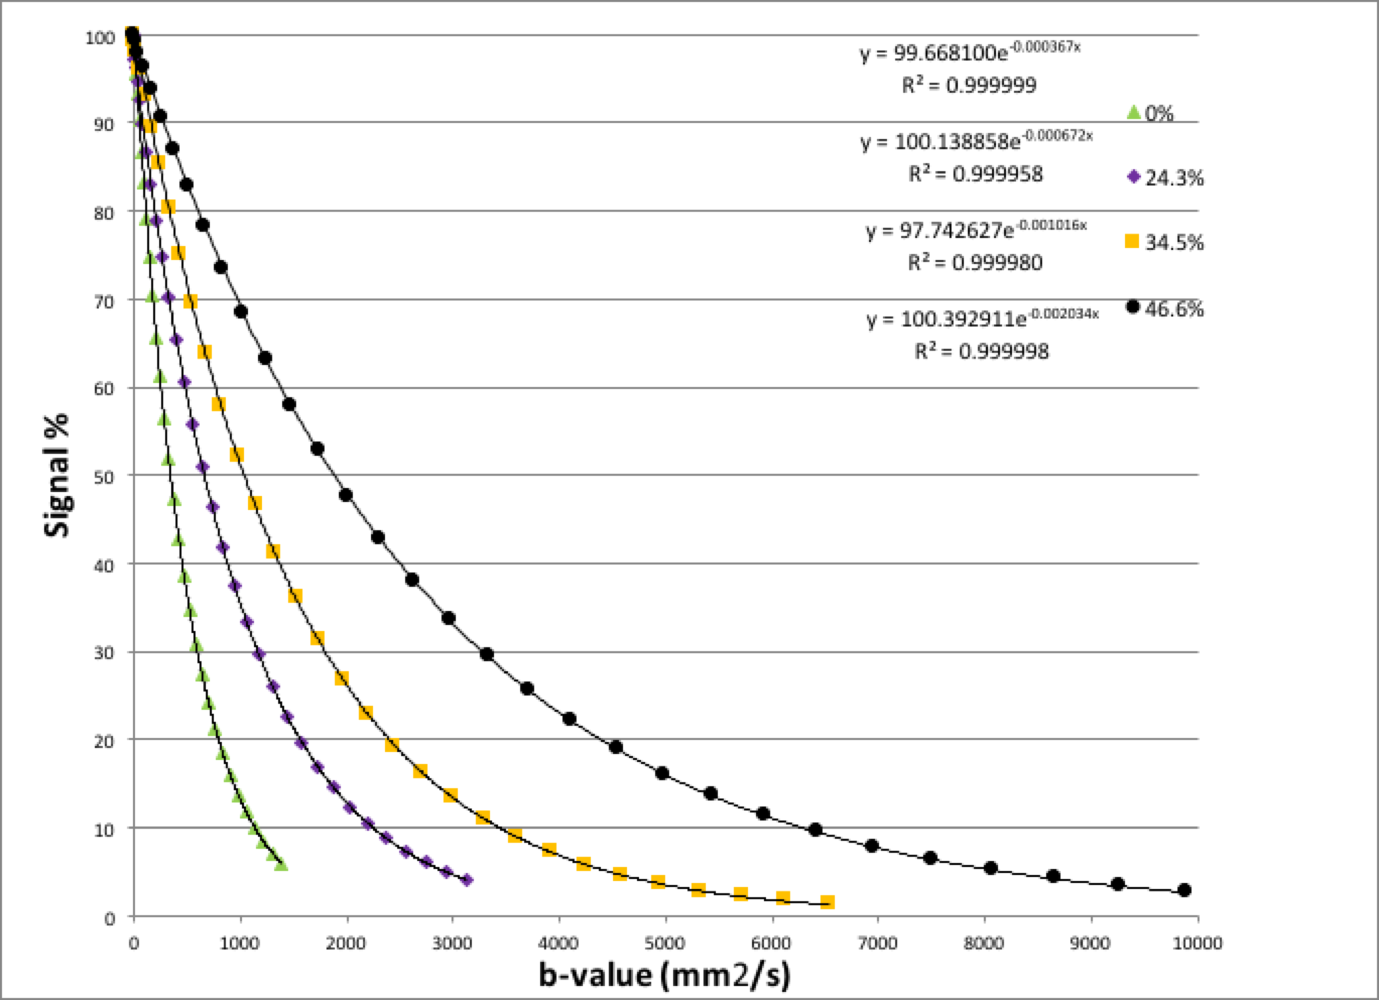
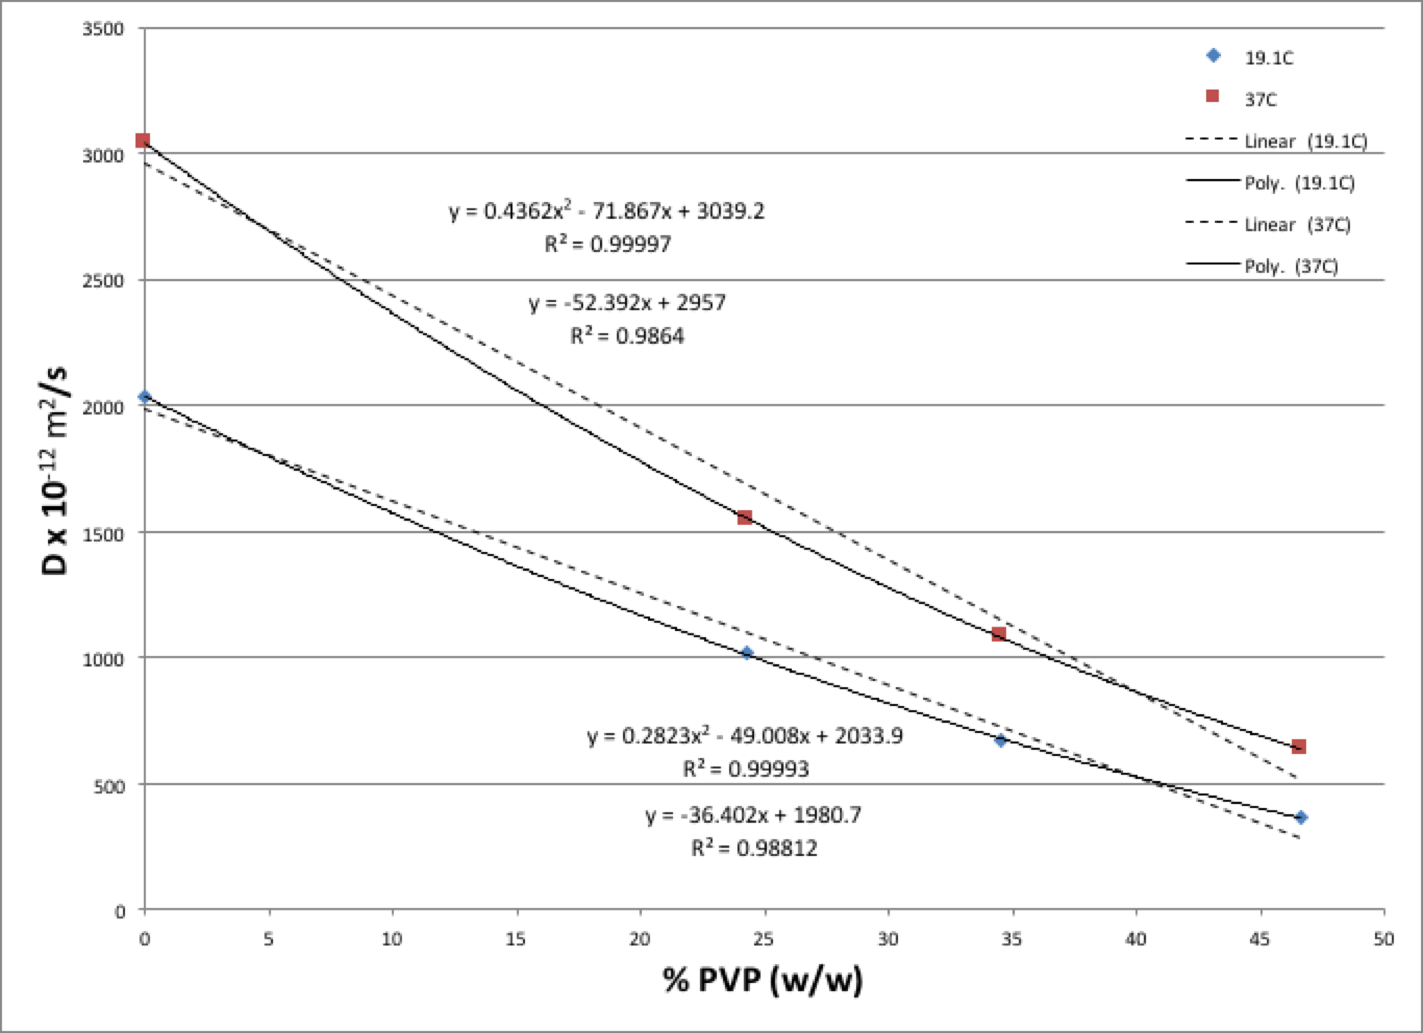
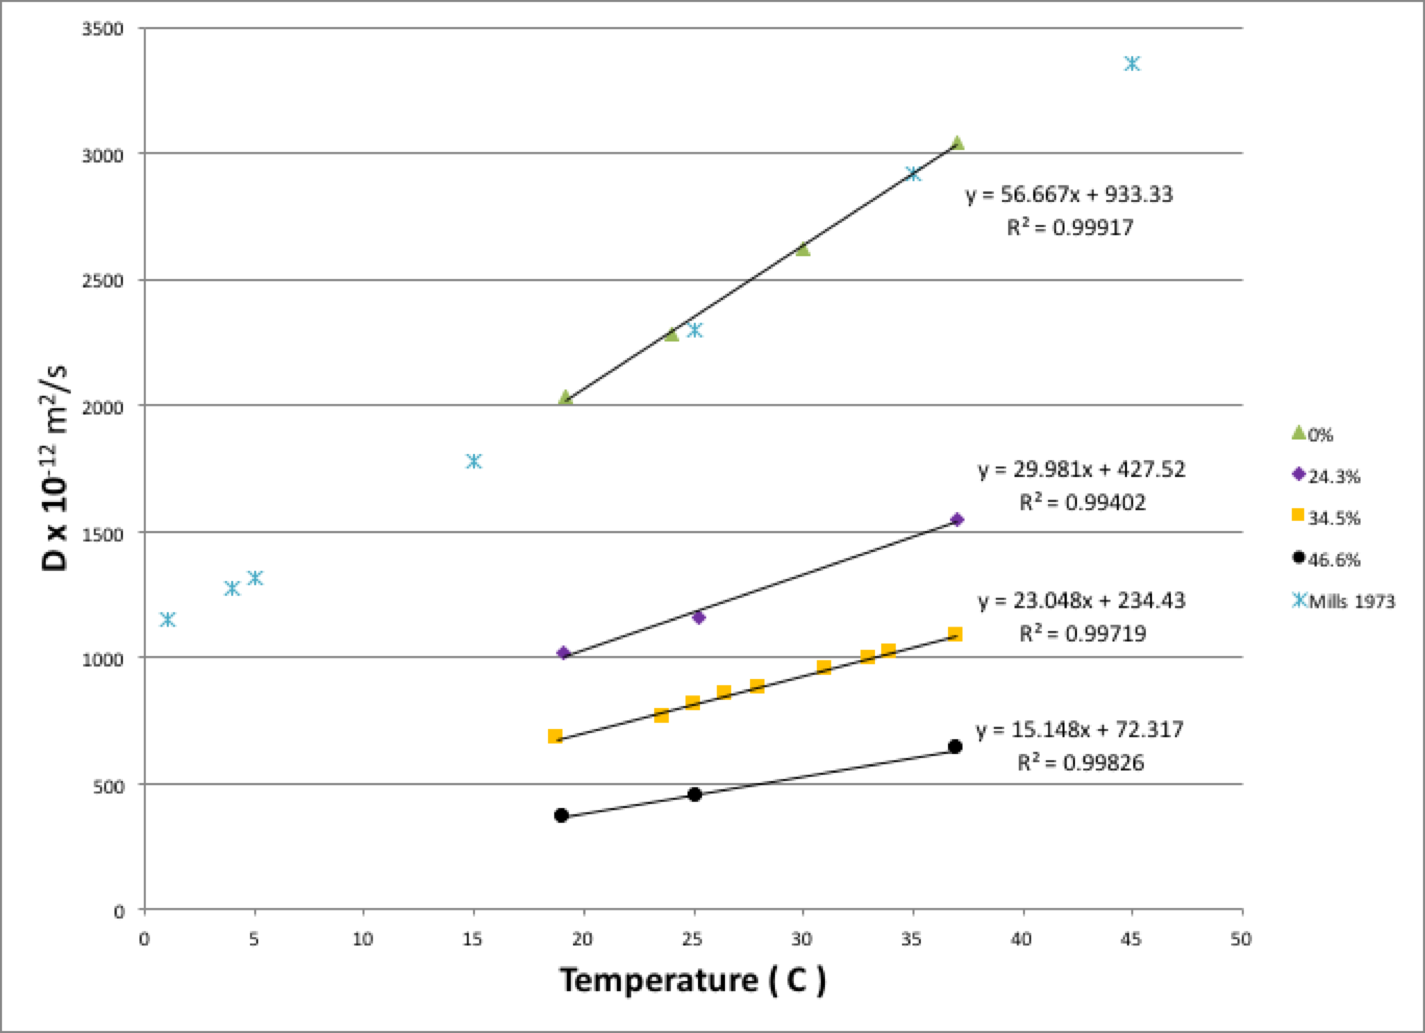
Figure 1 shows that there is a linear relationship between T2 relaxation rate and PVP concentration. Figure 2 shows there is also a linear relationship between T1 relaxation rate and PVP concentration, for both temperatures measured. Figure 3 shows a plot of the mono-exponential signal decay with b-value, for each PVP concentration, at a temperature of 19.1° C. D was calculated from the curves. Figure 4 shows the relationship between D and PVP concentration. The data deviates from a linear relationship and is better described by a quadratic function, which is reasonable for polymer-based aqueous solutions3,4. This behavior is consistent, regardless of temperature. Figure 5 shows the relationship between D and temperature, for all concentrations studied. For reference, points are included for distilled water, 0%, from the 1973 study by Mills5. There is a linear relationship between D and temperature for all PVP concentrations. In addition, the slope of the line decreases with increased concentration. From these results an empirical formula was derived for predicting D given PVP concentration and temperature. The slope and intercept from each linear fit shown in Fig. 5, were plotted separately as a function of PVP concentration. A second degree polynomial was fit to the data. The resulting empirical formula is as follows: D = mT + b, where T is the temperature, m = 0.0086C2 - 1.2862C + 56.603, b = 0.1171C2 -24.033C +934.45, and C is PVP concentration.Discussion
In this study, we measure the MR properties of aqueous PVP solutions. It is possible that solutions made with different molecular weight may differ in their MR properties than those reported here. T2 and T1 relaxation are linearly related to PVP concentration. Although the values for T2 and T1 will change with field strength, we expect this relationship to remain the same. However, the diffusivity should remain constant regardless of field strength. The mono-exponential signal attenuation vs b-value indicates Gaussian diffusion of a single population of spins. Our data was acquired with tight temperature control and without influence of imaging gradients and other “cross-terms”. Therefore, the derived empirical formula can be utilized with PVP aqueous solutions as a calibrated diffusion phantom. Deviation from the D calculated using the empirical formula can be attributed to errors from hardware and/or software. In addition, at room temperature, 23° C, the 34.7% PVP solution has a D and T1 close to that of in vivo brain parenchyma. PVP solutions are well suited as a MR phantom material for clinical and research purposes.Acknowledgements
No acknowledgement found.References
1) Pierpaoli et al., ISMRM 2009; p.1414.
2) Wagner et al., PLoS ONE. 2017; 12(6):e0179276.
3) Pickup and Blum, Macromolecules. 1989; 22:3961-3968.
4) Bai et. al., J Appl Polym Sci. 2013; DOI:10.1002/APP.40001.
5) Mills, J Phys Chem-US 1973; 77(5):685-8.
Figures