3226
Multisite Reproducibility of Radiomics and ADC Measurements for temperature-controlled phantom: Preliminary Results.1The Russell H. Morgan Dept of Radiology and Radiological Science, The Johns Hopkins University School of Medicine, Baltimore, MD, United States, 2Radiology, University of Michigan, Ann Arbor, MI, United States, 3Radiology and Biomedical Imaging, University of California San Francisco, San Francisco, CA, United States, 4Computer Science, The Johns Hopkins University, Baltimore, MD, United States
Synopsis
Radiomics is an emerging field which deals with high throughput extraction of quantitative features from radiological images. Radiomic features correspond to textural information that is otherwise not visually perceivable. To establish confidence intervals for extracted features the longitudinal reproducibility of the radiomic metrics should be assessed with the standard. This work has demonstrated radiomic reproducibility for ADC mapping acquired for the ice-water phantom over several years on three independent systems at two different field strengths (1.5 and 3T).
Introduction:
Radiomic
features correspond to quantitative textural data extracted from radiological
imaging that is otherwise not qualitatively detectable [1-8]. For transition from research to clinical
applications, there is a need to better understand the repeatability and reproducibility
of radiomics in relation to underlying MRI parameters. Quantitative apparent
diffusion coefficient ADC mapping provides physiological information that
corresponds to water movement and cellularity within tissue. Hence, the purpose
of our study is to establish the baseline repeatability and reproducibility of
radiomics and ADC mapping at 1.5T and 3T with a standardized phantom.Methods:
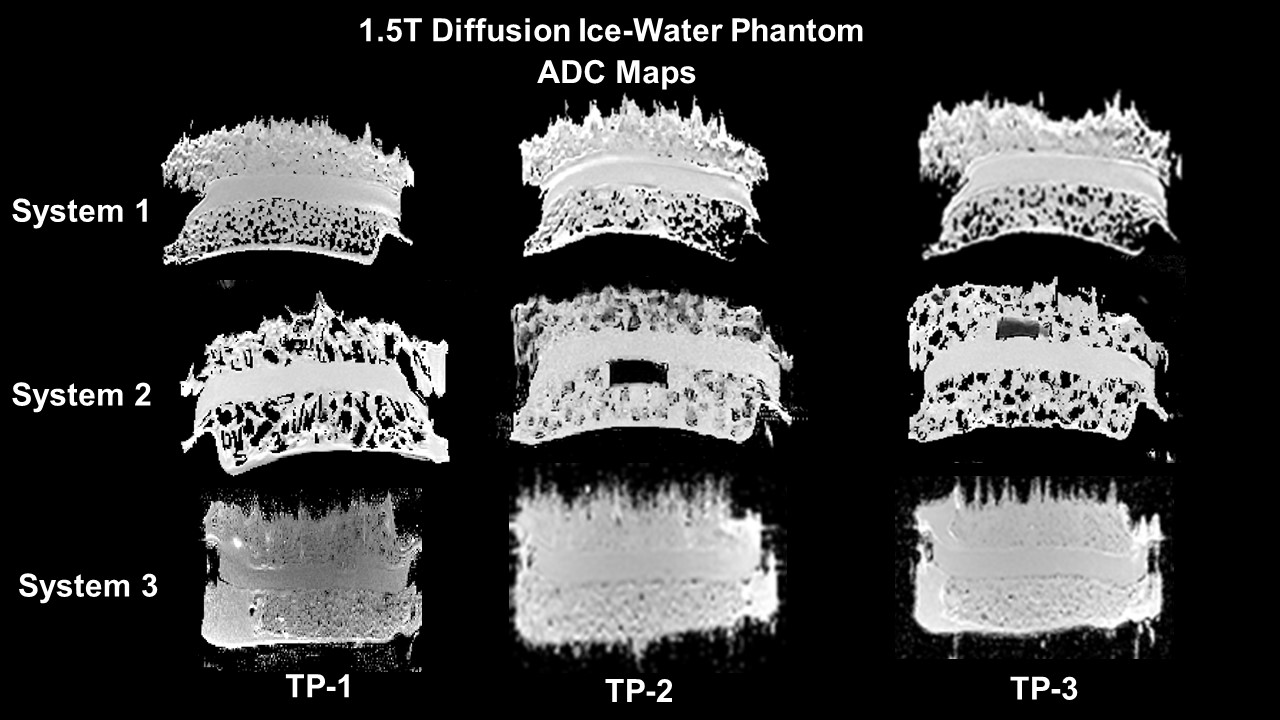
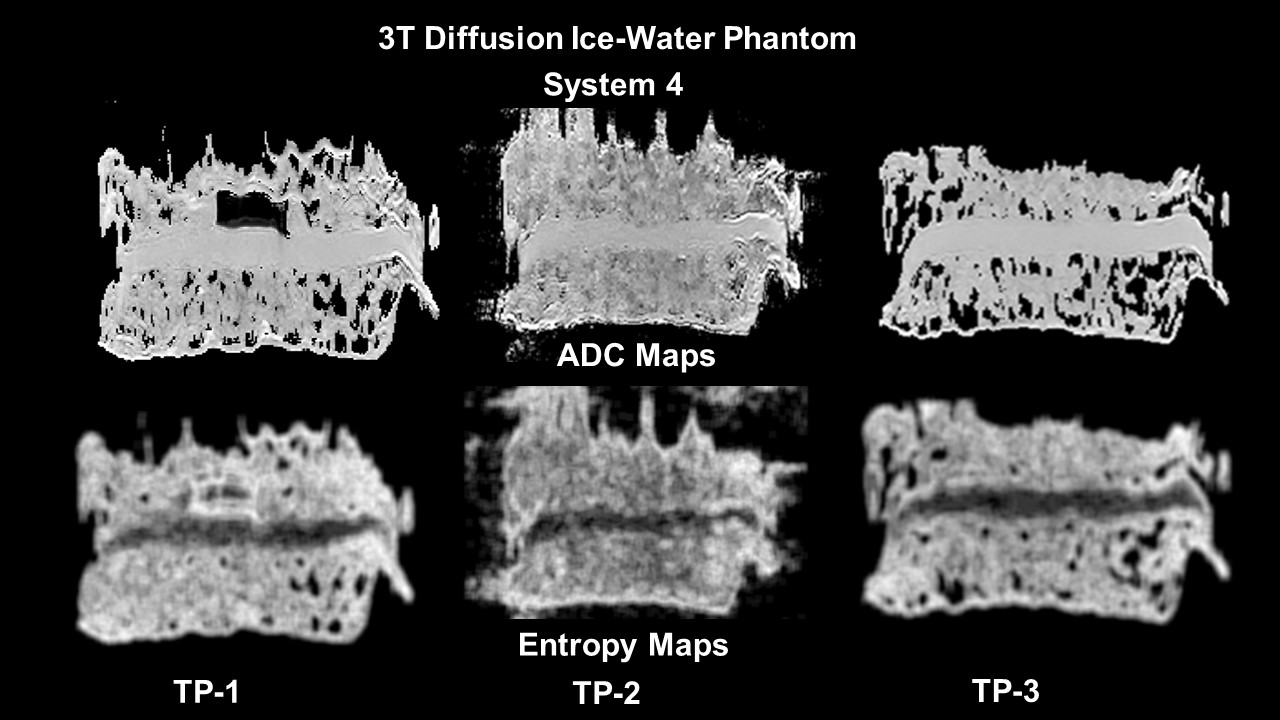
A diffusion ice-water phantom [9,10] was scanned using a phased array body coil on three 1.5T (Sys1, Sys2 and Sys3) and two 3T (Sys4 and Sys5) clinical scanners from different MRI vendors. Scans were performed on three dates (> 6 months apart) according to shared protocol [9]. The phantom was oriented with the central cylinder along the right-left (RL) axis as shown in Figure 1. Single shot spin-echo (SSE) DWI scans were performed on all five systems using b=0, 750, and 1500 s/mm2[10]. ADC maps were generated as a slope of linear least squares fit for log-intensity as a function of b-value. Radiomic maps and features were computed by convolving ADC images with statistical filters based on first order statistics (e.g. Shannon entropy) and Haralick’s gray level co-occurrence matrix features [1-5]. The radiomic neighborhood of five pixels was used with 128 gray levels with different bins widths. ADC maps were segmented using machine learning algorithm to define the Regions of interest (ROI)[11]. The ROIs were overlaid on ice portion and long water tube within the DWI phantom to calculate the texture and ADC features. Additional ROIs were defined in the noise. Percent differences were calculated between each time point at each center and across centers. Mean entropy and ADC map values with standard deviations (SD) were reported with statistical significance set at p<0.05.Results:
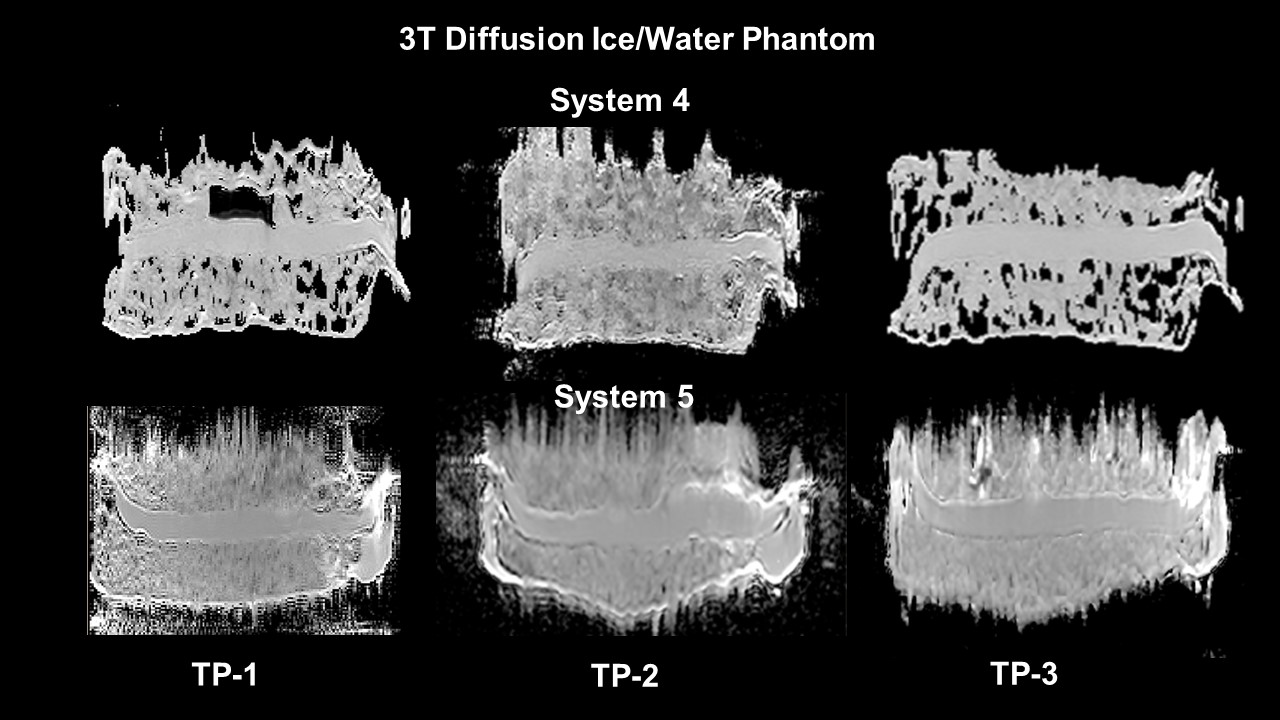
Figures 1-3
demonstrate our results in the phantoms on all systems. There were nine scans
at 1.5T and six at 3T. The percent
differences for the ice-water radiomic and ADC map values at 1.5 varied with
each system and across systems.
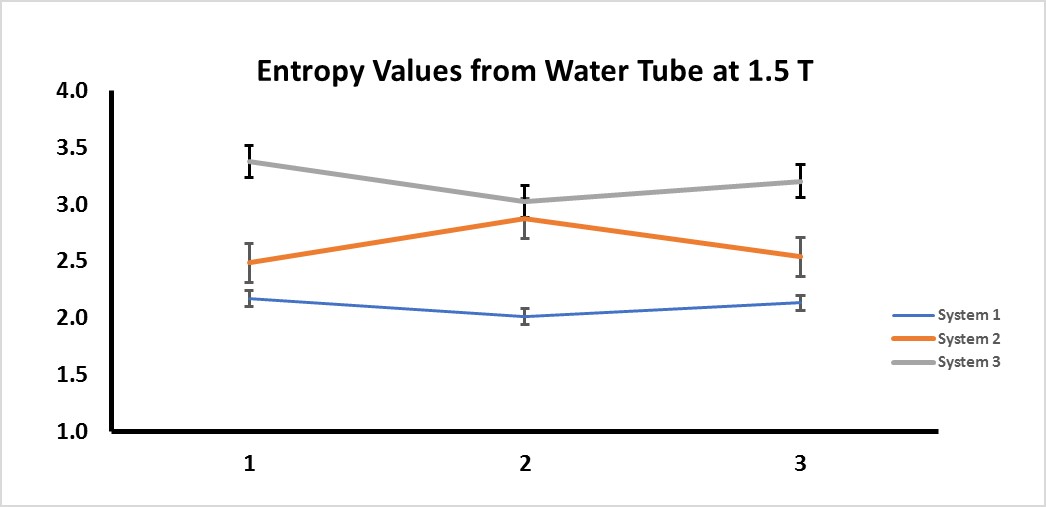
Intravariability of these values at 1.5T were consistent for each
system. The mean±SD entropy values for the water-tube portion of
the phantom from the 1.5T systems were as follows: Sys1=2.10±0.1, Sys2=2.63±0.2, and Sys3=3.2±0.1 (Figure 4). The mean±SD ADC
map values for the water-tube portion
of the phantom the 1.5T systems were
Sys1=1.11±0.01, Sys2=1.12±0.01, and Sys3=1.15±0.02. The cross-system
variability of ice-water ADC was from 4% to 1%. However, the percent difference
in the water-tube radiomic entropy value
varied from 40% (Sys1 versus Sys3) to 19.5% (Sys2 versus Sys1). Similar results were noted for the ice
portion of the phantom, except the range across systems decreased down to 9% and
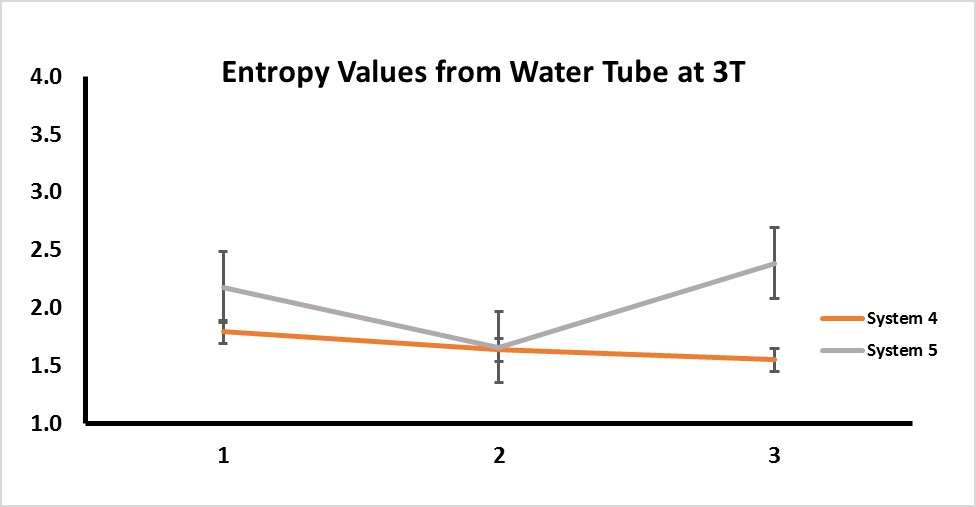
21%. At 3T, the mean±SD entropy values for the water-tube were: Sys4:1.66±0.1 and Sys5:2.1±0.3 (Figure 5). The mean±SD ADC map values were Sys4:1.13±0.01, and Sys5:1.13±0.02. However, across the 3T
systems, the percent difference radiomic entropy value of the water-tube decreased significantly down to 22% with the ADC map’s
percent difference at 0.5%. Again,
similar results were noted for the ice portion of the phantom.Discussion:
We have measured the repeatability and reproducibility of radiomics and ADC mapping over a multiyear time period at different field strengths and systems(Figures 1-3). The Intra-system variability was excellent, with increased variably across different platforms significantly higher for entropy versus ADC values and at 1.5T versus 3T systems. These differences maybe potentially related to the system-specific gradient characteristics [10] and will be further investigated. A radiomic approach for multiparametric MR imaging provides quantitative interrogation of the underlying image gray level correlated with tissue biology [6,11]. Our preliminary results suggest the potential for multisite radiomic applications focused on characterization of different image “morphology”. Therefore, this study lays the foundation for a systemic evaluation of quantitative metrics for the image texture features related to tissue biology, which provides a promising tool both for cancer diagnosis [5,8] and other kinds of pathologies. In summary, we have benchmarked repeatability and reproducibility of radiomics and ADC mapping across five systems at 1.5T and 3T with a standardized phantom.Acknowledgements
R01CA190299, 5P30CA006973 (IRAT), U01CA140204, U01CA166104, U01CA151235 and GPU equipment grant from NVidia Corporation.References
1. Shannon CE. A mathematical theory of communication. The Bell System Technical Journal. July 1948;27(3):379-423.
2. Haralick RM, Shanmugam K, Dinstein IH. Textural features for image classification. IEEE Transactions on Systems, Man and Cybernetics. 1973(6):610-621.
3. Galloway MM. Texture analysis using gray level run lengths. Computer graphics and image processing. 1975;4(2):172-179.
4. Lambin P, Rios-Velazquez E, Leijenaar R, et al. Radiomics: extracting more information from medical images using advanced feature analysis. European Journal of Cancer. 2012;48(4):441-446.
5. Aerts HJ, Velazquez ER, Leijenaar RT, et al. Decoding tumour phenotype by noninvasive imaging using a quantitative radiomics approach. Nature communications. 2014;5:4006.
6. Gillies RJ, Kinahan PE, Hricak H. Radiomics: Images Are More than Pictures,They Are Data. Radiology. 2016; 278(2):563-577.
7. Parekh V, Jacobs MA. Radiomics: a new application from established techniques. Expert Review of Precision Medicine and Drug Development. 2016;1(2):207-226.
8. Parekh V, Jacobs MA. Integrated radiomic framework for breast cancer and tumor biology using advanced machine learning and multiparametric MRI. npj Breast Cancer. 2017;in press, https://doi.org/10.1038/s41523-017-0045-3
9. Chenvert TL and Malyarenko DI, “Longitudinal quantitative diffusion phantom QC protocol” 2106; https://www.researchgate.net/publication/316932001
10. Malyarenko DI, Newitt D, Wilmes LJ, et.al. Magn Reson Med. 2016; 75(3):1312-23
11. VS Parekh, MA
Jacobs. IEEE Biomedical Imaging (ISBI), 2016; 420-423
Figures