3222
Transient anomalous diffusion micro-MRI parameters reflect white matter morphology: comparison with histology of the mouse spinal cord.1Physics, CNR ISC, UOS Roma Sapienza, Sapienza University of Rome, Rome, Italy, 2Physics, Biophysics division, Sapienza University of Rome, Rome, Italy, 3Biology and Biotechnologies C. Darwin, Research Center of Neurobiology Daniel Bovet, Sapienza University of Rome, Rome, Italy, 4Biology, University of Naples Federico II, Naples, Italy, 5Radiology, Laboratory for Structural, Physiologic and Functional Imaging, Perelman School of Medicine, University of Pennsylvania, Philadelphia, PA, United States
Synopsis
Transient-anomalous diffusion (tAD) has previously been used for tumor delineation and human brain tissue characterization, however, comparison with histology is largely missing. This work aims to compare α and γ tAD parameters, DTI and q-space-imaging parameters obtained at 9.4T with micro-MRI, with the morphologic characteristics provided by optical microscopy of mouse spinal cord white matter (MSC-wm). We found that γ- and q-space-imaging are sensitive to axon diameter and effective local axon density, while α-imaging is sensitive to the heterogeneity or degree of disorder of the wm tracts. These techniques outperform DTI as a means to probe MSC-wm morphology.
Introduction
Anomalous diffusion (AD) broadly refers to situations where the mean square displacement is no longer proportional to diffusion time. Depending on the time scale examined, AD may be transient, which has given rise to the concept of transient AD (tAD)1,2. Techniques based on tAD, named γ-imaging and α-imaging, have recently been applied to excised human tissue1 and human brain in vivo2, showing sensitivity to local susceptibility differences1, 2 and structural disorder1, 3, 4. However, a comprehensive biophysical understanding of tAD parameters is still missing. Among other diffusion techniques, q-space-imaging (QSI) allowed assessment of tissue microarchitecture in mouse spinal cord white matter (MSC-wm)5,6. Here we compare α and γ and diffusion-micro-MRI parameters with morphologic measures resolved by optical microscopy in MSC-wm tracts, to evaluate the biophysical associations of tAD with the tissue morphology.Methods
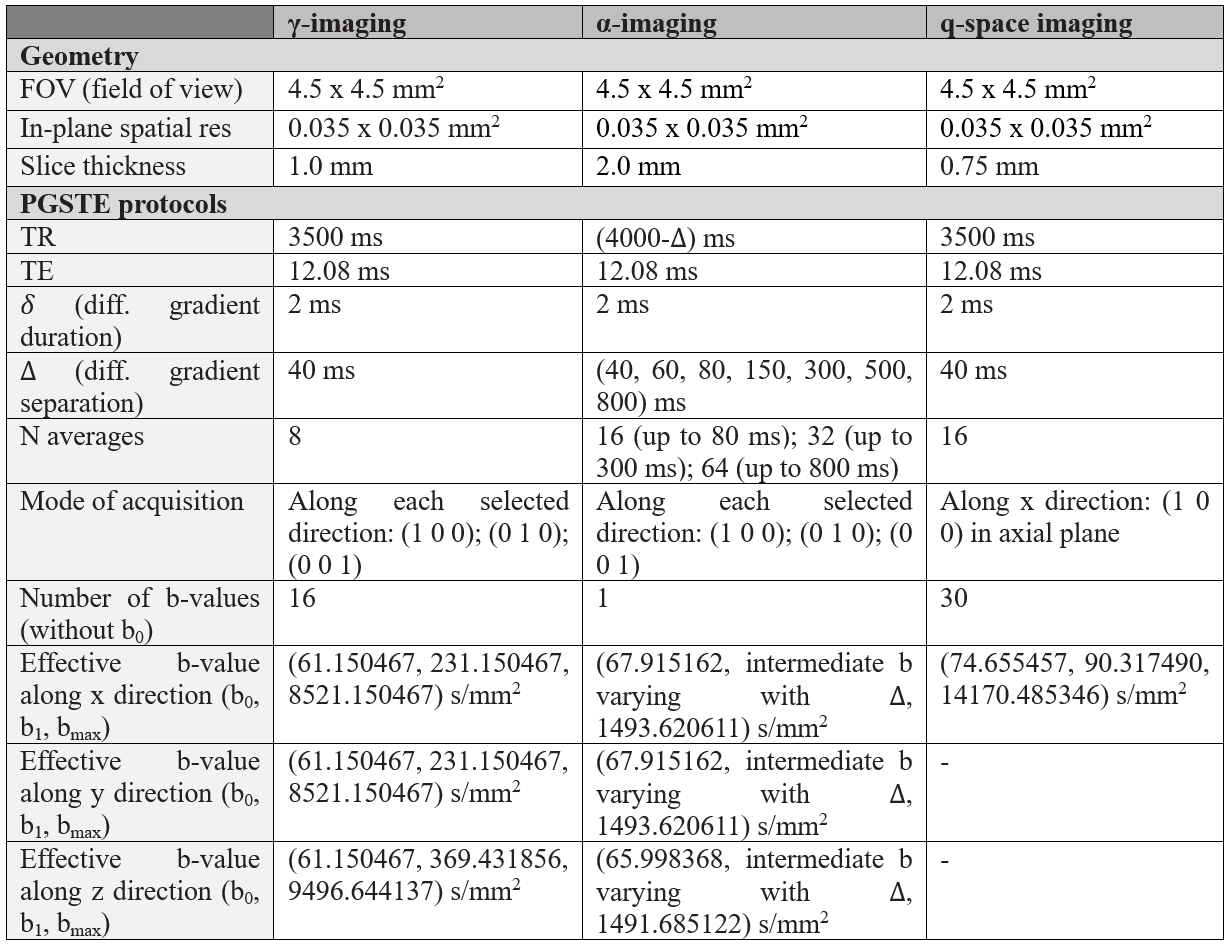
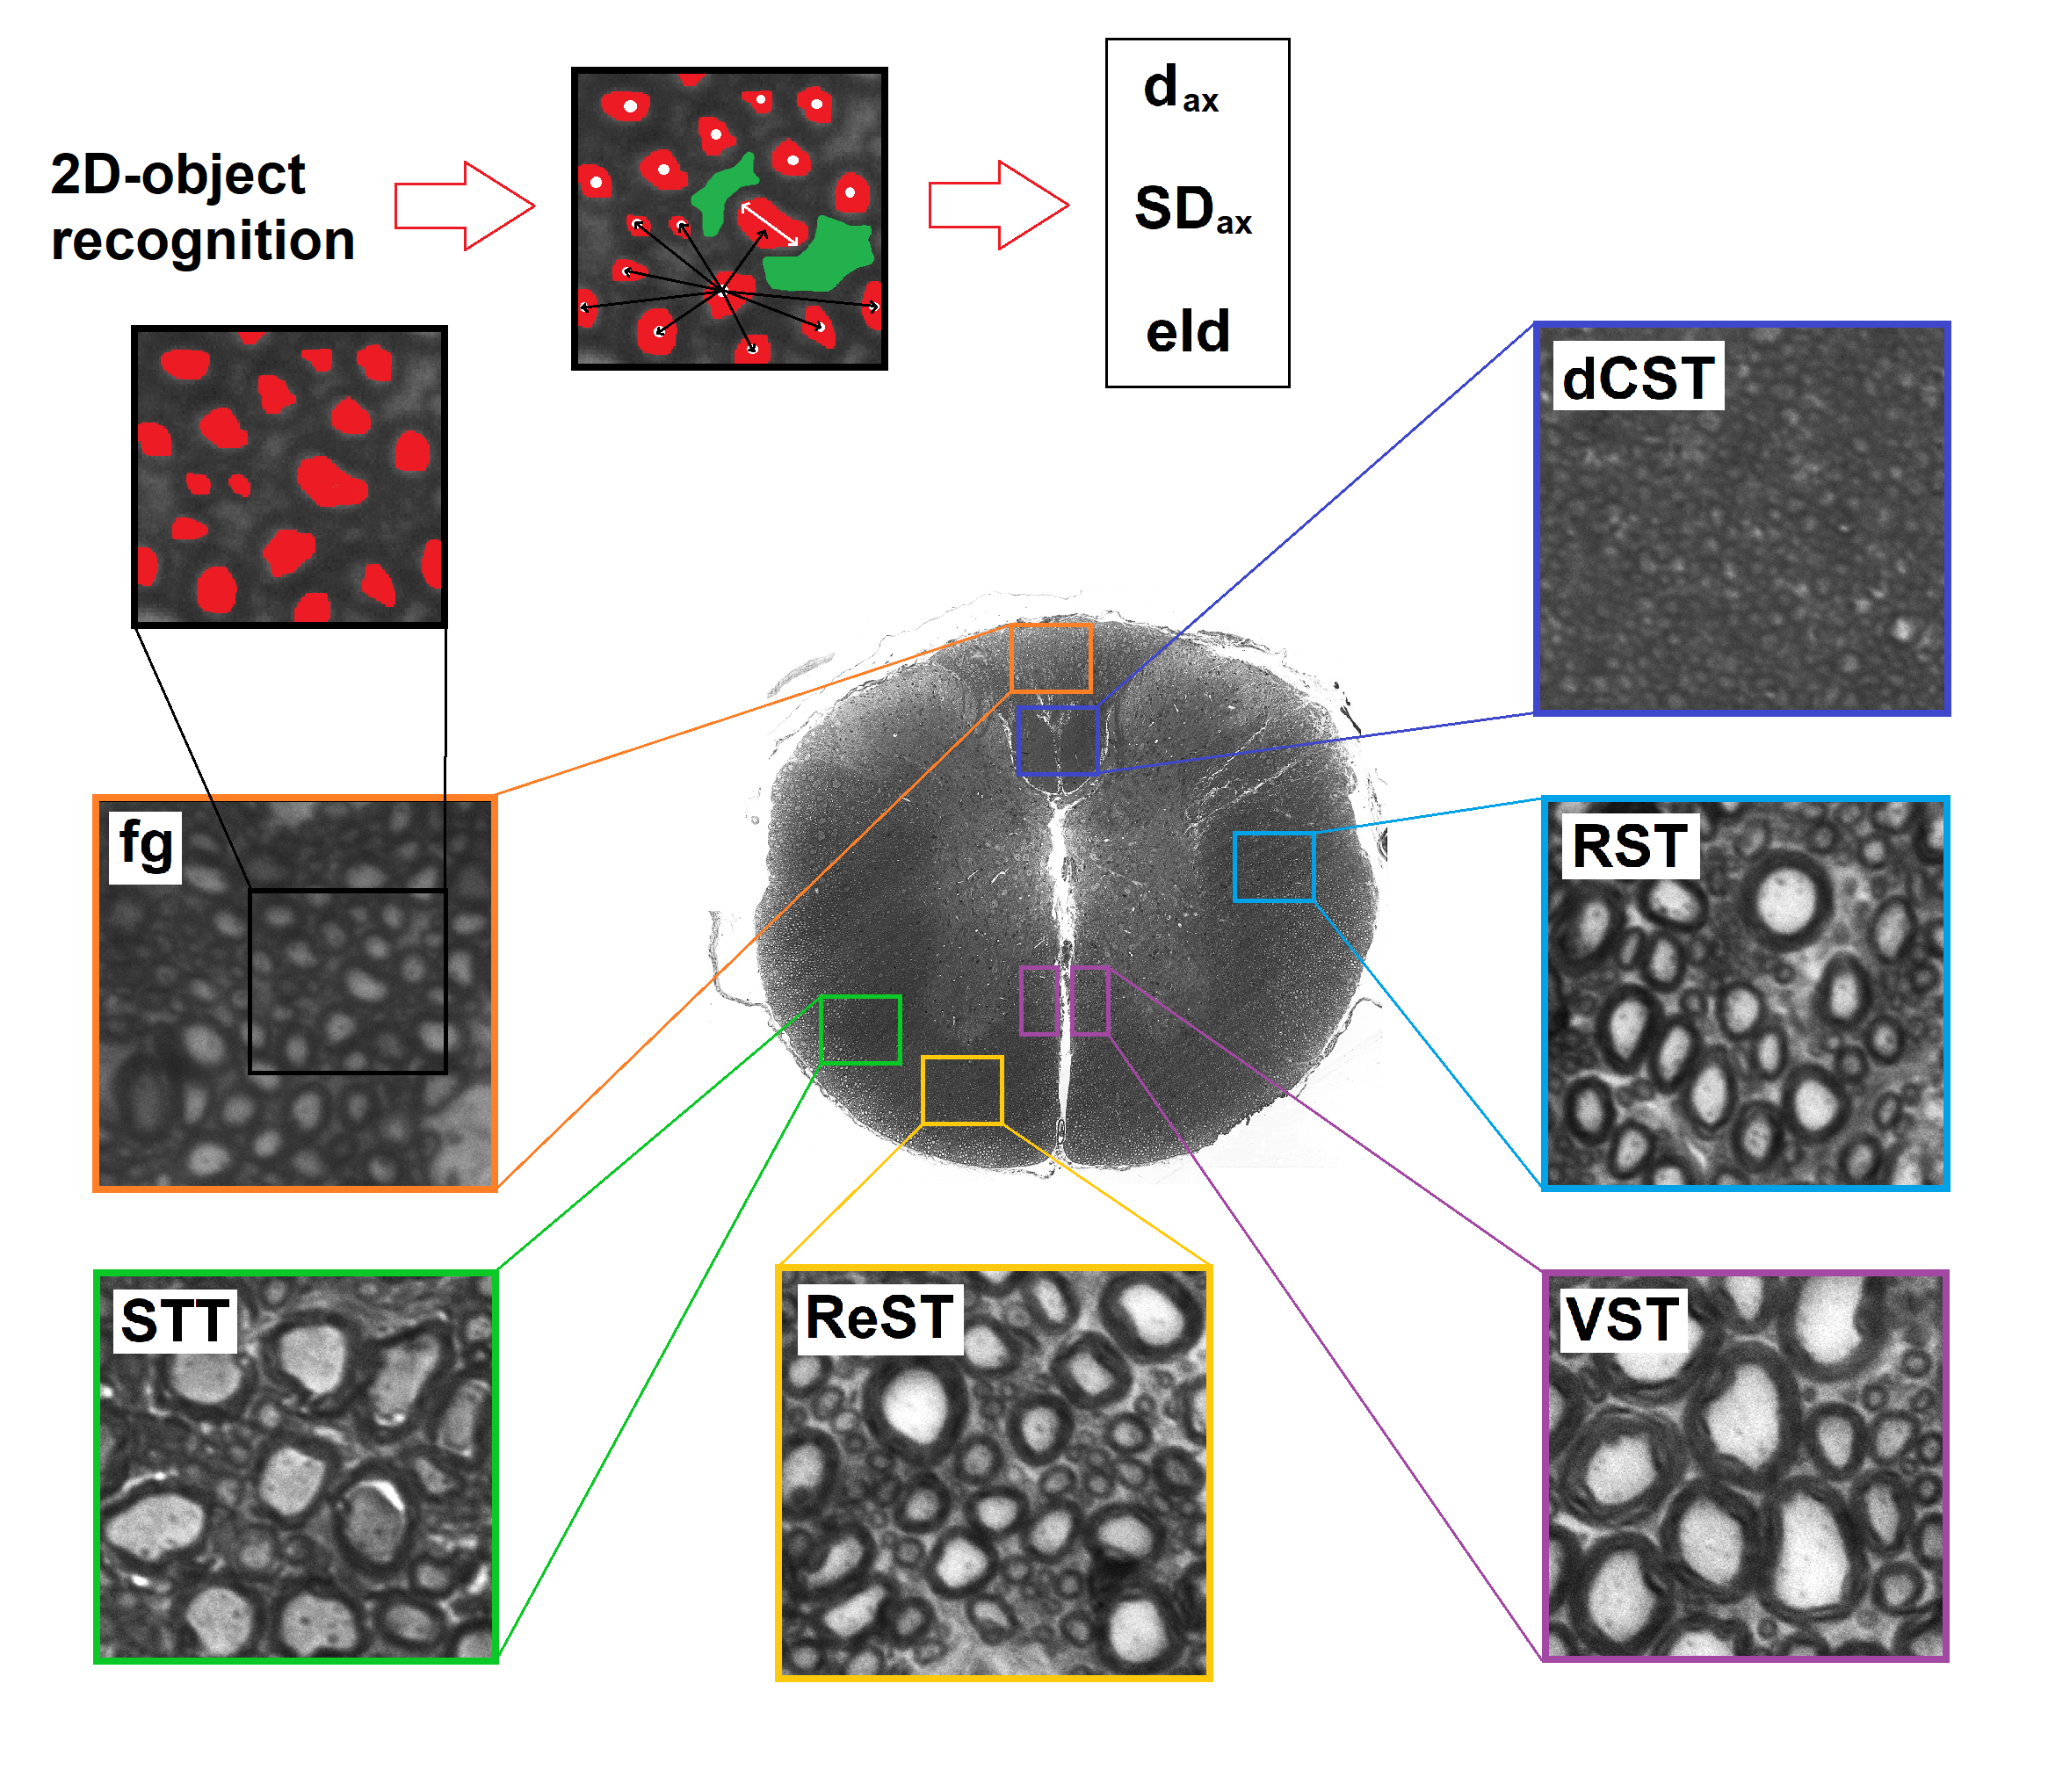
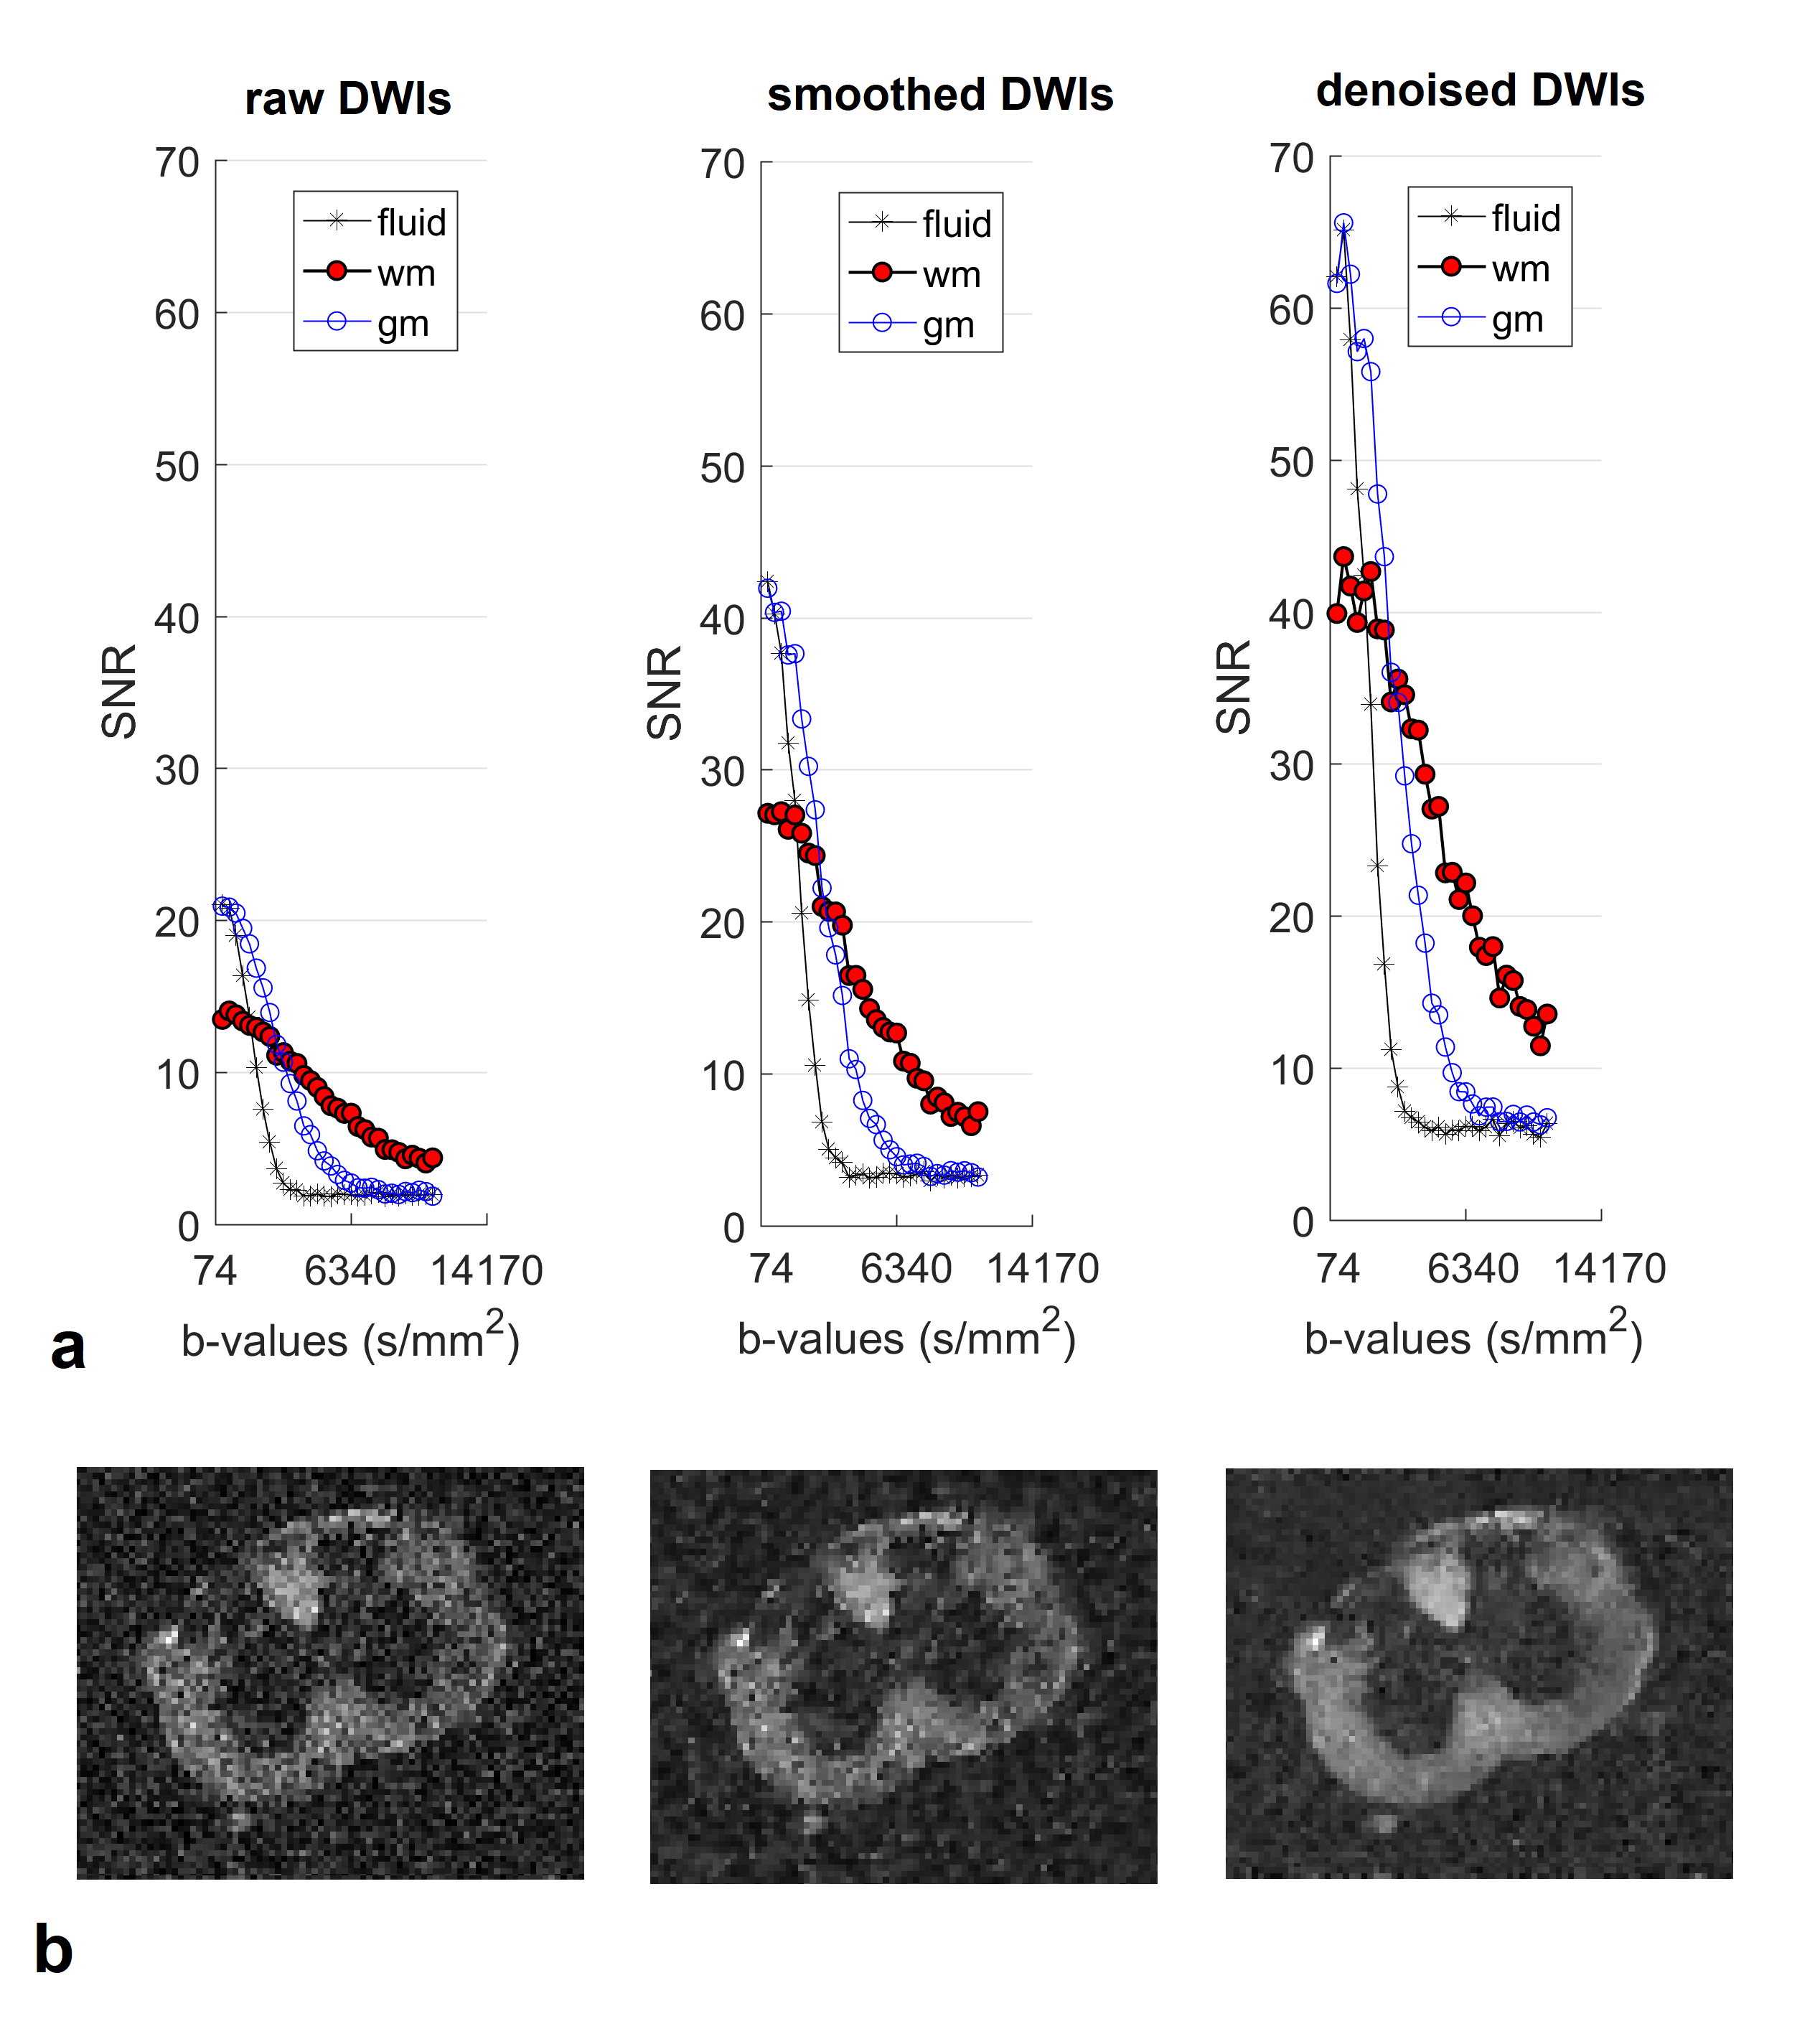
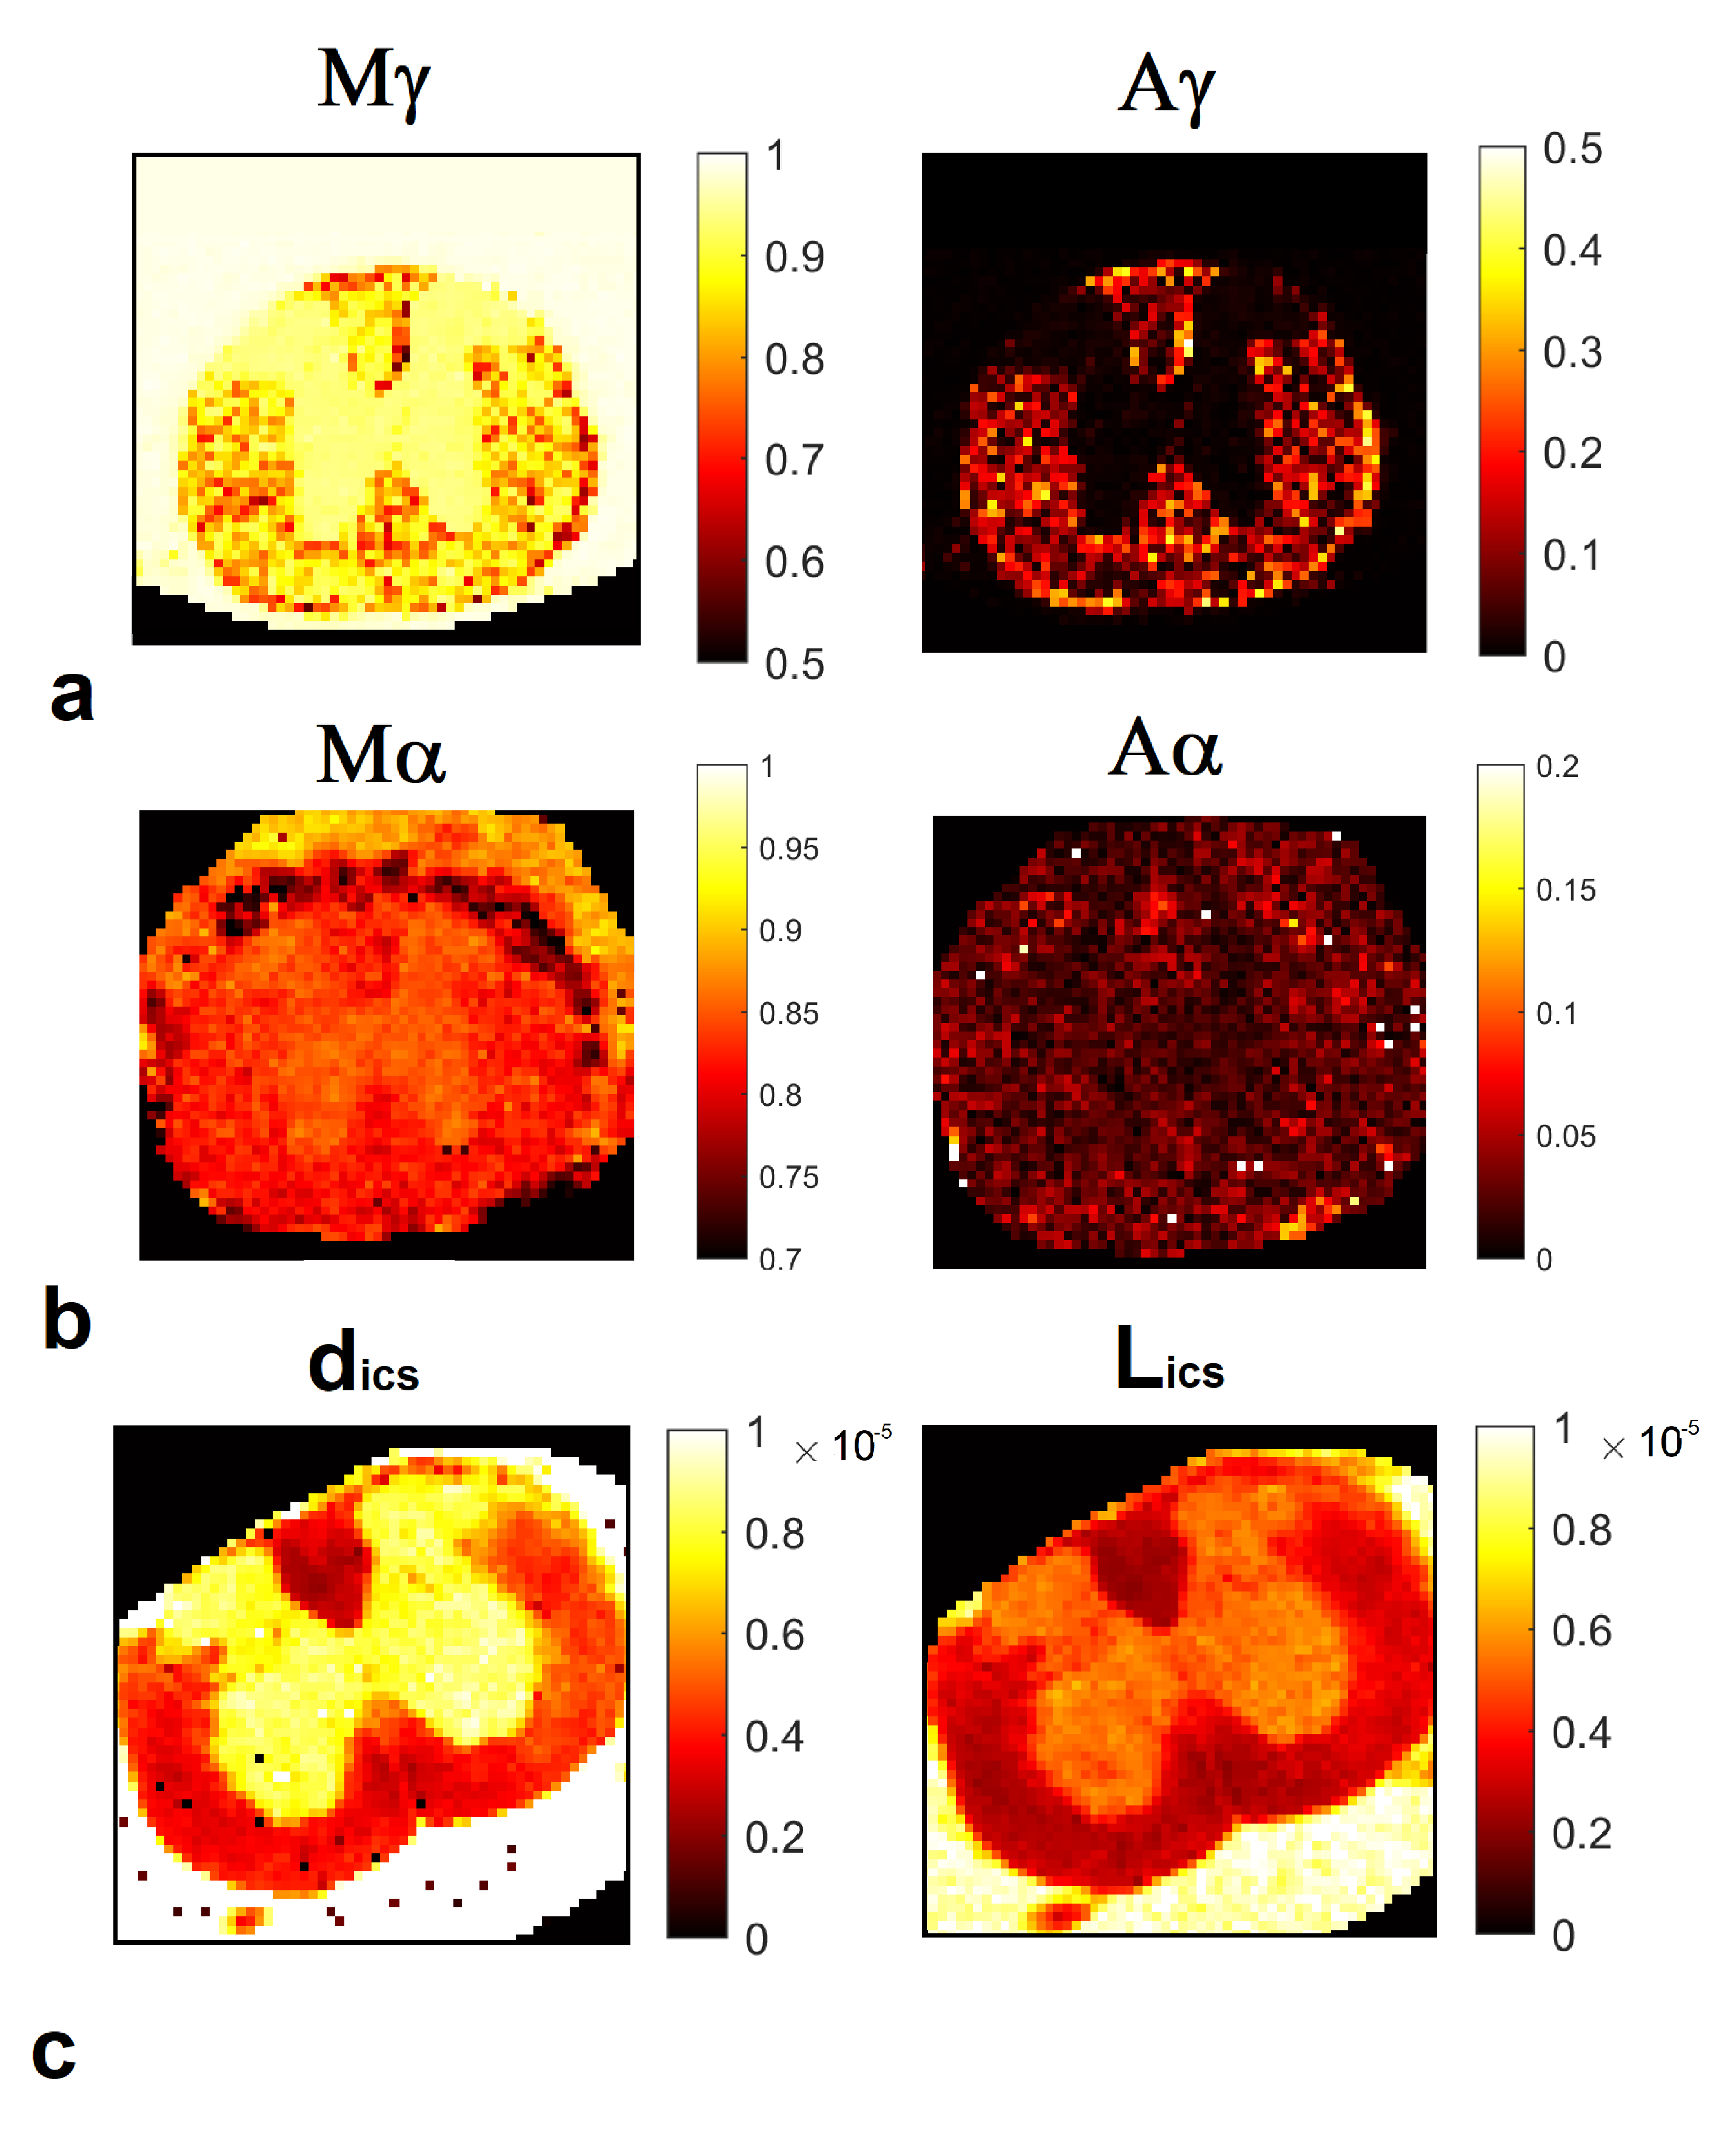
The MSC was extracted from a C57/BL6 mouse and fixed following the procedure in Ong et al.6. The sample was scanned on a Bruker Avance 400MHz spectrometer (B0=9.4T, max gradient strength=1.2 T/m; rise time=100 µs) along three orthogonal directions, selecting axial slices at the lumbar and thoracic levels. Diffusion weighted images (DWIs) were acquired with Pulsed Gradient Stimulated Echo (PGSTE) sequences (Fig. 1). DWIs were denoised7 to minimize noise-bias by means of MRtrix3 software (http://www.mrtrix.org/). FSL 5.0 DTIFIT routine8 was used to measure mean diffusivity (MD), fractional anisotropy (FA), axial (Dpar) and radial (Dort) diffusivity. γ-imaging and α-imaging parameters (mean-γ=Mγ, axial-γ=γpar, radial-γ=γort, γ-anisotropy=Aγ, and Mα, αpar, αort and Aα, computed similarly to DTI) were extracted, by fitting echo attenuation $$$S(q,\triangle)$$$, where q is the wave vector, to models $$$S(q)=A\cdot\exp(-D_{gen}q^{\gamma}\triangle)+c$$$, and $$$S(\triangle)=A\cdot\exp(-D_{gen}q^{2}\triangle^{\alpha})+c$$$ (Dgen=generalized diffusion constant; c=offset). QSI parameters were extracted using the low-q-value approximation (dics and decs represent mean displacements in the intra- and extra-cellular spaces) and fitting the Fourier Transform of the normalized signal to a Lorentzian curve (Lics, proportional to its FWHM)5. After MRI the MSC was prepared for histology9: 1.5 µm-sections cut at the lumbar and thoracic levels were analyzed with a Zeiss Axioskop light microscope. Axon diameter $$$d_{ax}=2\cdot\sqrt{A/\pi}$$$, where A is the area of an equivalent circle6, standard deviation of the axons distribution (SDax), effective local axonal density (eld)10 were measured by means of a custom-made MATLAB script (MATLAB R2016a, The MathWorks, Inc., Natick, Massachusetts, United States), performing 2D-object recognition with selection rules in chosen regions of interest (ROI). The relation between diffusion-micro-MRI parameters and morphologic measures was assessed via Pearson’s linear correlation, rejecting the null hypothesis for P<0.05. All the analyses and computations were performed in MATLAB.Results
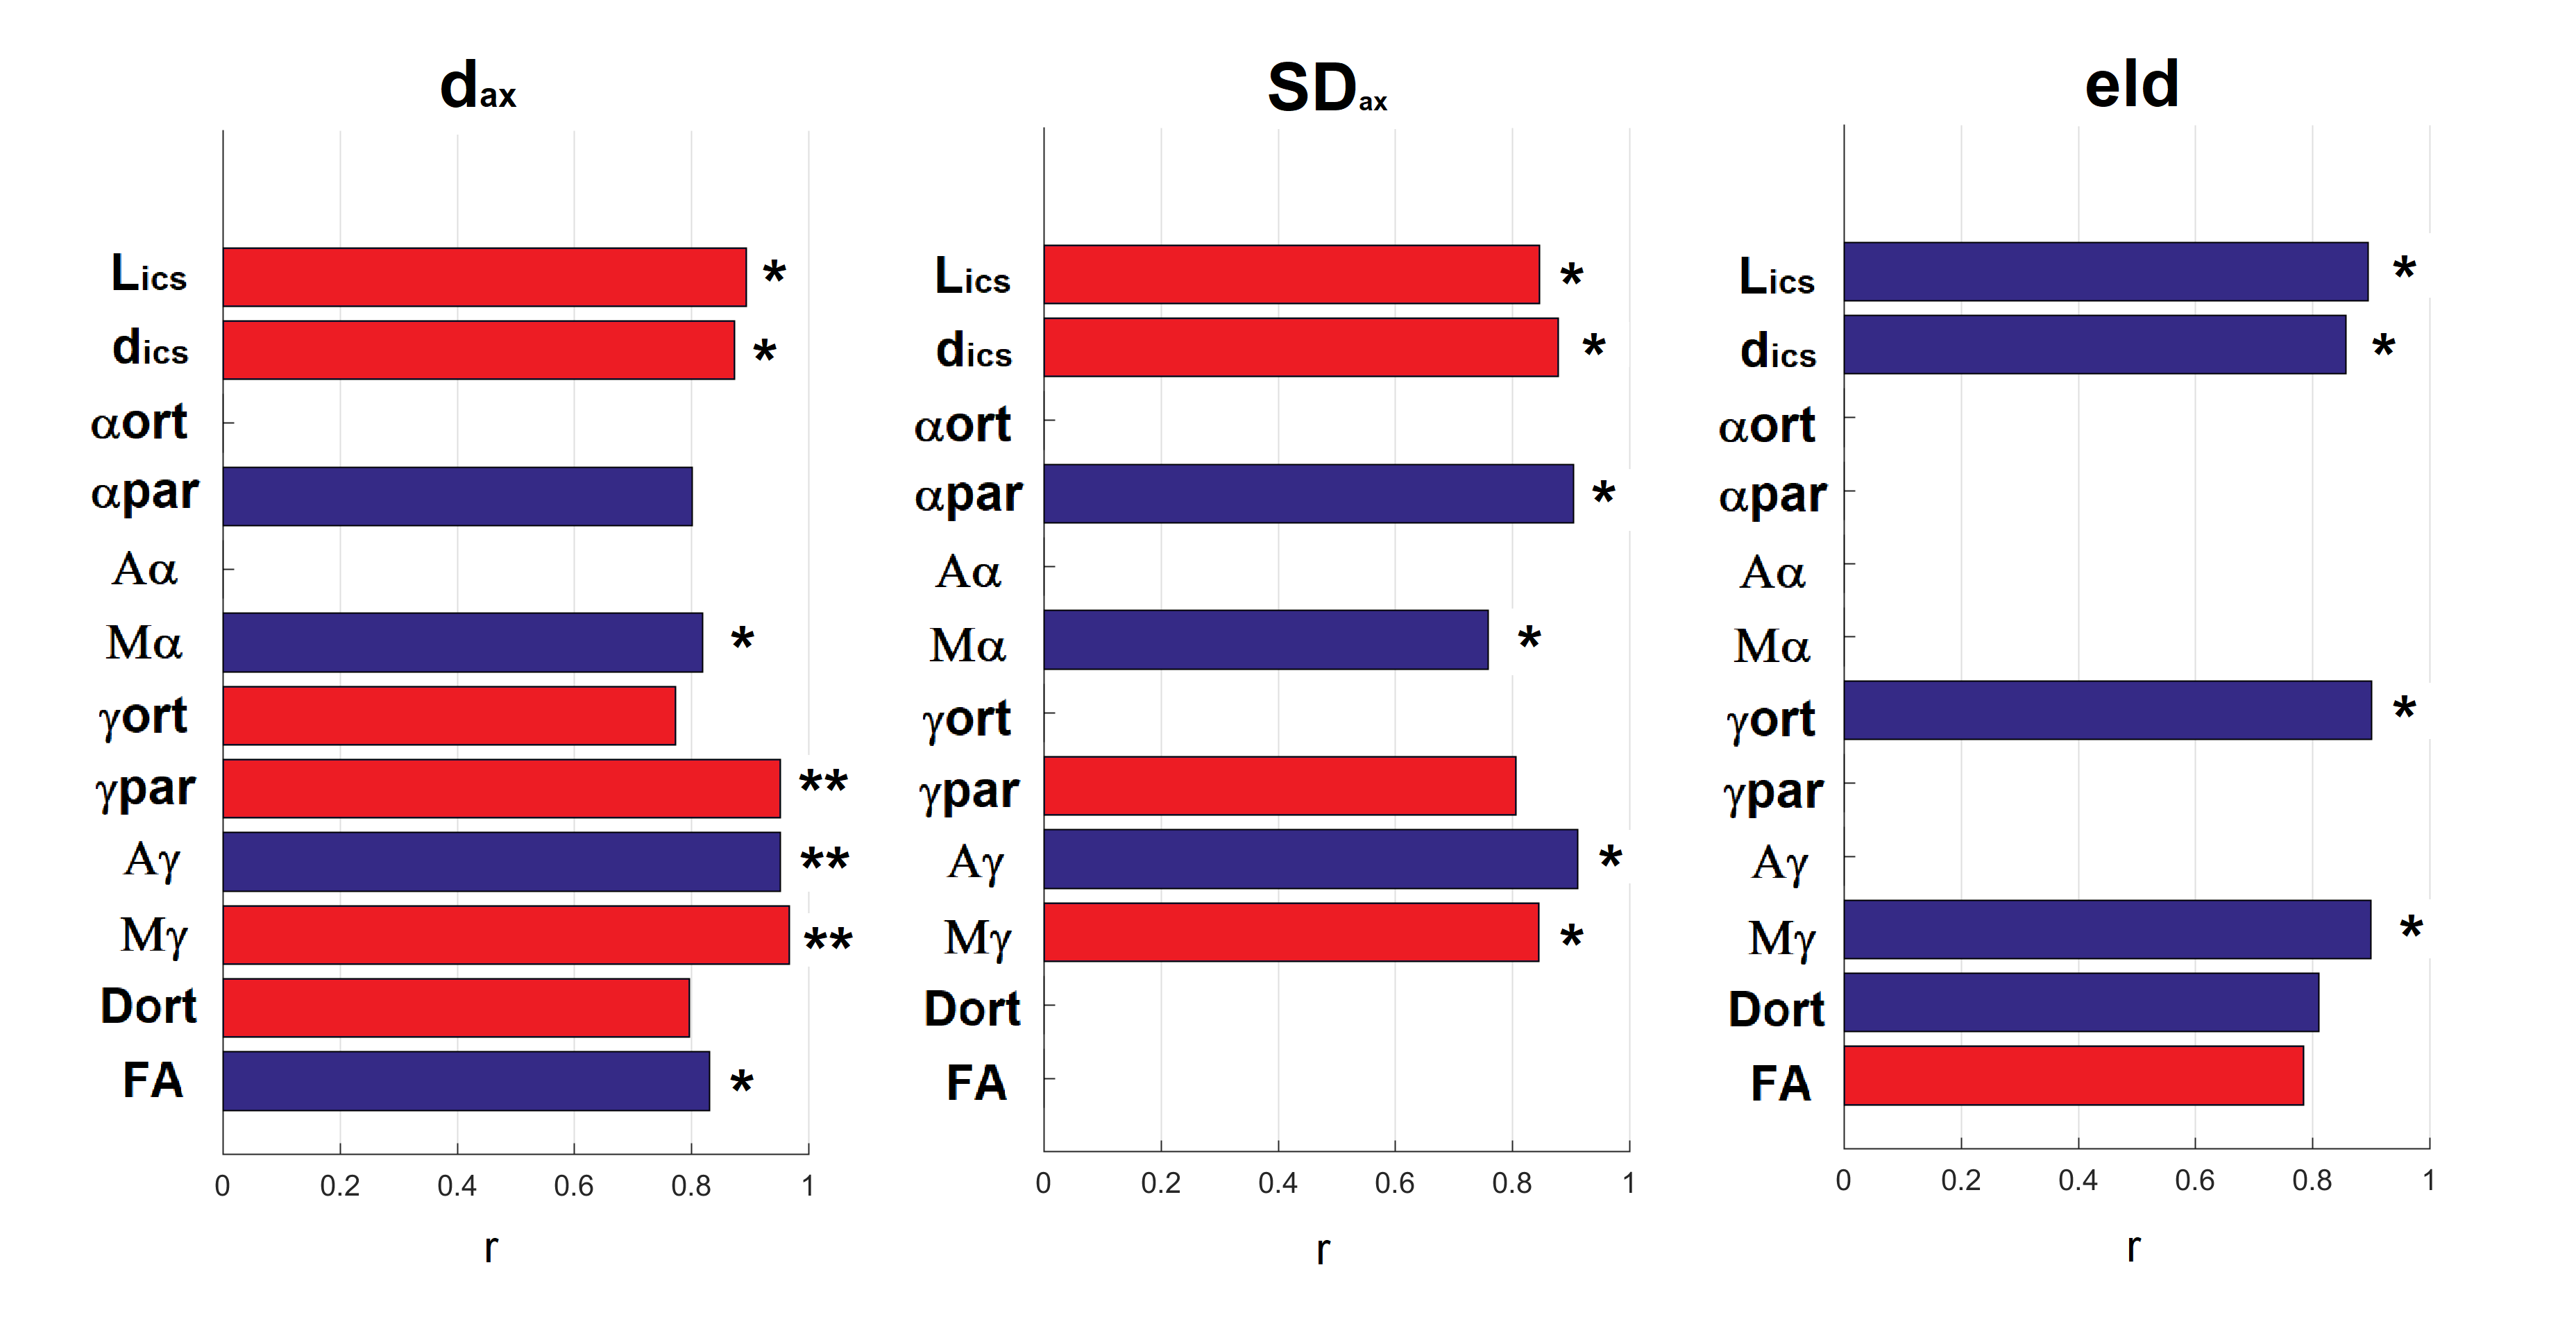
SNR of the denoised images tripled compared to the raw data without significant blurring (Fig. 2). The diffusion-micro-MRI techniques provide different contrasts for MSC-wm (Fig. 3). The morphologic characteristics extracted from histology (Fig. 4) agree well with literature (R2=0.92, P<0.005 for dax; R2=0.71, P<0.05 for SDax; R2=0.73, P<0.05 for eld). The correlations between diffusion-micro-MRI parameters and the morphology are illustrated in Fig. 5: γ-imaging parameters show the strongest associations with dax, SDax and eld. None of DTI parameters were found to correlate significantly with SDax. Among the α-imaging parameters, axial-α considerably decreases with SDax, while radial-γ, as well as QSI-parameters, decrease with eld.Discussion
The increase of Dort, dics and Lics with dax corresponds to literature5,11. γ-imaging parameters increasing with axon diameter could be due to a progressive dispersion of microtubules and neurofilaments inside the axolemma, reducing the spatial variations in magnetic susceptibility encountered by water molecules during their motion. The decrease of axial-α with SDax replicates in vitro and in vivo results3,12, and it could be the effect of a more pronounced structural disorder in the longitudinal direction, due to axonal varicosities12. In distinction to standard axonal density, effective local axon density (eld) is not based on axon count, rather on axon neighborhood, considering axon-free regions10. γ- and QSI-imaging parameters depend on eld, a measure sensitive to aging, as shown in animal studies10. The ability of diffusion-micro-MRI parameters to mirror the morphology of MSC-wm tracts has clinical potential. In fact both physiologic and pathologic wm degradation translates into alterations of wm morphometry and topology10,13.Conclusion
Results reported here provide potentially useful information to elucidate the biophysical meaning of tAD parameters. tAD-micro-MRI and QSI outperform DTI as a means to probe MSC-wm morphology, and have the potential to assess wm tissue integrity.Acknowledgements
AC, GBB and SC thank A. Gabrielli and J.R. Santos for the interesting discussions concerning effective local density.References
[1] Capuani S, Palombo M, Gabrielli A, Orlandi A, Maraviglia B, Pastore FS. Magnetic resonance imaging 2013; 31: 359-365. [2] Caporale A, Palombo M, Macaluso E, Guerreri M, Bozzali M, Capuani S. NeuroImage 2016. [3] Palombo M, Gabrielli A, De Santis S, Cametti C, Ruocco G, Capuani S. The Journal of chemical physics 2011; 135: 034504. [4] Palombo M, Gabrielli A, Servedio V, Ruocco G, Capuani S. Scientific reports 2013; 3. [5] Ong HH, Wehrli FW. Neuroimage 2010; 51: 1360-1366. [6] Ong HH, Wright AC, Wehrli SL, Souza A, Schwartz ED, Hwang SN, et al. Neuroimage 2008; 40: 1619-1632. [7] Veraart J, Novikov DS, Christiaens D, Ades-Aron B, Sijbers J, Fieremans E. NeuroImage 2016; 142: 394-406. [8] Jenkinson M, Beckmann CF, Behrens TE, Woolrich MW, Smith SM. Neuroimage 2012; 62: 782-790. [9] Sommese L, Pagliuca C, Avallone B, Ippolito R, Casamassimi A, Costa V, et al. PloS one 2012; 7: e49653. [10] Comin CH, Santos JR, Corradini D, Morrison W, Curme C, Rosene DL, et al. Scientific reports 2014; 4. [11] Schwartz ED, Cooper ET, Fan Y, Jawad AF, Chin C-L, Nissanov J, et al. Neuroreport 2005; 16: 73-76.[12] Fieremans E, Burcaw LM, Lee H-H, Lemberskiy G, Veraart J, Novikov DS. NeuroImage 2016; 129: 414-427. [13] Lovas G, Szilágyi N, Majtényi K, Palkovits M, Komoly S. Brain 2000; 123: 308-317.
Figures