3221
Critical Choices in ROI Analysis of Diffusion MRI Data1Radiology, University of Gothenburg, Gothenburg, Sweden, 2Radiology, Brigham and Women's Hospital, Boston, MA, United States
Synopsis
Diffusion parameters such as diffusivity, compartment fractions and diffusion signal itself are informative bio-markers in understanding and analyzing pathological changes in biological tissue. One frequently needs to compute a representative value of a diffusion parameter in a homogeneous ROI. Here we compare and contrast 3 common choices that researcher would make in the course ROI analysis. Though ROI analysis is deemed to be a common practice, the critical choices of computational methods (depending on noise distribution and underlying model) can considerably affect its findings and conclusions.
Introduction
Researchers often draw ROIs to evaluate pathological changes in diffusion weighted-images of brain or prostate. In a homogeneous ROI, the first choice is to either do a single fit to averaged signal or to do independent fits for each voxel. The former is referred to as signal averaging (SA). If you choose not to use SA approach, you have to find a way to fuse parameters obtained for each voxel (e.g. for a ROI composed of 20 voxels you obtain 20 different diffusivity values). One would expect the mean-value of the parameter is the best estimate of its true value. Here we show that depending on noise distribution and underlying model one may have better choices (e.g. parameter averaging (PA) could be replaced with parameter median (PM)).Methods
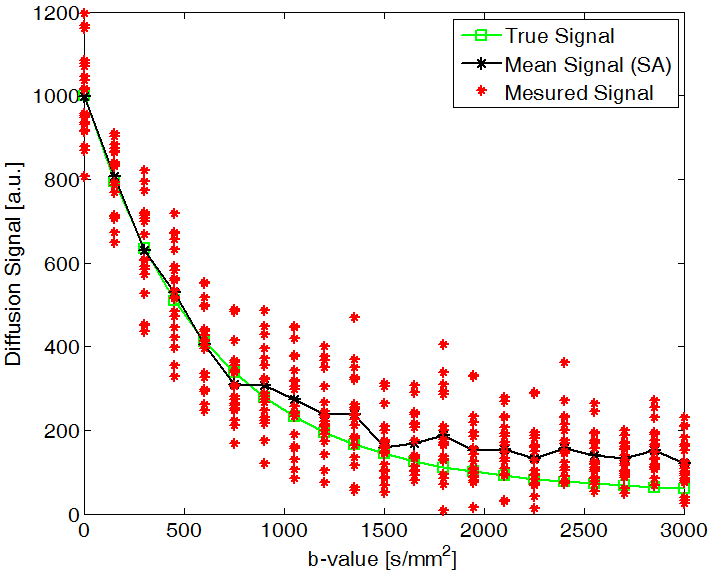
Consider a bi-exponential nature for DWI data as $$S(b)=s_0(f_1exp(-bd_1)+(1-f_1)exp(-bd_2)).$$ Suppose we have a homogeneous (having the same $$$s_0,d_1,f_1,d_2$$$) ROI composed of 20 voxels. True DWI signal, measured signal in different voxels (contaminated by Rician noise, SNR=10) and mean signal (averaged over ROI voxels) are shown in Fig. 1. It can be seen that for high b-values all measured data points are located above the corresponding true value (Rician bias). To determine a parameter using measured data in this ROI, one has two alternatives: 1. to fit the model to averaged signal (black curve in Fig. 1). 2. to do a fit for each voxel that leads to 20 different estimates out of which one can take the mean or the median as a representative value. Thus, in total one will have 23 estimates. These different parameter estimates are illustrated in Fig. 2 for the data given in Fig. 1. The total variability of 23 estimates of each parameter is huge. If we focus only on three indicative estimates i.e. signal average (SA), parameter average (PA) and parameter median (PM), the variability for $$$s_0,d_2,f_1$$$ and $$$d_1$$$ estimates is 4,85,11 and 18 percent respectively (computed as the difference between maximum and minimum of estimates divided by its true value). As it is shown by this example, due to high SNR, $$$s_0$$$ is less affected by our methodological choices.
Here we systematically investigate which choices are suitable for mono-exponential and bi-exponential models when noise distribution varies from Rician to Gaussian and zero-mean Rician. For a given ROI composed of 50 voxels, we always repeat the experiment 10000 times and report the expected value of each parameter.
Results
Figure 3 summarizes the results for mono-exponential model. For Rician noise (first row), all three approaches are equal and under-estimate $$$s_0$$$ and $$$d_1$$$. However, for Gaussian (second row) and zero-mean Rician (third row) distributions the signal averaging (SA) is the best approach.
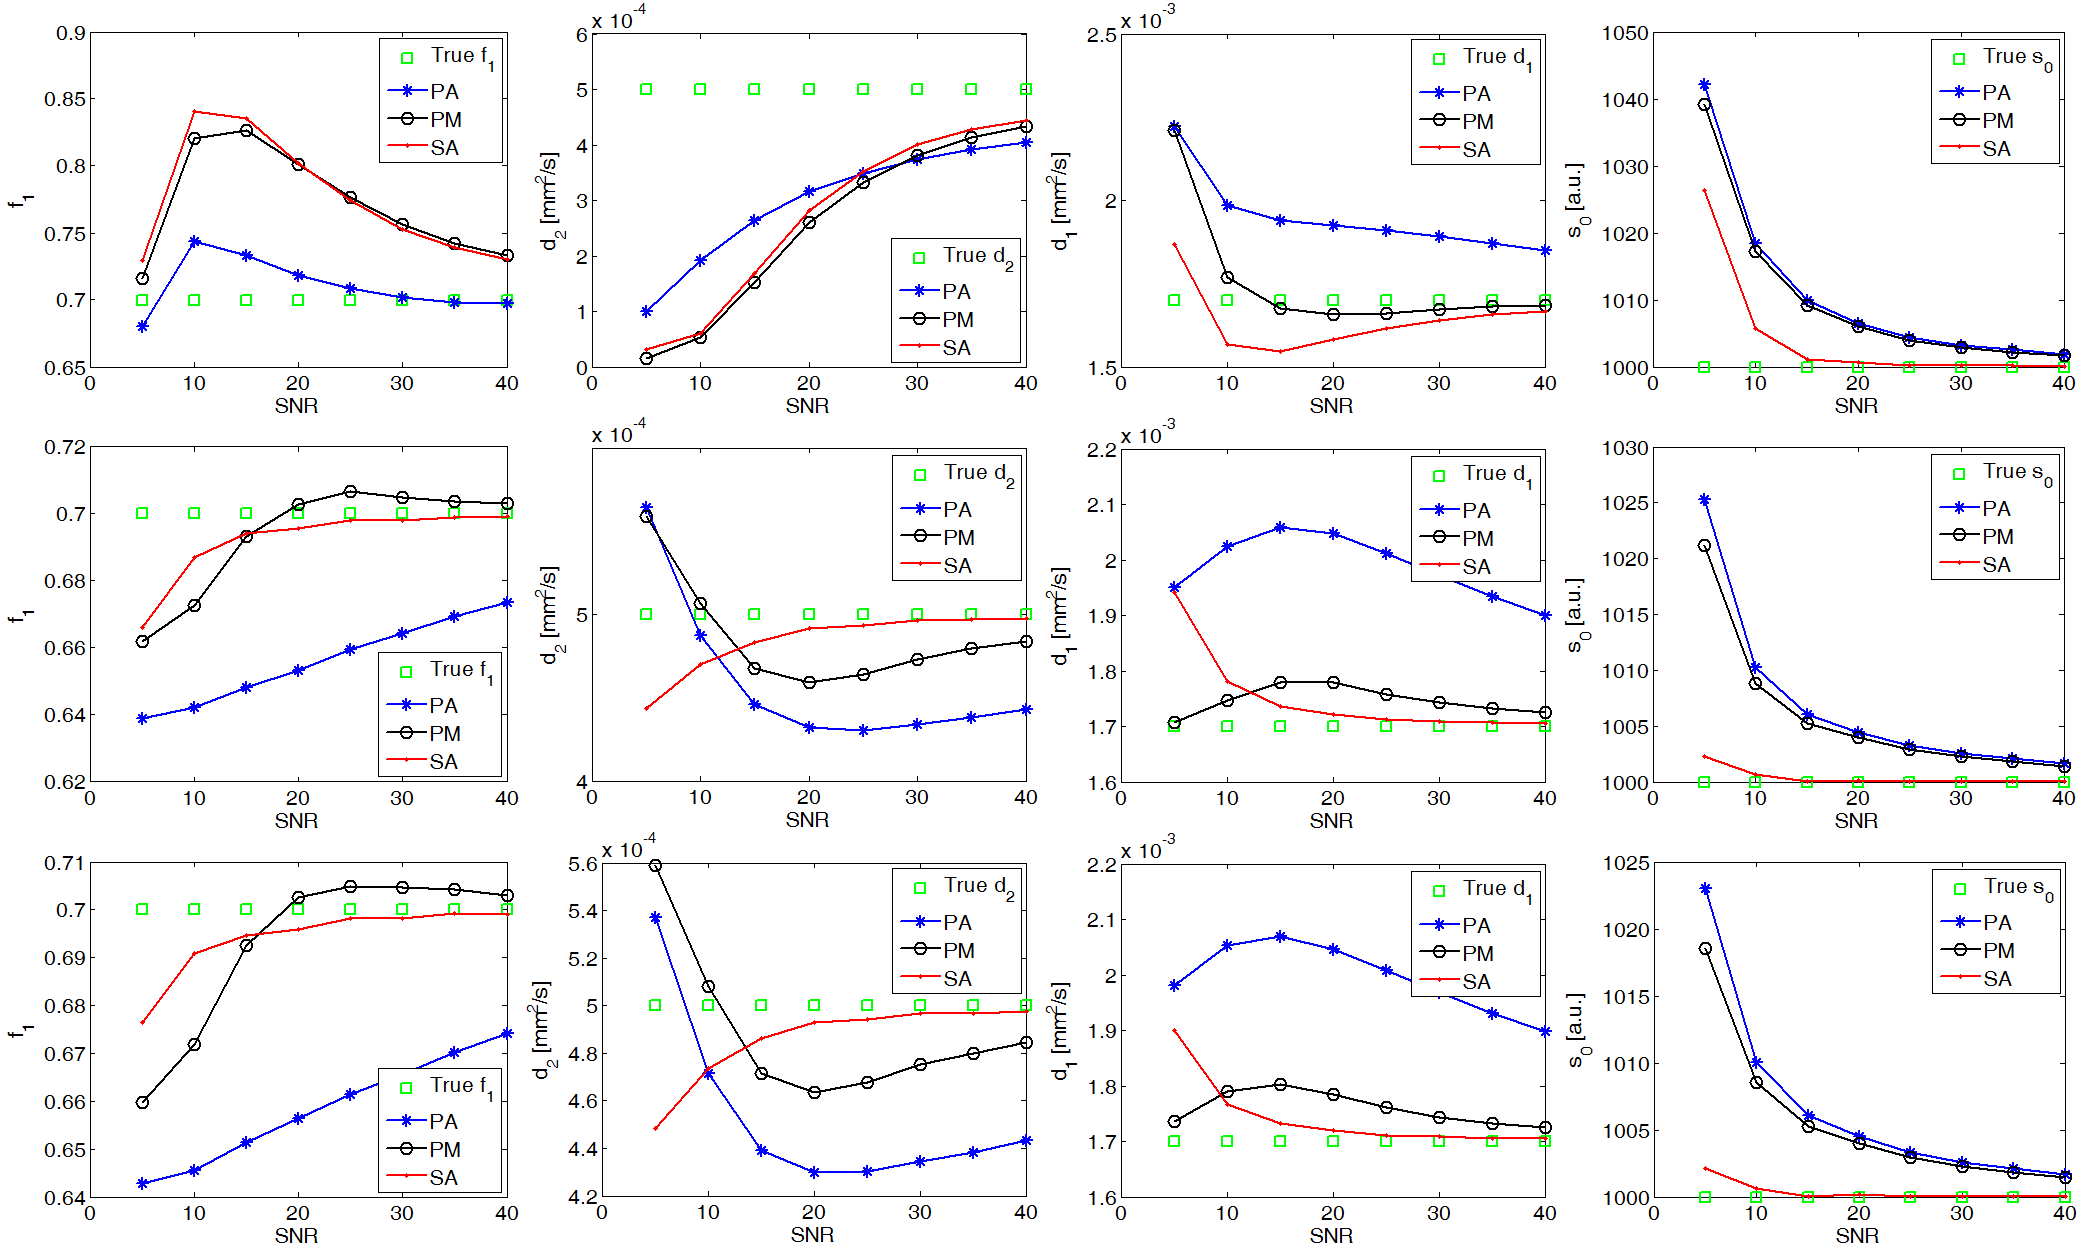
Figure 4 summarizes the results for bi-exponential model. For Rician noise (first row), the best estimator of $$$f_1$$$ and $$$d_2$$$ is PA approach while $$$d_1$$$ is best estimated with PM approach. For Gaussian (second row) and zero-mean Rician (third row) noise distributions, SA is the best estimator for all parameters while PM has a comparable performance.
Discussion
Diffusion MRI data is known to be contaminated by Rician noise. However, different techniques are applied to account for Rician bias [1,2] (leading to zero-mean Rician Noise) or to get access to original Gaussian noise contaminated data [3]. There exist a third type of noise mitigation algorithms with unknown or unexplored effect on noise distribution. Here we showed that regardless of applied estimation approach, mono-exponential model parameters are consistently over-estimated for zero-mean distributions while they are under-estimated in presence of Rician noise. As an indicative example, changing noise distribution from Rician to Gaussian would increase $$$d_1$$$ by 12 percent without any pathological reason (see Fig. 3).
Of particular interest is the variability reduction that zero-mean noise distributions would cause. In both figures 3 and 4, it can bee seen that parameter estimation is more robust for zero-mean noise distributions (second and third rows) compared to Rician noise (the first row).
Conclusion
Overall our study shows that for mono-exponential analysis, regardless of noise distribution, SA approach leads to better parameter estimations. However, in case of bi-exponential analysis SA approach is preferred only for zero-mean noise distributions (even if its skewed). DWI data often comes with Rician noise. In such case bi-exponential analysis is better performed with PA or PM approaches (SA approach can over-estimate contribution fraction of main compartment by 20 percent).
As a rule of thumb, the results are less approach-dependent when working with zero-mean noise distributions. For bi-exponential model and Rician noise signal averaging admits a considerable bias into your calculations.
Acknowledgements
This study was supported in part by ALFGBG-374871 and NIH grant R01 CA160902.References
[1] Hakon Gudbjartsson and Samuel Patz, 'The Rician Distribution of Noisy MRI Data', Magn Reson Med. 1995; 34(6): 910–914.
[2] M. Nezamzadeh, I. Cameron, 'A New Rician Noise Bias Correction', Proc. Intl. Soc. Mag. Reson. Med. 14 (2006).
[3] Douglas E. Prah, Eric S. Paulson, Andrew S. Nencka and Kathleen M. Schmainda, 'A Simple Method for Rectified Noise Floor Suppression:Phase-Corrected Real Data Reconstruction WithApplication to Diffusion-Weighted Imaging', Magnetic Resonance in Medicine 64:418–429 (2010).
Figures