3220
Realistic 3D Fiber Crossing Phantom Models for Monte Carlo Diffusion Simulations1Signal Processing Lab (LTS5), École Polytechnique Fédérale de Lausanne, Lausanne, Switzerland, 2ICTEAM Institute, Université catholique de Louvain., Louvain-la-Neuve, Belgium, 3Signal Processing Lab (LTS5), École Polytechnique Fédérale de Lausanne, Lausanne, Switzerland, Lausanne, Switzerland, 4Radiology Department, Centre Hospitalier Universitaire Vaudois and University of Lausanne, Lausanne, Switzerland, 5Computer Science Department, University of Verona, Verona, Italy
Synopsis
Monte-Carlo Diffusion Simulations has proved to be a powerful approach to study Diffusion-Weighted MRI; from generating ground-truth data, to study the diffusion process in complex media. However, a major problem with the current approaches is that they oversimplify the geometrical properties of the diffusion media. In this work we present a framework to create 3D meshes for realistic configurations that can be used for MCDS. The synthesized signals from this models can be used to study microstructure and tractography methods, which is of vital importance since novel methods require better ground-truth that mimics real tissue properties to avoid oversimplifications.
Introduction and Motivation
Monte Carlo Diffusion Simulations (MCDS) has proved to be a powerful approach to study Diffusion-Weighted Magnetic Resonance Imaging (DW-MRI); from generating ground-truth data, to study the diffusion process in complex media. However, a major problem with this approach is that the intricate geometrical properties of the diffusion media is usually oversimplified by representing the tissue geometry with simplistic shapes, as cylinders or straight planes2,3. This is a major limitation since MCDS are usually used as ground-truth, or even for dictionary learning4. Therefore, if the aforementioned geometries are not close to the in-vivo reality, they can lead to biased methods that are unfit in real tissue and, at the same time, misuse the flexibility and potential of such simulations.
This study was exploratory and interpretative in nature and presents a general framework to create realistic fiber crossings configurations, that later can be used as 3D models for MCDS. The resulting simulated signals coming from this models showed compelling results that can be straightforwardly used for the study of tissue microstructure and even scaled for tractography methods, providing a much richer environment to evaluate and test such techniques. This is especially important since novel methods require ground-truth that mimics the actual tissue properties to avoid oversimplifications and biased results.
Methods
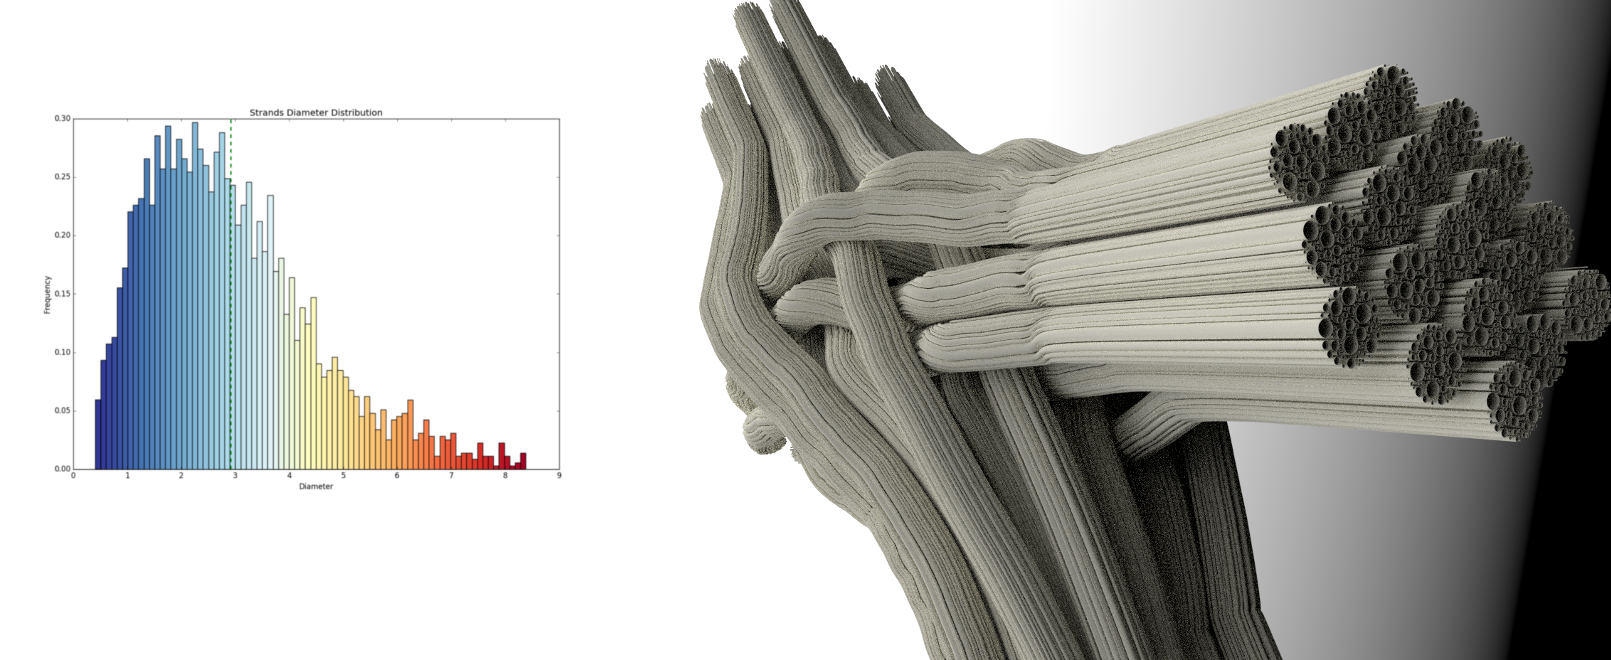
This study is a tailored extension from the work presented by Close et al.1, where an objective cost function $$$J_0 = \sum\limits_{i,k,n}\sum\limits_{l,j,m!=n} h(z_{k,i}^{(n)},z_{l,j}^{(m)}) $$$1 that takes a set of parametrized curves with a fixed radius, and penalizes the overlap, curvature and length of the set of initial strands, is optimized. The resulting strands can be subsampled in regular shapes and used to place an analytical response function, which should account for all the microstructural and directional properties in that particular position, as well as any other diffusion compartment. In this work we propose to explicitly construct the microstructure properties inside the base strands in order to mimic tissue properties, as for instance: a given radii distribution, changes in the axonal radius, etc. For this aim, we subdivided each strand in a collection of individual axon geometries, following a gamma distribution of inner diameters (Figure$$$\,$$$2), and re-optimized the resulting configuration to avoid intersecting errors.
3D mesh construction and DW$$$\,$$$signal simulation.
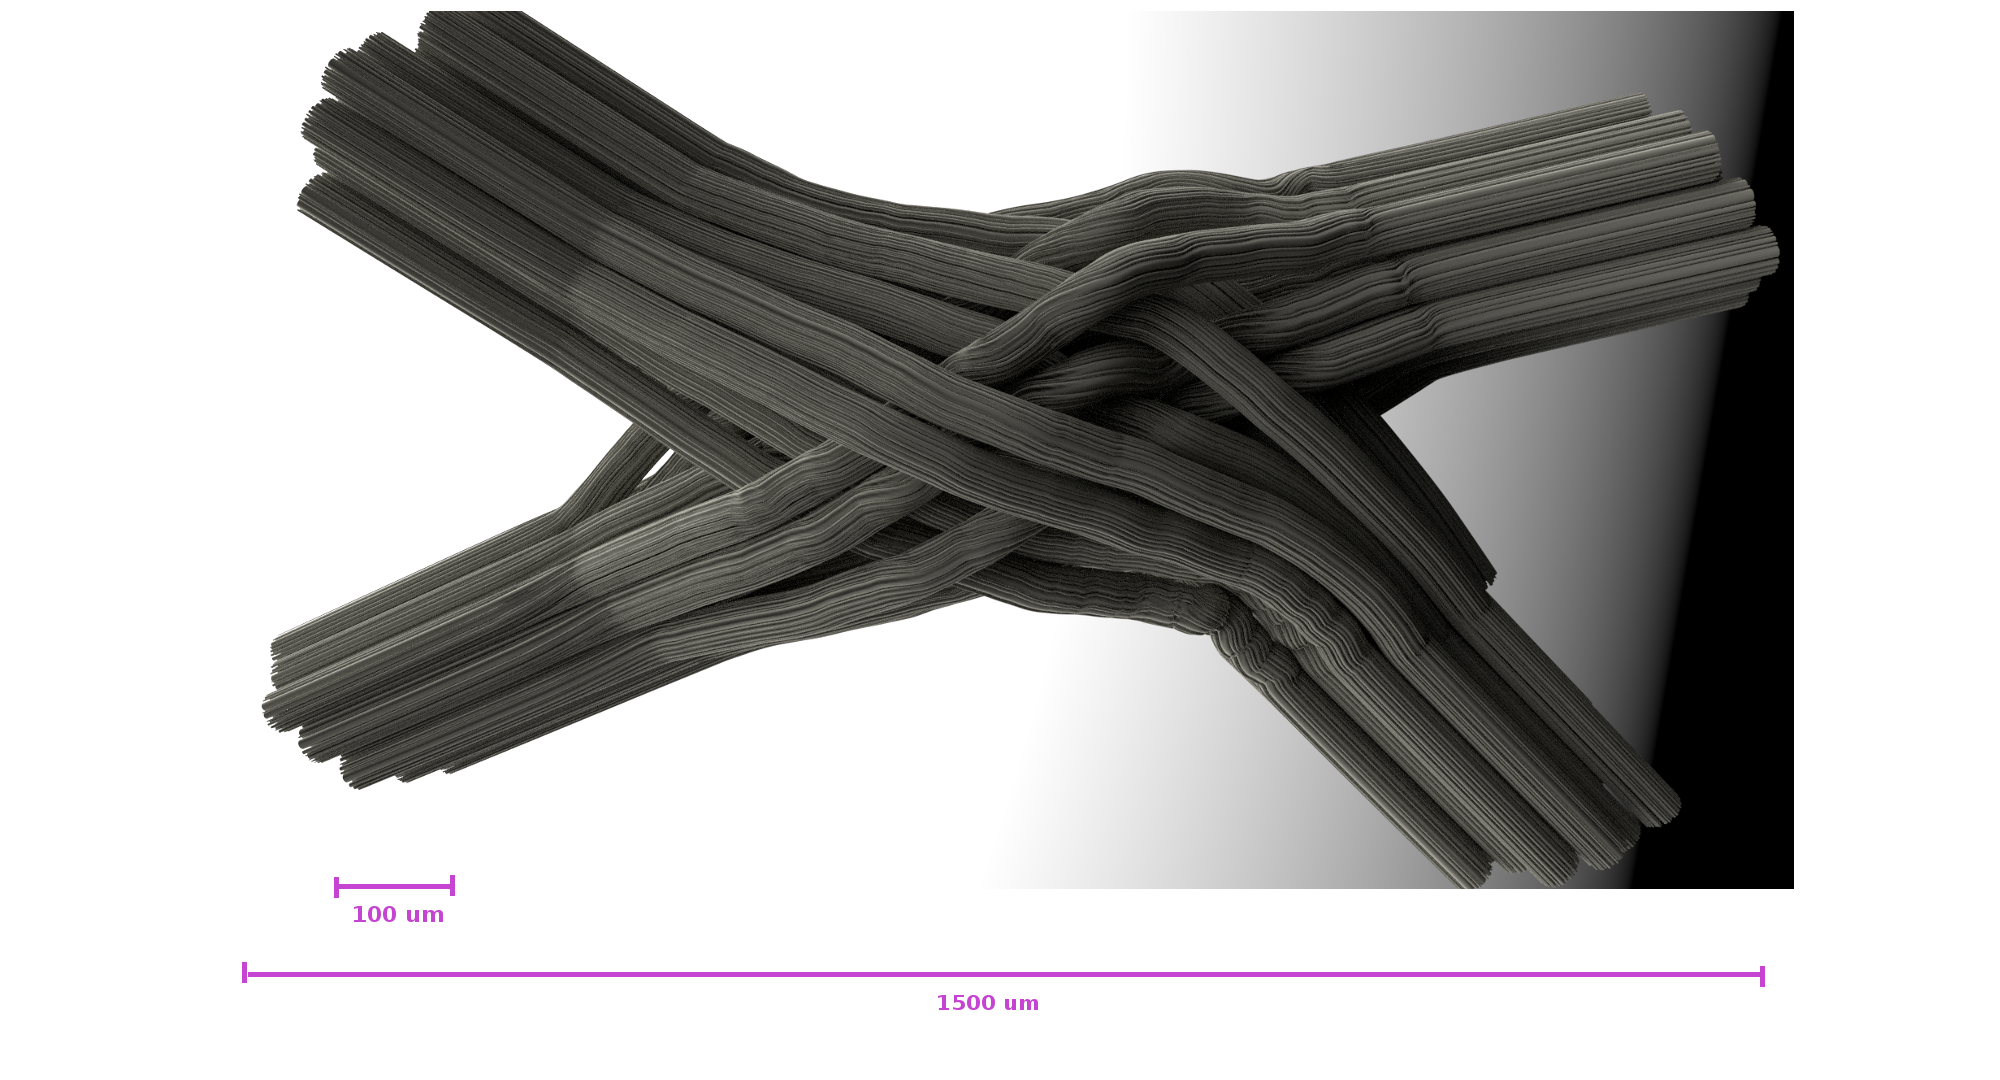
The final 3D configuration was then triangulated using a in-house software for meshing by deformation of base cylindrical shapes. The dimensions of the resulting 3D model can be seen in Figure$$$\,$$$1 which are near the scale of realistic diffusion voxels sizes in DW-MRI. Finally, the resulting signal was computed using an in-house Monte Carlo Simulator, for a total of 12,288 voxels (Figure$$$\,$$$3), which can be used as interdependent simulations for micro-structure or tractography in different resolutions.
Results and discussion
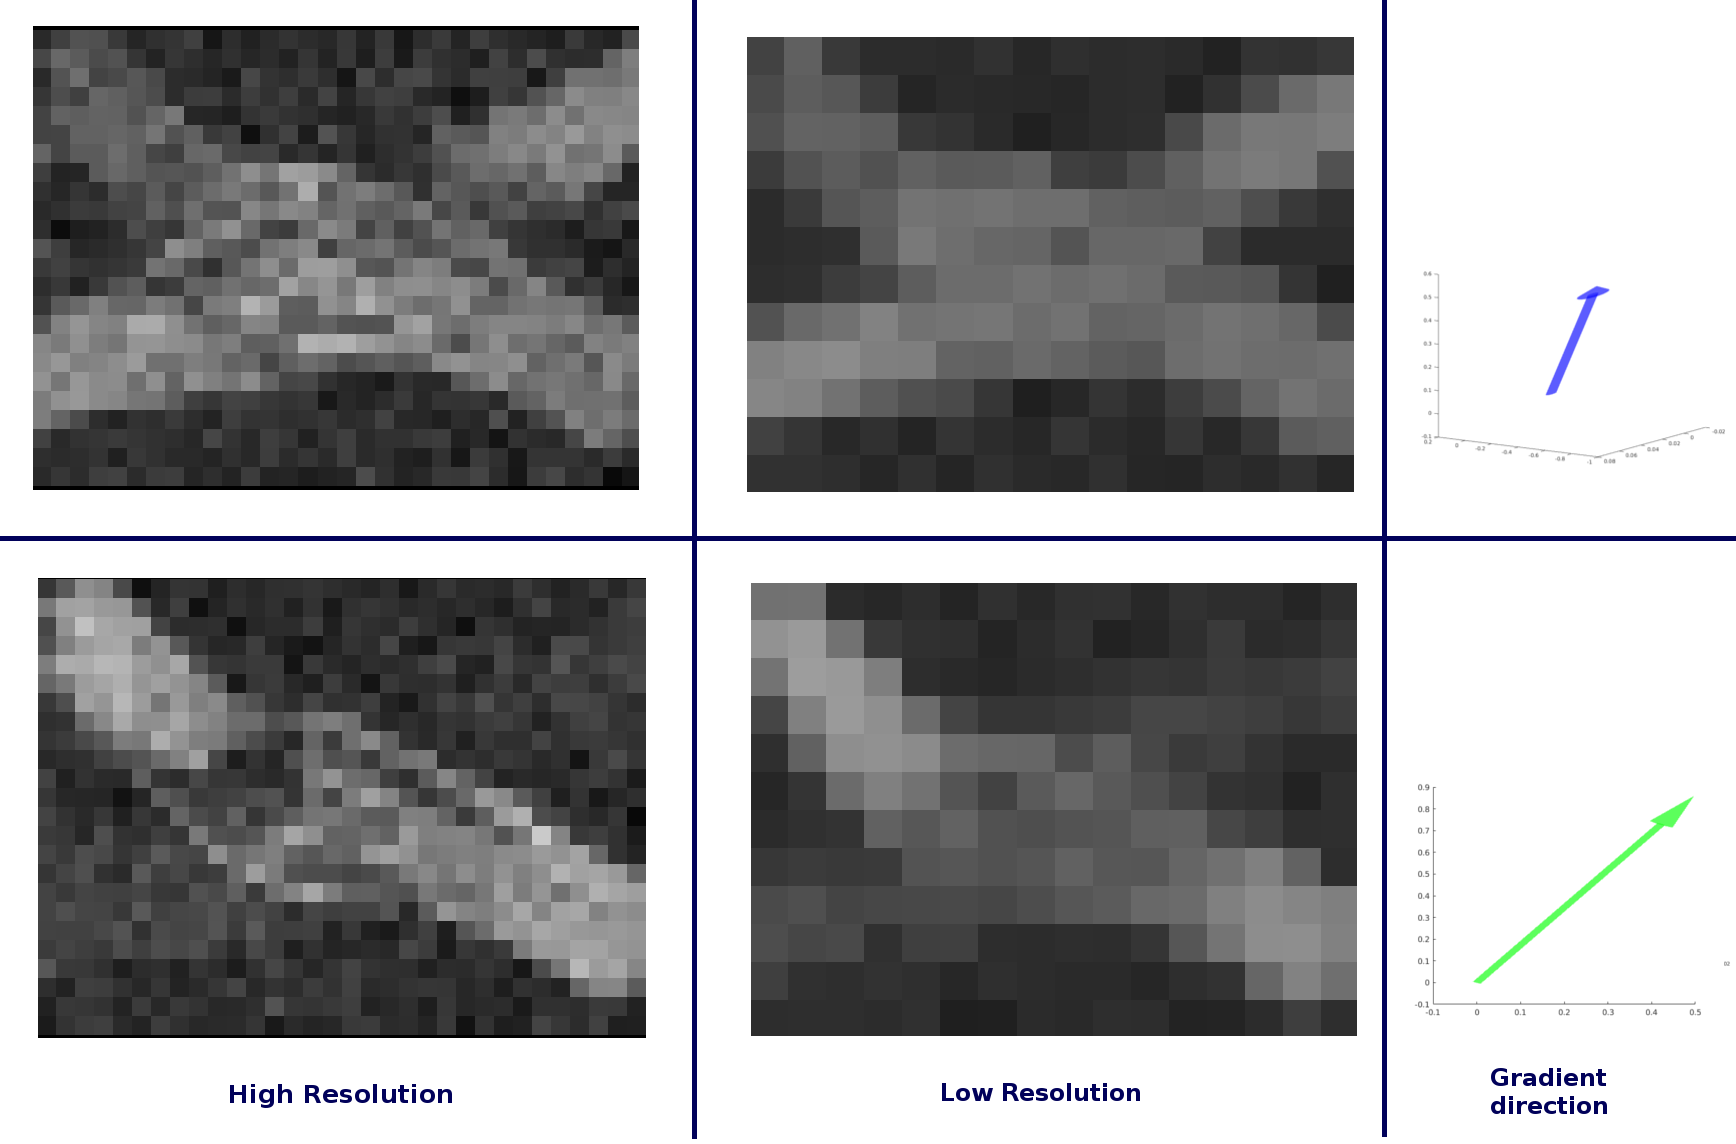
The resulting synthesized signal (Figure$$$\,$$$3) showed stimulating results in different scales. Local diffusivity changes as well as signal alterations related with the curvature of the individual axons can be observed. Is important to notice the effect of the scale in the measured signals, since the presence of different diffusion compartments are more likely to appear in lower resolution.
The extracellular space
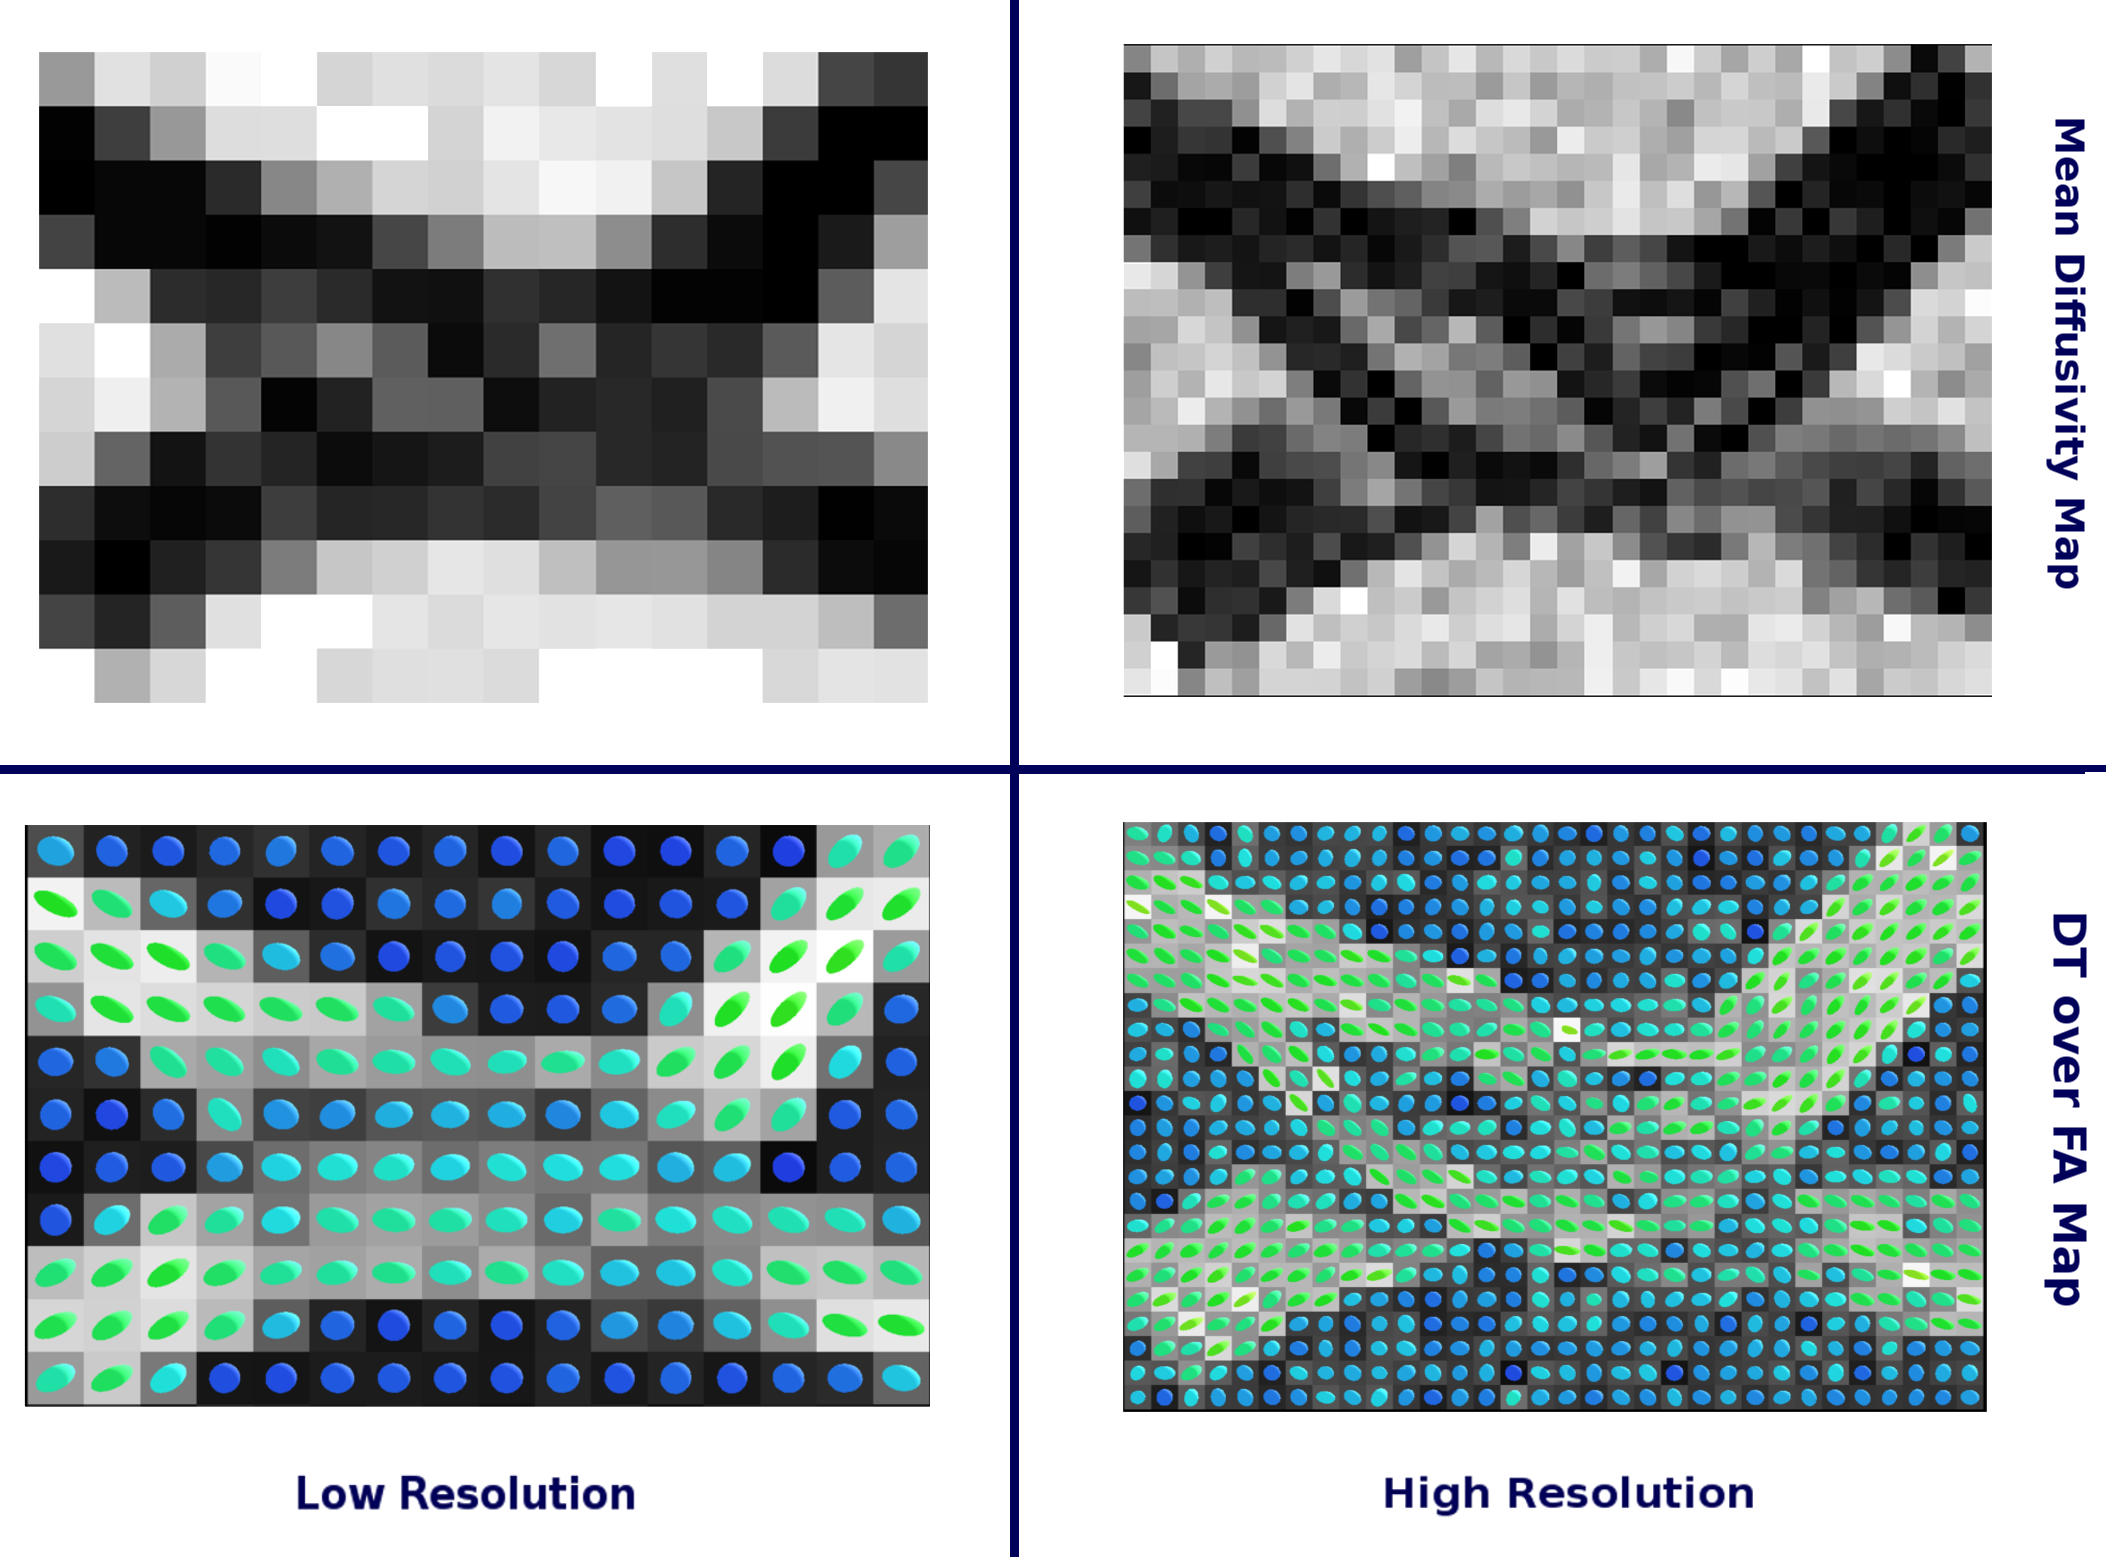
Taken all together the resulting geometry is considerably different from a naive numerical phantom. For instance, the extracellular space in the crossing area will be remarkable different from a crossing of cylindrical shapes8; since the relation between axon density, volume, and the no-overlapping attribute in the crossing zone, have to be preserved. The results is an “abutting” phenomena in the crossing area which manifests in a relative change in the extracellular space geometry and diffusivity. Figure$$$\,$$$4 shows that such local changes are visible in the mean diffusivity as well as in the high resolution FA and DT maps.
Tractography results
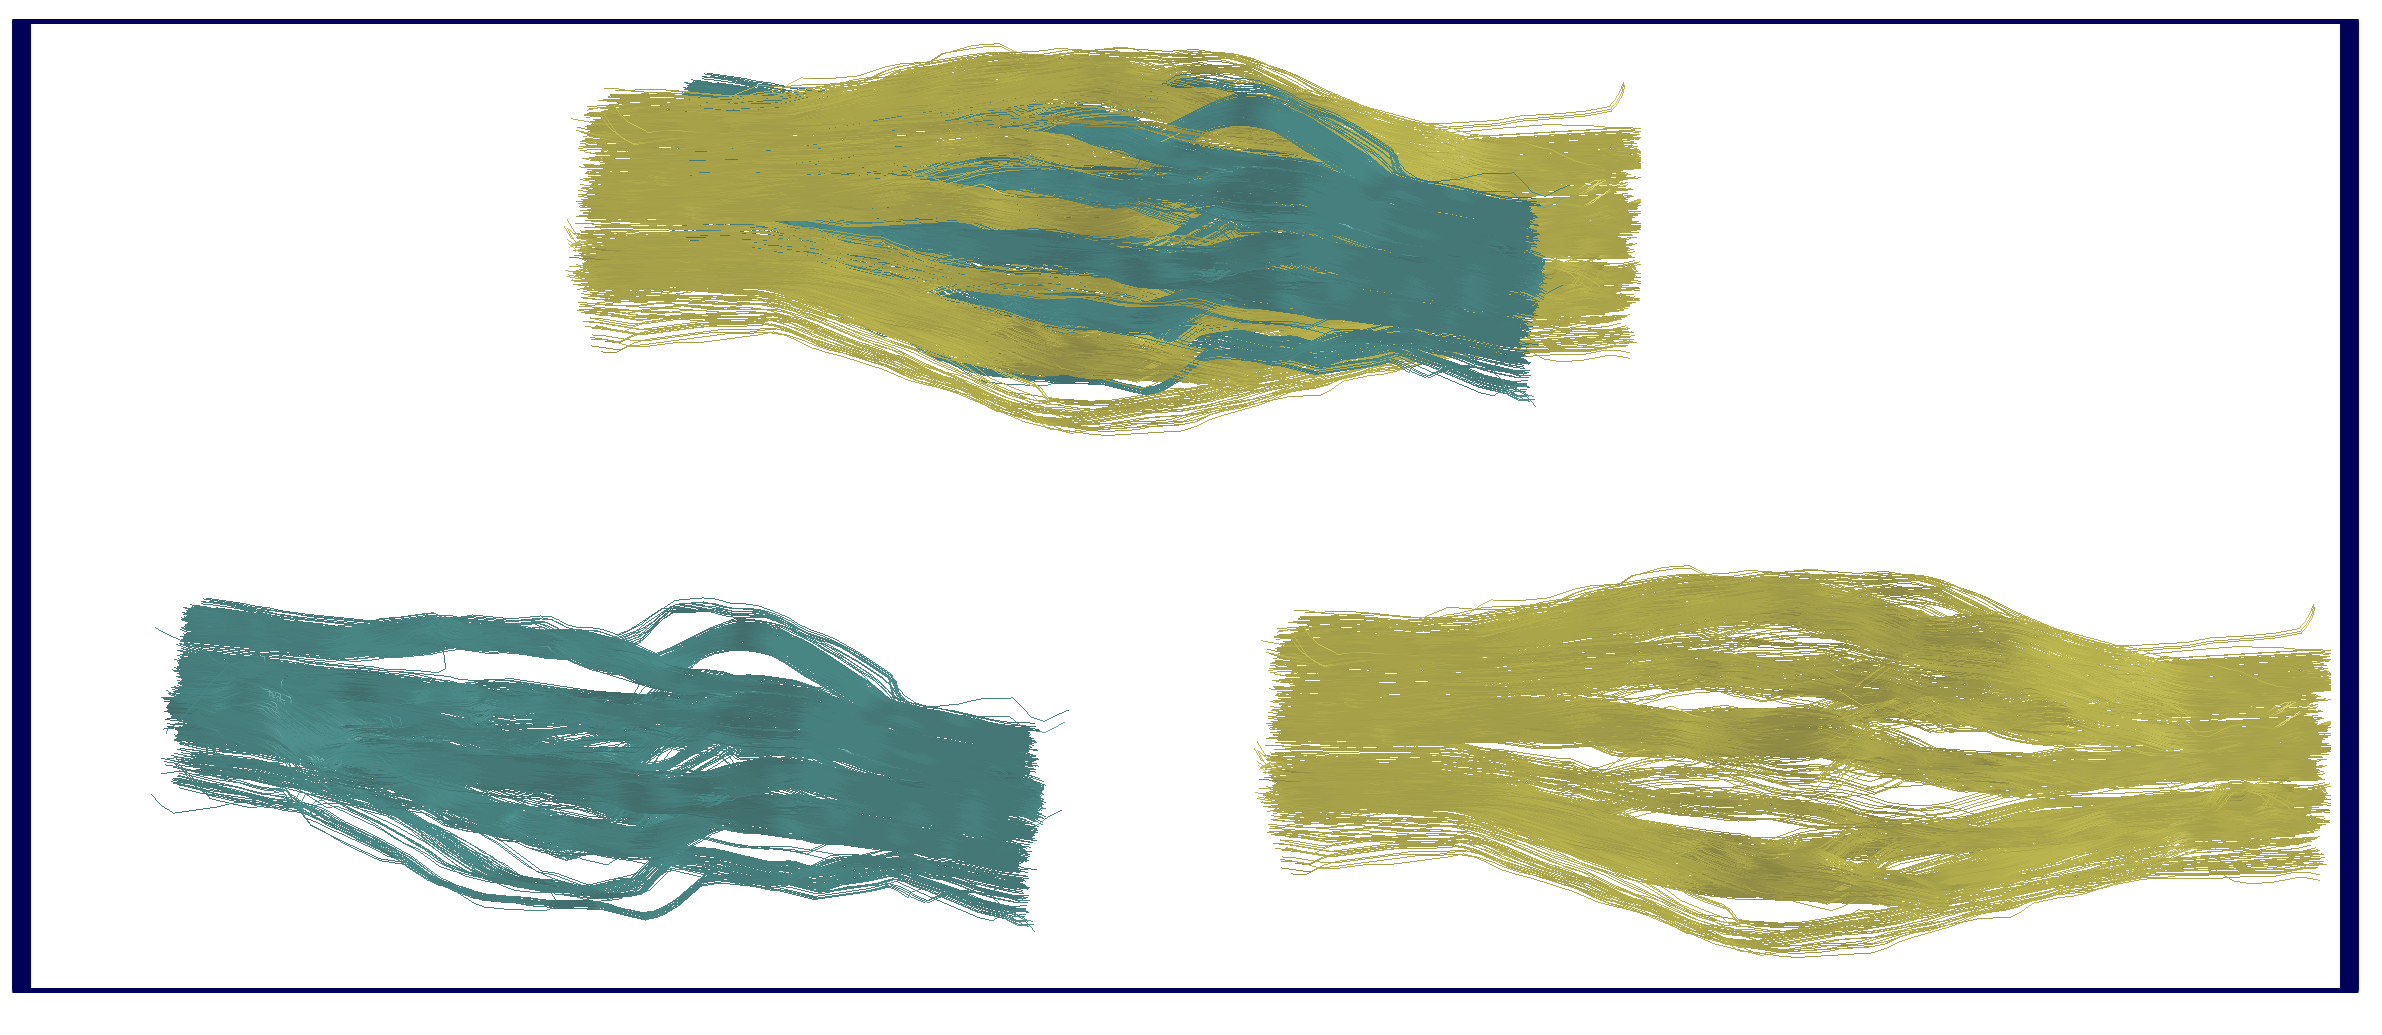
Diffusion Tensor estimation and corresponding fractional anisotropy and mean diffusivity maps were computed using Dipy6 (Figure$$$\,$$$4). Constrained spherical deconvolution5,6 was performed to obtain the fiber Orientation Distribution Functions (fODF). The latter were then used to reconstruct the two bundles using deterministic tractography6. Figure$$$\,$$$5 shows the reconstructed pathways of the two bundles.
Conclusions
The present project was undertaken to design a general framework to
construct realistic 3D geometries that extend the simplistic
cylindrical models used to generate crossings substrates. In addition an
evaluation of the new information that can be recovered from the diffusion
signal using such geometries was perform. Despite its exploratory nature, this work offers some insight into the
interesting properties that can be modeled and used in Monte-Carlo
Simulations, such as: changes on the fiber density, local dispersion,
and changes in the extracellular space. A number of possible future studies using the same
experimental setup are apparent such as: comparison of non trivial
microstructure models, tractography algorithms, as well as quality
transfer models7.
Acknowledgements
This project was partially funded by the Swiss National Foundation.References
1. Close, T. G., Tournier, J.-D., Calamante, F., Johnston, L. a., Mareels, I., Con-nelly. A software tool to generate simulated white matter structures for the assessment of fibre-tracking algorithms. NeuroImage 47 (2009) 1288–1300
2. Matt G. Hall and Daniel C. Alexander. (2019) Convergence and Parameter Choice for Monte-Carlo Simulations of Diffusion MRI. IEEE Transaction on Medical Imaging, VOL. 28, NO. 9
3. Dmitry S. Novikov, Els Fieremans , Jens H. Jensen and Joseph A. Helpern. (2011). Random walks with barriers. Nature Physics, Vol 7, June 2011.
4. Rensonnet, G., Scherrer, B., Warfield, S. K., Macq, B. and Taquet, M., 2017, April. Microstructure imaging from a dictionary of Monte Carlo signals: assessment on a rat model of Wallerian degeneration. In 25th annual meeting of the International Society for Magnetic Resonance in Medicine (ISMRM)
5. Tournier, J.-D., Calamante, F., and Connelly, A. (2007). Robust determination of the fibre orientation distribution in diffusion MRI: non-negativity constrained super-resolved spherical deconvolution. NeuroImage, 35(4):1459–1472.
6. Garyfallidis, E., Brett, M., Amirbekian, B., Rokem, A., Van Der Walt, S., Descoteaux, M., and Nimmo-Smith, I. (2014). Dipy, a library for the analysis of diffusion MRI data. Frontiers in Neuroinformatics, 8.
7. D C Alexander, D Zikic, A Ghosh, R Tanno, V Wottschel, J Zhang, E Kaden, T B Dyrby, S N Sotiropoulos, H Zhang, A Criminisi. (2017). Image quality transfer and applications in diffusion MRI, NeuroImage Volume 152, Pages 283-298.
8. Caruyer, E., Daducci, A., Descoteaux, M., Houde, J.-c., Thiran, J.-p., and Verma, R. (2014). Phantomas: a flexible software library to simulate diffusion MR phantoms. In International Symposium on Magnetic Resonance in Medicine (ISMRM’14)), Milan, Italy
Figures