3219
How do current diffusion-based MR methods reflect hypomyelination – comparison of diffusion tensor, neurite orientation dispersion and density, and diffusion kurtosis imaging1Functional Imaging Laboratory, German Primate Center, Göttingen, Germany, 2Department of Neurogenetics, Max Planck Institute for Experimental Medicine, Göttingen, Germany
Synopsis
Diffusion-based MRI comprises an exciting toolset to analyze tissue microstructures under normal and pathological conditions. Among numerous diffusion-based methods compared, all reflected the differences in myelination in a mouse model expressing only reduced levels of the myelin basic protein. However, diffusion tensor was more robust than diffusion kurtosis imaging. Intra-neurite volumes, as revealed by neurite orientation dispersion and density imaging or by the spherical mean technique, were not specific for the numbers of axons but were also affected by
Introduction
Diffusion based MRI (dMRI) has been successfully used to visualize neuronal fibers tracts and to analyse white matter microstructures. How well different methods reflect alteration of myelin is, however, an ongoing debate. Particularly under pathological conditions, when axonal damage, demyelination, and cellular infiltration may influence the diffusion-weighted signal in different and even opposing ways, the interpretation of findings has turned out to be difficult.
In order to compare current dMRI techniques we took advantage of a mouse model expressing only reduced levels of the myelin basic protein (MBP). These mice, exhibiting hypomyelination as the dominating phenotype, have been analyzed by diffusion tensor imaging (DTI), neurite orientation dispersion and density imaging (NODDI), spherical mean technique (SMT), and diffusion kurtosis imaging (DKI). For comparison, maps of myelin water fraction, as a non-diffusion based MR method to image myelin, have been obtained.
Methods
Mice: Adult wild-type (WT, n=5) and MBP hypomorphic (MT, n=5) mice were sacrificed and transcardially perfused with phosphate buffered saline and paraformaldehyde (PFA). Subsequently, the brains were prepared and stored in 4% PFA.
MRI: MR-measurements of the isolated brains were performed at 9.4 T (Bruker Biospin, Germany) using a four-channel surface coil for signal detection. Diffusion-weighted images were acquired with a diffusion weighted spin echo sequence using b-values of 3000 and 6000 s/mm2, 30 directions, gradient duration/separation 4/15ms, TE/TR=25/2000 ms, spatial resolution=125×125×500 µm3, FOV=16×16 mm2, 6 signal averages, and total scan time of 27 hr. For myelin water fraction (MWF), a 3D multi-slice multi-echo (MSME) sequence was used (TE/TR=6/4000 ms, 32 evenly spaced echoes, echo spacing 6 ms, resolution=125×125×500 µm3, FOV=16×16 mm2, 4 signal averages, total scan time of 35 min).
Data analysis: Diffusion weighted images were denoised, and corrected for eddy current and motion distortions using MATLAB and FSL tools. All diffusion weighted images were registered to mean b0 images using FSL FLIRT1 rigid body registration. DTI, DKI2, NODDI3, and SMT4, parameter maps were calculated using publicly available software tools and in-house MATLAB routines. Maps of MWF were calculated using the multi-exponential relaxation analysis toolbox5, and for each voxel, the sum of signals with T2 < 35 ms relative to total signal was defined as the MWF. Regions of interests (ROIs) including the mid corpus callosum (midcc), cortex and fimbria were drawn manually on the fractional anisotropy map of each mouse brain using ITK-SNAP.
Results and Discussion
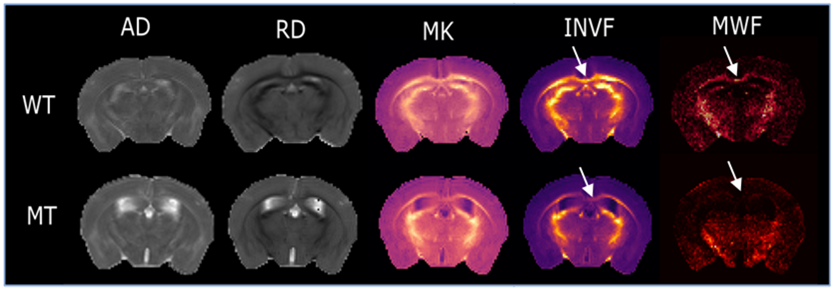
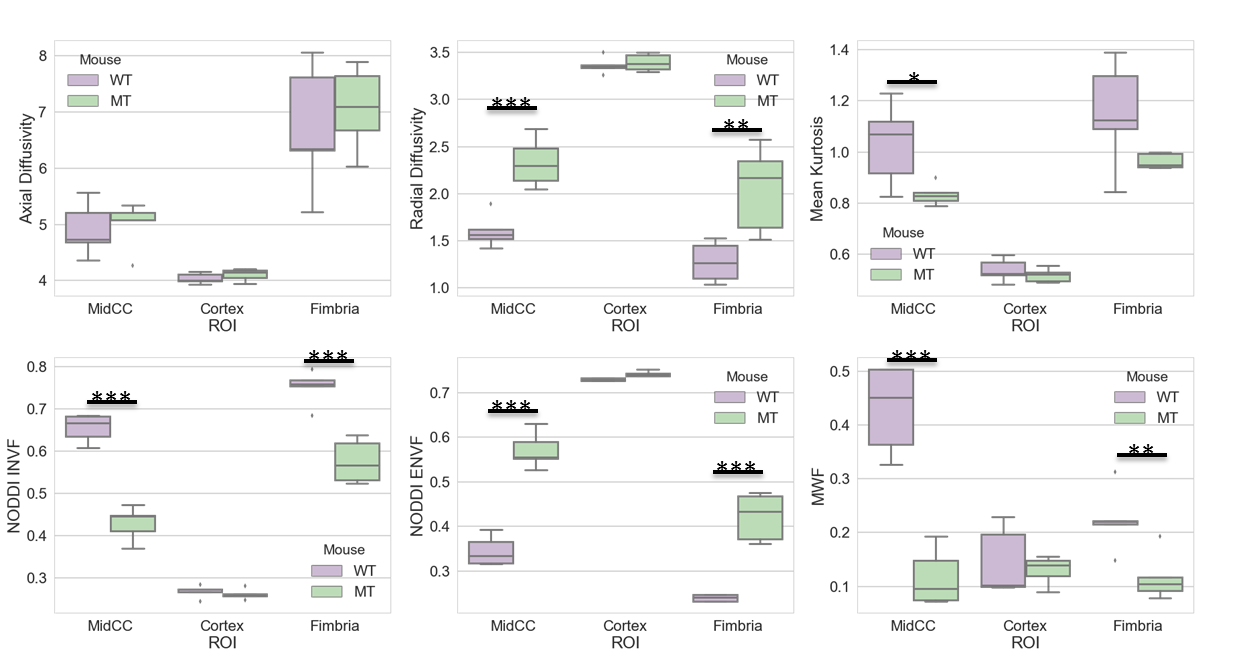
All applied dMRI methods revealed significant differences between WT and MT – although to a different extent. In both white matter structures (midcc and fimbria) DTI showed a significant increase in radial diffusivity (RD) and a reduction in fractional anisotropy in MT compared to WT whereas no differences in axial diffusivity (AD) could be observed. This was in-line with histology confirming hypomyelination and nearly no axonal damage or signs of inflammation. Correspondingly, DKI revealed a reduction of mean kurtosis (MK) and radial kurtosis in MT whereas axial kurtosis was unchanged. Interestingly, differences of MK in the fimbria did not reach significance. NODDI and SMT showed a reduction of the intra-neurite volume fraction (INVF) and a corresponding increase in the extra-neurite volume fraction (ENVF) in both white matter structures of MT. Since NODDI and SMT did not include myelin as a compartment, distinction between axonal damage and myelin loss could not be made. No significant differences between WT and MT were observed by any of the dMRI methods in the cortex of the brain. For comparison, maps of MWF showed significantly reduced values in both white matter structure of MT but not in the cortex.Conclusion
All applied dMRI methods were sensitive enough to reveal differences between WT and MT. At least in that mice model DTI seems to be, however, more robust compared to DKI. Intra-neurite volume as revealed by NODDI and SMT was not specific for the numbers of axons (as the name may suggest) but was also affected by differences in myelination.Acknowledgements
This work was supported by Physics-to-Medicine Initiative, Göttingen, Germany.References
1. Jenkinson, Mark et al. Improved Optimization for the Robust and Accurate Linear Registration and Motion Correction of Brain Images. NeuroImage2002; doi.org/10.1006/nimg.2002.1132.
2. Garyfallidis, Eleftherios et al. Dipy, a library for the analysis of diffusion MRI data. Frontiers in Neuroinformatics 2014; DOI: 10.3389/fninf.2014.00008.
3. Zhang, Hui, et al. NODDI: practical in vivo neurite orientation dispersion and density imaging of the human brain. NeuroImage 2012; DOI: 10.1016/j.neuroimage.2012.03.072.
4. Kaden, Enrico, et al. Multi-compartment microscopic diffusion imaging. NeuroImage 2016; DOI: 10.1016/j.neuroimage.2016.06.002.
5. Does, Mark D. http://www.vuiis.vanderbilt.edu/~doesmd/MERA/MERA_Toolbox.html
Figures