3217
Assessment of the Specificity and Sensitivity of DTI Metrics for Evaluation and Diagnosis in Degenerative Cervical Myelopathy1Center for Biomedical Imaging Research, Department of Biomedical Engineering, School of Medicine, Tsinghua University, Beijing, China, 2Department of Spine Surgery, Beijing Jishuitan Hospital, Beijing, China, 3Department of Radiology, Beijing Jishuitan Hospital, Beijing, China
Synopsis
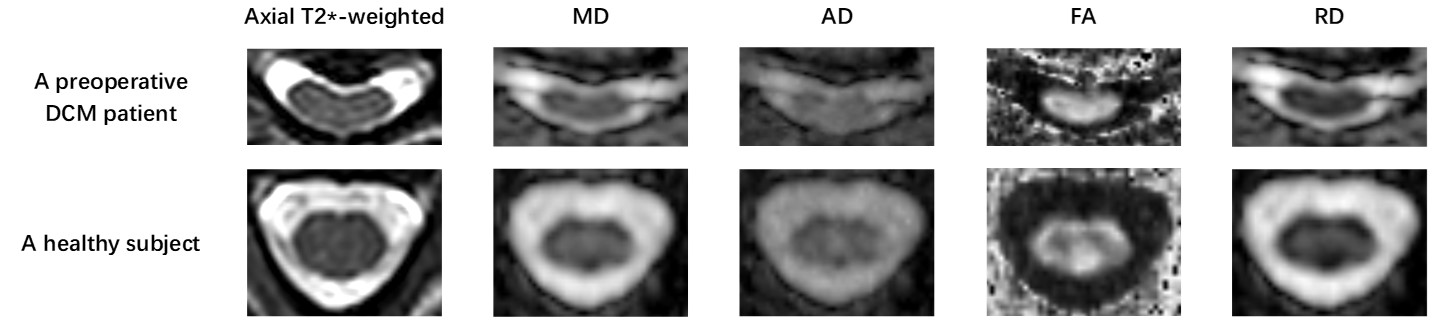
Diffusion Tensor Imaging (DTI) can detect diffusion information of water molecules, and is used to diagnose the severity of degenerative cervical myelopathy (DCM). However, the diagnostic capability of DTI metrics is not fully investigated. In this study, DTI metrics are employed to evaluate the spinal cord function in preoperative DCM patients and healthy volunteers. Nonparametric t-test results show that MD, FA and RD have significant differences between patients and healthy volunteers. In addition, ROC results indicate that FA has higher sensitivity, RD has higher specificity for evaluation and diagnosis in DCM.
Introduction
Degenerative cervical myelopathy (DCM) is one of the major causes of spinal cord dysfunction. Diffusion Tensor Imaging (DTI) parameters can describe diffusion of water molecules at a microcosmic scale. It has been used for clinical evaluation of DCM. Previous studies show that fractional anisotropy (FA) significantly reduces at stenotic levels in DCM patients [1-5]. However, the accuracy of using DTI metrics for evaluation and diagnosis in DCM is not fully validated. In this study, we sought to investigate the specificity and sensitivity of DTI metrics for evaluation and diagnosis in DCM.Methods and materials
Results and Discussion
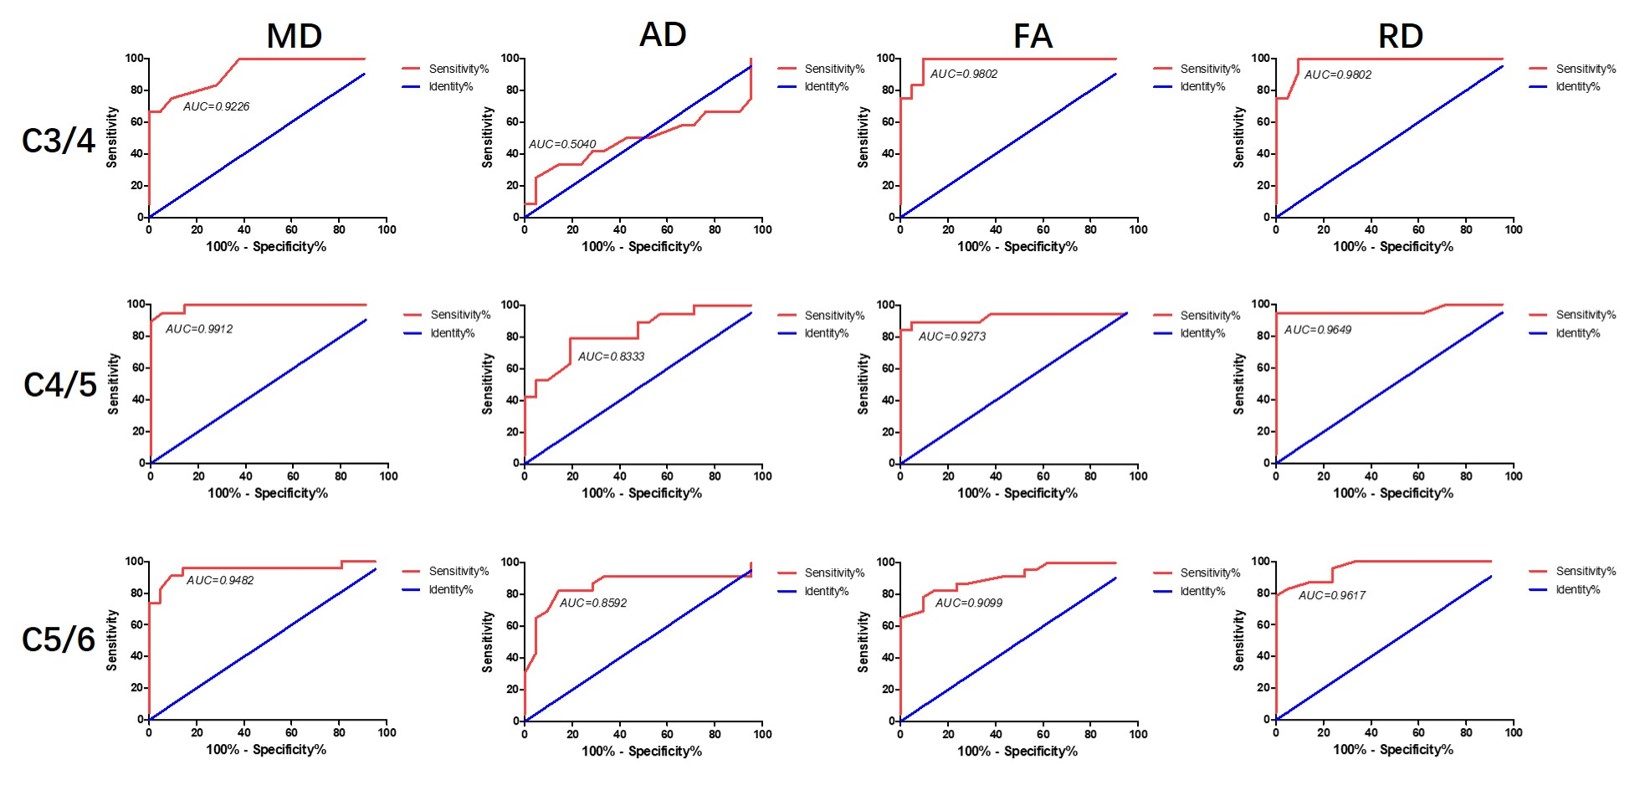
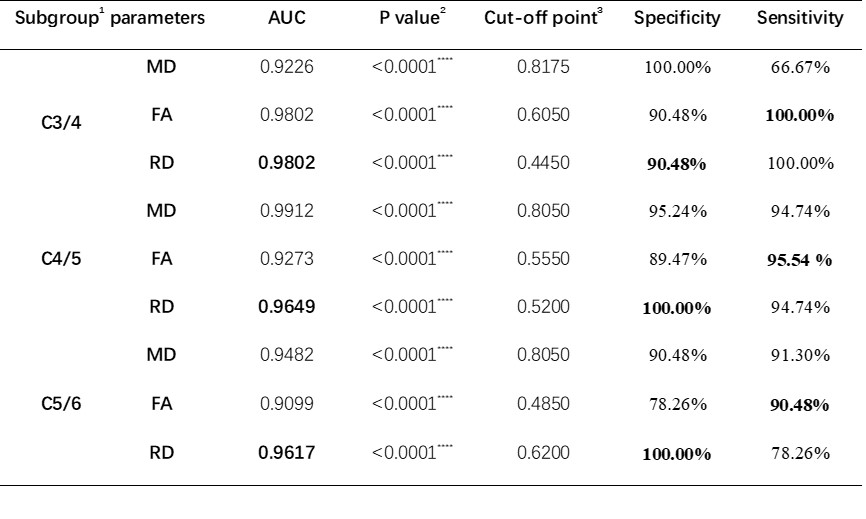
The t-test results for the DTI parameters are shown in Fig. 2. MD, FA, and RD have significant differences between the DCM patients and healthy volunteers at three cervical levels (C3/4, C4/5 and C5/6). The FA value of the patients is remarkably less than that of healthy volunteers (P<0.0001), which is consistent with previous studies [1-5]. Moreover, MD and RD values from the patients are higher due to axonal degeneration and demyelination [9]. These parameters can reflect the microstructural differences of spinal cord between patients and healthy volunteers, indicating that they have the robust capability to assess pathological information of the spinal cord in DCM. As shown in Fig. 3, all AUCs of MD, FA and RD are larger than 0.90 at the three different stenosis levels. The specificity and sensitivity of DTI parameters for evaluation of DCM are listed in Table 1. Statistical results demonstrate that MD, FA and RD can be used in diagnosis of DCM. FA has better sensitivity and RD has better specificity for evaluation and diagnosis in DCM.Conclusion
In this study, the specificity and sensitivity of DTI metrics for evaluation and diagnosis in DCM is investigated. Statistical results reveal that MD, FA and RD can capture the differences of spinal cord microstructural change between patients and healthy volunteers with high accuracy. Specifically, when used to evaluate the spinal cord dysfunction in DCM, FA has higher sensitivity and RD has higher specificity.Acknowledgements
No acknowledgement found.References
[1] Rindler, Rima S., et al. "Spinal Diffusion Tensor Imaging in Evaluation of Preoperative and Postoperative Severity of Cervical Spondylotic Myelopathy: Systematic Review of Literature." World neurosurgery 99 (2017): 150-158.
[2] Guan, Li, et al. "High-resolution diffusion tensor imaging in cervical spondylotic myelopathy: a preliminary follow-up study." NMR in Biomedicine 30.10 (2017).
[3] Jones, J. G. A., et al. "Diffusion tensor imaging correlates with the clinical assessment of disease severity in cervical spondylotic myelopathy and predicts outcome following surgery." American journal of neuroradiology 34.2 (2013): 471-478.
[4] Guan, Xiaofei, et al. "Diffusion tensor imaging studies of cervical spondylotic myelopathy: a systemic review and meta-analysis." PloS one 10.2 (2015): e0117707.
[5] Facon, David, et al. "MR diffusion tensor imaging and fiber tracking in spinal cord compression." American journal of neuroradiology 26.6 (2005): 1587-1594.
[6] De Leener, B., Lévy, S., Dupont, S. M., Fonov, V. S., Stikov, N., Louis Collins, D., Cohen-Adad, J. (2016). SCT: Spinal Cord Toolbox, an open-source software for processing spinal cord MRI data. NeuroImage. http://doi.org/10.1016/j.neuroimage.2016.10.009
[7] M. Jenkinson et al., “FSL.” Neuroimage 62(2), 782–790 (2012)
[8] Jiang, Hangyi, et al. "DtiStudio: resource program for diffusion tensor computation and fiber bundle tracking." Computer methods and programs in biomedicine 81.2 (2006): 106-116.
[9] Ellingson, Benjamin M., Noriko Salamon, and Langston T. Holly. "Advances in MR imaging for cervical spondylotic myelopathy."European Spine Journal 24.2 (2015): 197-208.
Figures