3211
The clinical value of DWIBS in the diagnosis of bone marrow involvement in lymphoma and hyperplastic hematopoietic bone marrow1MRI, The First Affiliated Hospital of Zhengzhou University, Zhengzhou, China, 2Philips Healthcare, Beijing, China
Synopsis
This study aimed to investigate the clinical value of diffusion weighted imaging with background signal suppression(DWIBS) in differentiating bone marrow involvement(BMI) in lymphoma from hyperplastic hematopoietic bone marrow(HHBM). Eleven BMI patients, 19 HHBM patients and 20 normal controls underwent DWIBS before the bone marrow biopsy. The ADC value of the bone marrow within the biopsy regions in BMI group was lower than that of HHBM group and higher than that of normal controls. ADC values added relevant information in the potential clinical value of differentiating BMI and HHBM patients.
Purpose
To investigate the clinical value of diffusion weighted imaging with background signal suppression(DWIBS) in differentiating bone marrow involvement(BMI) in lymphoma from hyperplastic hematopoietic bone marrow(HHBM).Materials and Methods
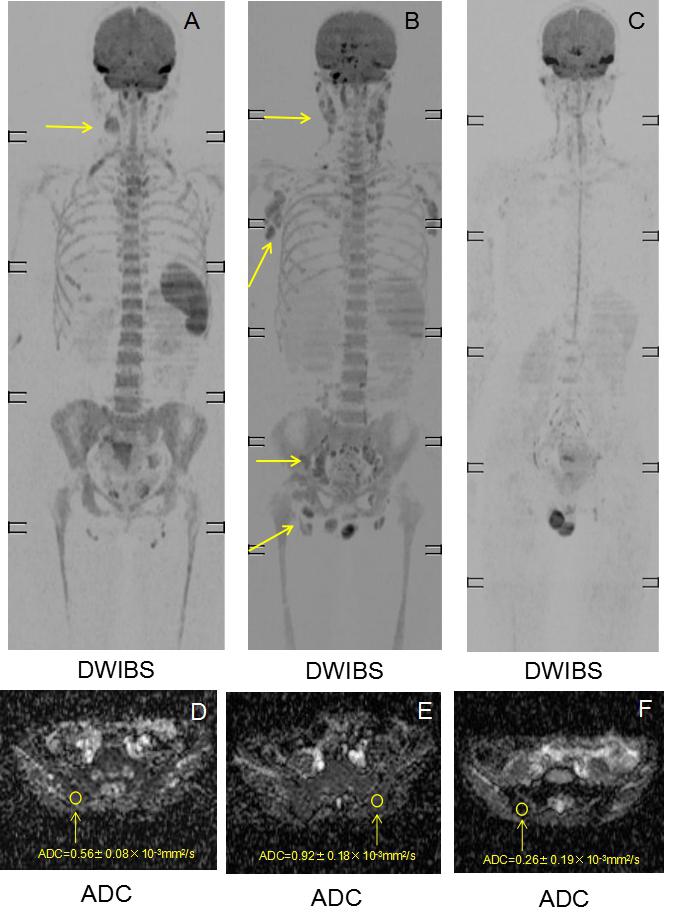
Thirty patients who were diagnosed with lymphoma and underwent bone marrow biopsy after the radiologist’s assessment of diffuse marrow abnormality by DWIBS were included in this study. According to the biopsy results, the patients were divided into two subgroups. One group included 11 BMI patients and the other group included 19 HHBM patients. Twenty normal controls were also included in this study for comparison. MRI images were acquired by using a 1.5T MR scanner (Achieva Intera, Philips, the Netherlands) with the following parameters. DWIBS: STIR-EPI, axial acquisition, TR=2996ms, TE=67ms, TI=180ms, FOV=530 mm×349mm×240mm for each station, slice thickness=6mm, b value=0 and 800s/mm2 , total scan time=15min for 8 stations. The ADC values of the bone marrow within the biopsy regions in BMI and HHBM groups and the ADC values of right posterior superior iliac spine in normal control group were measured(Figure 1). The differences of ADC values among the three groups was compared by single factor analysis of variance(one-way ANOVA).The heterogeneity of variance were evaluated by the SNK test. For further evaluating the differentiation of BMI and HHBM, diagnostic performance was analyzed by constructing receiver operator characteristic (ROC) curves and the ROC curves were furtherly used to determine the optimal ADC cutoff value with acceptable sensitivity and specificity.Results
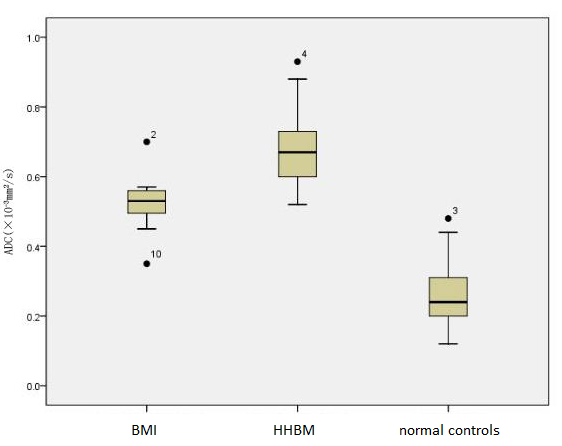
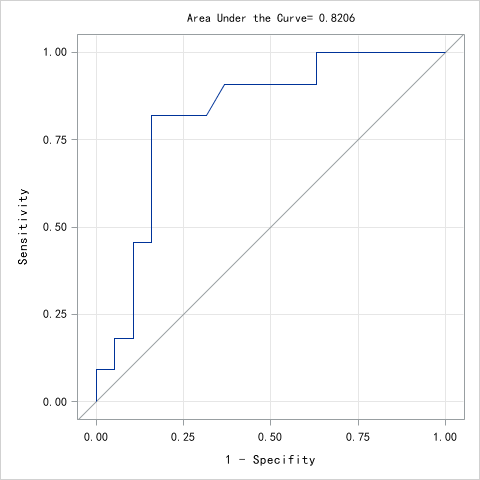
The mean ADC value of BMI was 0.52±0.09×10⁻³mm2/s, while the HHBM group was 0.67±0.18×10⁻³mm2/s and the normal control group was 0.29±0.12×10⁻³mm2/s(F=39.86,P<0.0001). According to the result of SNK test, it showed significant differences of the ADC values between each two groups(P<0.05).The Box-and-Whisker plots were showed in Figure 2 and the ROC curve was shown in Figure 3. AUC(Area Under the Curve)was 0.8206 (95% CI: 0.640-0.963). Using an optimal cut-off ADC value of 0.56×10⁻³mm2/s, the sensitivity and specificity were 82% and 84%, respectively.Discussion
The DWIBS imaging technique can sufficiently suppress the background signal of normal tissues (such as muscle, fat, liver, etc.) to highlight the lesions and improve the tissue contrast. Since the fat is suppressed in normal bone marrow, BMI in lymphoma could be better displayed, greatly improving the diagnostic sensitivity[1]. HHBM is a hyperplasia of hematopoietic cells and reconversion from fatty marrow to red marrow when the hematopoietic capacity of the existing hematopoietic cells is exceeded. It is mostly caused by anemia, heavy smoking, long-distance running and the use of granulocyte-colony-stimulating factor or erythropoietin[2]. HHBM can result in diffusely signal abnormality of bone marrow mimicking BMI in lymphoma in DWIBS, as which may change the staging and influence the treatments and prognoses of lymphoma patients. However, to our best knowledge, there are no previous studies assessing the usefulness of DWIBS combined with ADC values in the differential diagnosis of HHBM and BMI in lymphoma. Previous studies have showed that the ADC value is realted to the cellularity of bone marrow. The abundance of fatty cells and low water content causes the decreasing of ADC values and the abundance of hematopoietic cells causes the increasing of ADC values[3,4]. Our results showed that the high metabolic and perfusion state of the BMI lesions and the high water content of HHBM resulting in the higher ADC values in both the BMI and HHBM groups than the normal control group. As the higher nuclear-cytoplasmic ratio of lymphoma cells, the diffusion of water molecules in the lymphoma cells is restricted, and BMI lesions can occur in varying degrees of fibrosis, all of these caused a decrease in the ADC value of the BMI in lymphoma compared with the HHBM.Conclusion
DWIBS in combination with ADC values have the potential clinical value of differentiating BMI and HHBM patients.Acknowledgements
We thank Mingzhi Zhang, Lei Zhang, Xiaorui Fu for assistance with the experiments and clinical data of patients.References
[1] Jiang XX, Yan ZX, Song YY, et al. A pooled analysis of MRI in the detection of bone marrow infiltration in patients with malignant lymphoma[J]. Clin Radiol, 2013, 68(3):e143-e153.
[2] Shigematsu Y, Hirai T, Kawanaka K, et al. Distinguishing imaging features between spinal hyperplastic hematopoietic bone marrow and bone metastasis[J]. AJNR Am J Neuroradiol, 2014, 35(10):2013-2020. [3] Padhani AR, Koh DM. Diffusion MR imaging for monitoring of treatment response[J]. Magn Reson Imaging Clin N Am, 2011, 19(1):181-209.
[4] Nonomura Y, Yasumoto M, Yoshimura R, et al. Relationship between bone marrow cellularity and apparent diffusion coefficient[J]. J Magn Reson Imaging, 2001, 13(5):757-760.
Figures