3209
Evaluation of two collagen conduits and autograft in sciatic nerve regeneration in a rabbit nerve gap model with DTI, histology and electrophysiologyTina Jeon1, Emil S Vutescu2, Eliana B Saltzman2, Jordan C Villa2, Scott W Wolfe2, Steve K Lee2, Joseph H Feinberg3, Sarah L Pownder1, Jonathan P Dyke4, and Darryl B Sneag1
1Radiology and Imaging, Hospital for Special Surgery, New York, NY, United States, 2Department of Hand and Upper Extremity Service, Hospital for Special Surgery, New York, NY, United States, 3Department of Rehabilitation Medicine, Hospital for Special Surgery, New York, NY, United States, 4Citigroup Biomedical Imaging Center, Weill Cornell Medical College, New York, NY, United States
Synopsis
DTI has been used primarily to evaluate white matter tracks in the brain. More recent studies have applied DTI techniques to peripheral nerves, due to their anisotropic architecture. In this investigation, we evaluated peripheral nerve regeneration in a rabbit sciatic nerve gap model comparing two collagen conduits with nerve autograft using DTI and comparison with functional/physiologic testing and histology. We hypothesized that this study would allow us to reliably compare outcomes of nerve regeneration between collagen-based conduits and autograft nerve reconstructions and provide validation for the use of DTI techniques to non-invasively monitor nerve regeneration in-vivo.
Purpose
Neurotometic peripheral nerve injuries that cannot be repaired by a direct end-to-end, tensionless technique are addressed using either autograft, the current gold standard [1,2], or collagen-based conduits [3]. The aim of this investigation was two-fold, first, to evaluate the extent of peripheral nerve regeneration in a rabbit sciatic nerve gap model using a collagen-filled, polyglycolic acid (PGA) inner-layer conduit, NerbridgeTM (Toyobo Co Ltd, Osaka, Japan) as compared to a hollow collagen conduit, NeuraGen® (Integra Life Sciences, Plainsboro, NJ) and nerve autograft. Secondly, to validate diffusion tensor imaging (DTI) techniques to non-invasively monitor nerve regeneration in-vivo based on recent studies that have demonstrated that DTI can effectively assess nerve regeneration in rodent and rabbit models [4-7]. Nerve regeneration was evaluated with in-vivo magnetic resonance DTI, physiologic/functional testing (including electrodiagnostics), and histology.Methods
Subjects: 24 adult male, New Zealand white rabbits (3.0-3.5 kg) Surgical procedure: Under general anesthesia, a 10 mm transection gap was created in the sciatic nerve, proximal to the nerve’s bifurcation and bridged with either autograft, NerbridgeTM, or NeuraGen® conduits (n=8 in each group)(Fig.1) MRI: All rabbit femora were scanned bilaterally pre-operatively and postoperatively (13 weeks) under general anesthesia on a 3.0T Siemens Healthcare Prisma system using an 8-channel flexible array coil placed dorsally and 32-channel spine coil positioned ventrally under the thighs, with the rabbit prone. Data acquisition: 3D diffusion-weighted reversed fast imaging with steady state free precession (3D DW-PSIF): TE/TR=2.72/9.45ms, acquisition matrix=512x512, FOV=170x170 mm, slice thickness (ST)=0.9 mm, no gap, diffusion moment=90mT/m*msec, acquisition=1, imaging time=8:05 min. Diffusion weighted images (DWIs): single-shot EPI with SENSE (factor=2), TE/TR=47/3400 ms, matrix=76x44 mm, FOV=130x75 mm, ST=1.7 mm, no gap, acquisitions=10, 20 gradient directions, b-values =0, 700 sec/mm2, imaging time=11:42 min. DTI processing: After linearly registering all DWIs to b=0, tensor fitting was conducted using DTI Studio (mristudio.org). Sciatic nerves were segmented using the FA map (Fig.2) as a mask by thresholding the nerve (min. FA=0.3, max. FA=0.8), eroding the segmentation by 1 voxel, and including only voxels lying between the 25th-75th percentiles of the FA histogram. Physiologic/functional testing: Ankle contracture, tibialis anterior muscle weight, compound motor action potential (CMAP), and max. tetanic force were measured with respect to percentage of the non-operated nerve 13 week post-surgery. Animal weight was measured with respect to pre-surgery weight. Histology: A 5 mm segment of the sciatic nerve was harvested 5mm proximal to the infero-posterior corner of the greater trochanter and 3 mm distal to the sciatic nerve bifurcation and a similar location on the non-operated side. Samples were analyzed for axon density and myelin fiber diameter. Statistical Analysis: Group comparisons were conducted with Kruskal-Wallis test (a= 0.05) with post-hoc Bonferroni-correction. Spearman correlation coefficient between DTI and motor testing was measured.Results
Autograft performed better compared to both conduit groups. Between group differences in axonal diameter distal to the conduit site were significant (autograft > NeuraGen® > NerbridgeTM) at 13 weeks (between autograft and NeuraGen®, p=0.001 and between NeuraGen® and Nerbridge, p<0.001) (Fig. 3a). Significant group differences were found for axial diffusivity (AD) distal to the conduit site but not for any of the other DTI metrics (autograft > NeuraGen® > NerbridgeTM) (autograft and NeuraGen®, p=0.001 and NeuraGen® and Nerbridge, p=0.021) (Fig. 3b). Differences in axonal density were not significant but followed the same trend (autograft > NeuraGen® > NerbridgeTM). Representative histological micrographs are pictured in Fig. 4. CMAP, muscle weight, and animal weight followed a trend similar to histology and DTI (autograft > NeuraGen® > NerbridgeTM). NerbridgeTM treated animals, however, demonstrated less ankle contracture and increased maximum tetanic force compared to NeuraGen® (autograft > NerbridgeTM > NeuraGen®). There were mild to moderate correlations between functional measures and DTI metrics among all groups (Fig. 5) but these did not reach statistical significance. Electrophysiology studies showed that autograph performed the best with NeuraGen® and NerbridgeTM in a statistical tie.Discussion and conclusion
In summary, autograft-treated animals demonstrated greater sciatic nerve regeneration as assessed by histology, functional, and DTI parameters at 13 weeks, followed next by NeuraGen® and NerbridgeTM. Differences at the group level were only found with AD distal to the surgical site correlating with axonal diameter, which may indicate that AD is a potential DTI marker to detect group differences for axonal regeneration. In theory, the changes in eigenvalues occur due to the underlying changes in axonal swelling and flow, [8], restricting flow parallel to the axon, which is abundant in axonal regeneration [9] and could have a direct impact on AD. DTI may be efficacious to evaluate nerve regeneration in future in-vivo studies with larger sample sizes and continuous and extended time points.Acknowledgements
This study is sponsored by Toboyo Co., LTD. Francisco Colon, LVT, LATG and Vanessa Nieves, LVT, LATG, SRA at the Research Animal Resource Center, Weil Cornell Medical Center for their assistance in rabbit handling. Fred Xavier, MD, PhD at the Department of Orthopedic Surgery, Hospital for Special Surgery for his assistance in the rabbit surgeries. Bin Lin of the Healthcare Research Institute, Hospital for Special Surgery for statistical assistance.References
[1] Siemionow M, Brzezicki G. Chapter 8: Current techniques and concepts in periphearl nerve repair. Int Rev Neurobiol 2004;87:141-172. [2] Ray WZ, Mackinnon SE, Management of nerve gaps: autografts allografts nerve transfers and end-to-side neurography. Exp Neurol 2010;223:77-85. [3] Giusti G, et al. Return of motor function after segmental nerve loss in a rat model: comparison of autogenous nerve graft, collagen conduit, and processed allograft (AxoGen). J Bone Joint Surg Am 2012;94(5): 410-417. [4] Takagi T et al. Visualization of peripheral nerve degeneration and regeneration: monitoring with diffusion tensor tractography. Neuroimage 2009;44(3): 884-892. [5] Li X et al. In vivo DTI longitudinal measurements of acute sciatic nerve traction injury and the association with pathological functional changes. Eur J Radiol 2013;82: e707-e714. [6] Sun C et al. In vivo evaluation of sciatic nerve crush injury using diffusion tensor imaging: Correlation with nerve function and histology. J Comput Assist Tomogr 2014;38: 790-796. [7] Yamasaki T et al. In vivo evaluation of rabbit sciatic nerve regeneration with diffusion tensor imaging (DTI): correlations with histology and behavior. Mag Reson Imaging 2015;33: 95-101. [8] Ford JC et al. MRI characterization of diffusion coefficients in a rat spinal cord injury model. Mag Reson Med 1994;31(5): 488-494. [9] Markus A et al. Neurotrophic factors and axonal growth. Curr Op Neurobiol 2002;12(5): 523-531.Figures
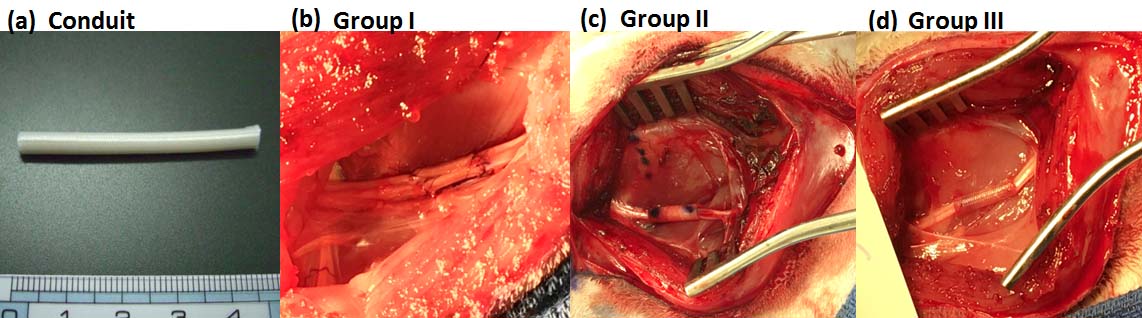
The location of the nerve conduit in
the rabbit. NerbridgeTM (a) before it is implanted into the rabbit
sciatic nerve. Post-operative reconstructions of the autograft (b), Neuragen®
(c), and NerbridgeTM (d) surgically implanted to bridge the gap at
the inferior-posterior corner of the greater trochanter in the rabbit sciatic
nerve.
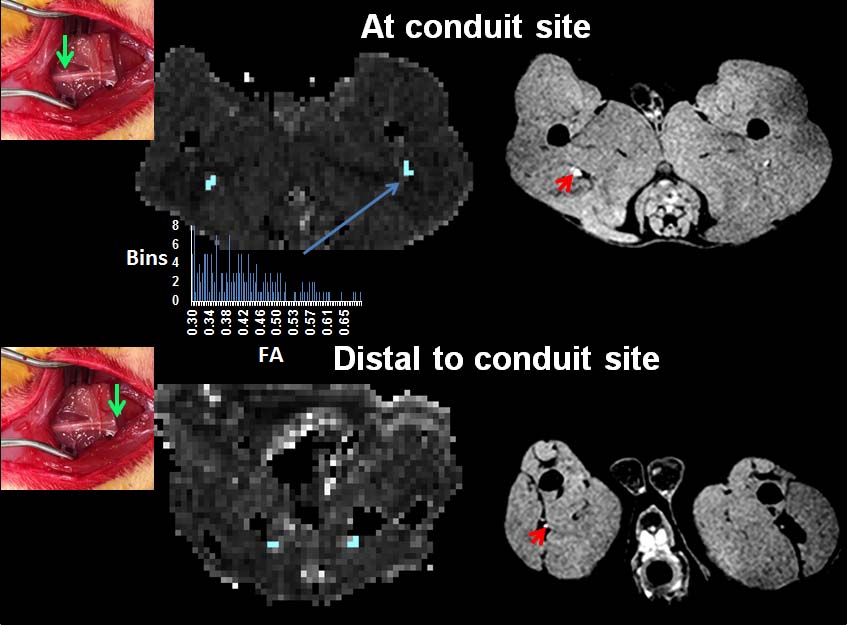
Segmentation of the sciatic nerve. The
sciatic nerve was segmented by thresholding the FA map of the nerve between the
values of 0.3-0.9 and eroding the edges by one voxel and thresholding those
voxels within 25-75% of the histogram. The mask was then binarized (blue). For
DTI quantification, the conduit or graft site was located 5 mm proximal to the
infero-posterior corner of the greater trochanter on the FA map and the conduit
site was located 3 mm distal to the sciatic nerve bifurcation on the FA map.
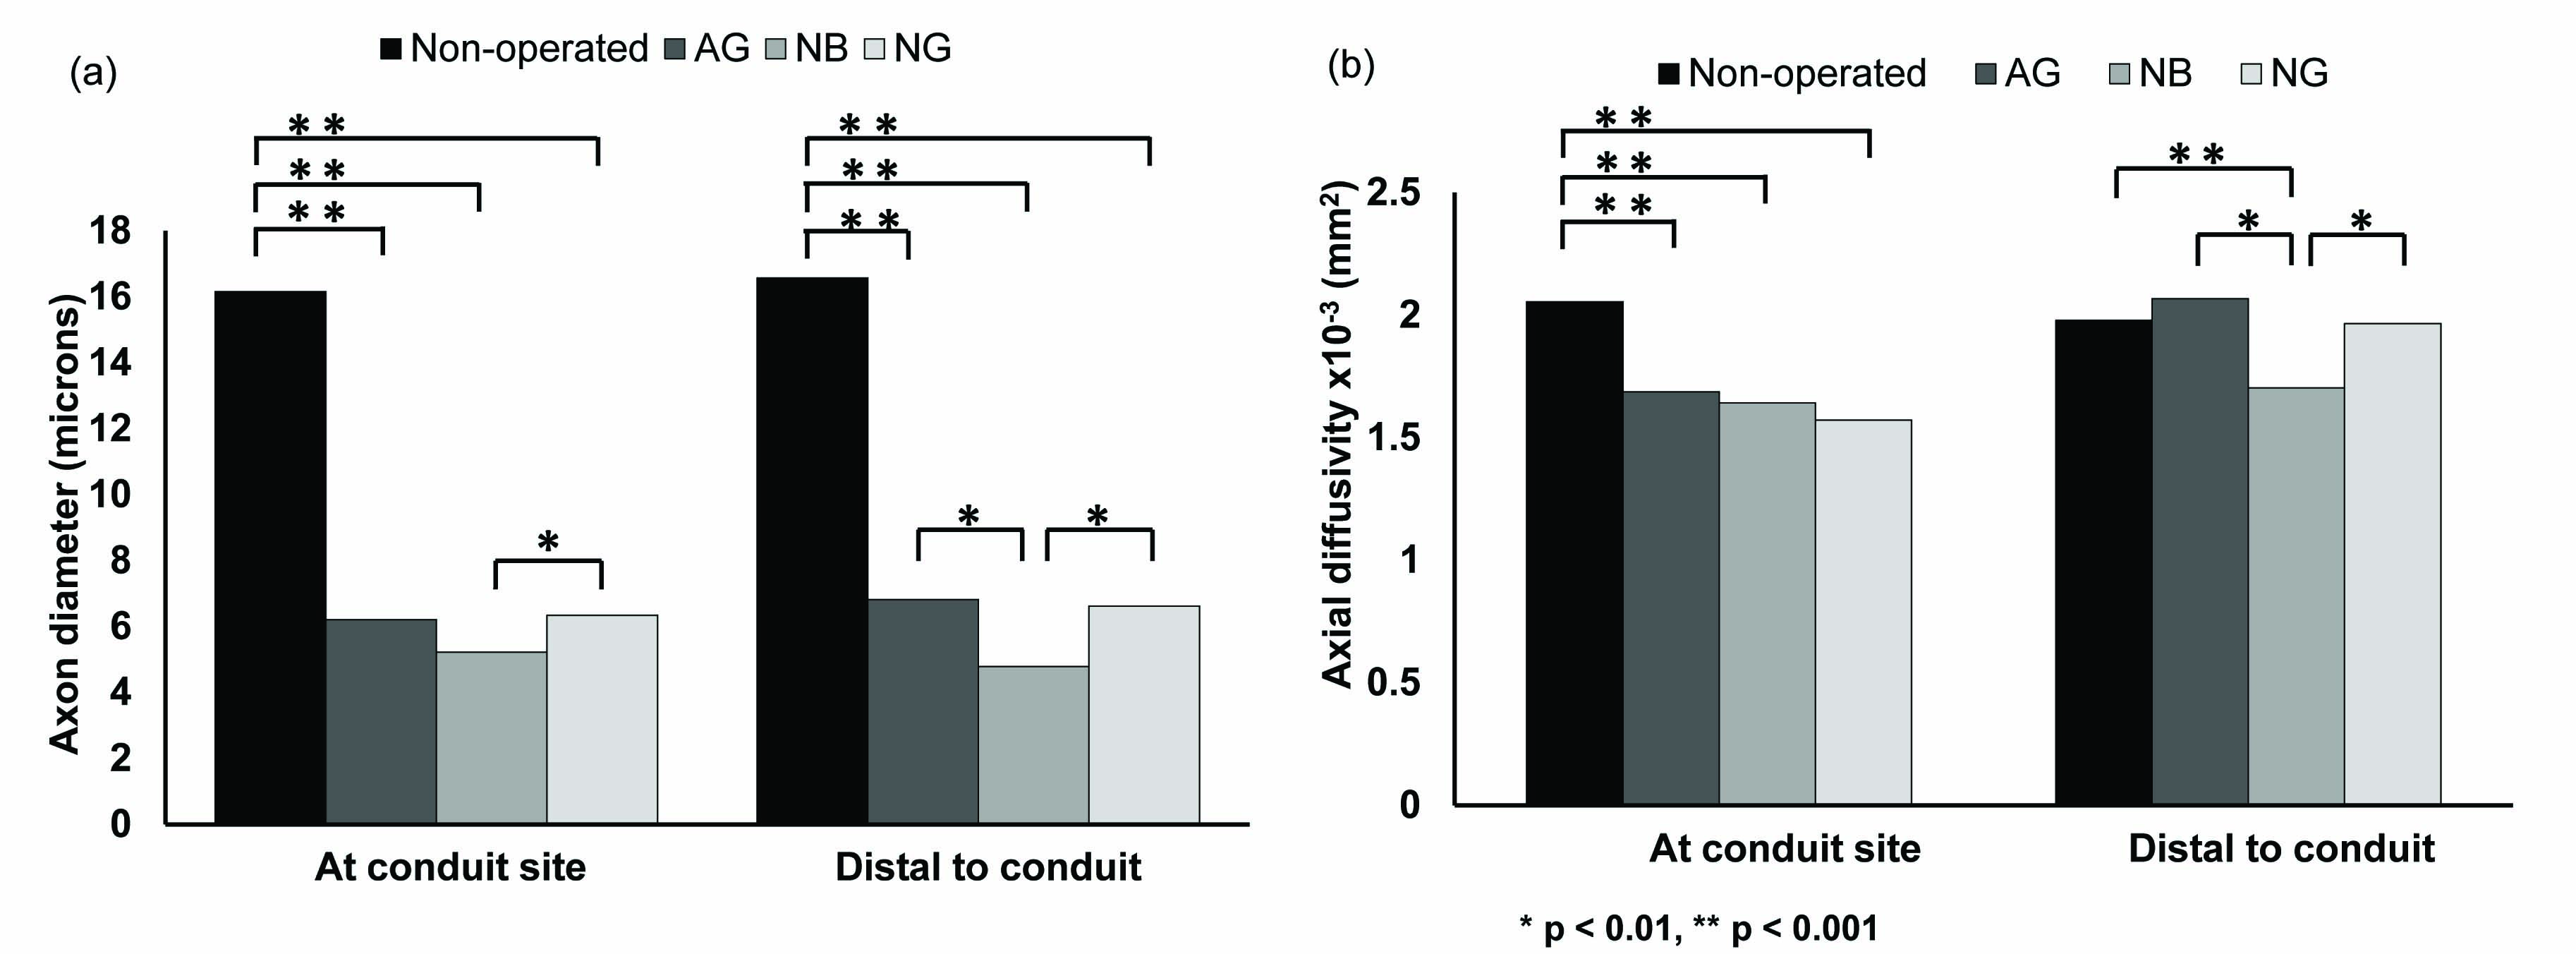
Myelinated axon
diameter (a) and axial diffusivity (b) of autograft (AG), Neuragen® (NG), and
NerbridgeTM (NB) and compared to the non-operated nerve (black) at
the conduit site and distal to the conduit site. The asterisks indicate
statistical significance.
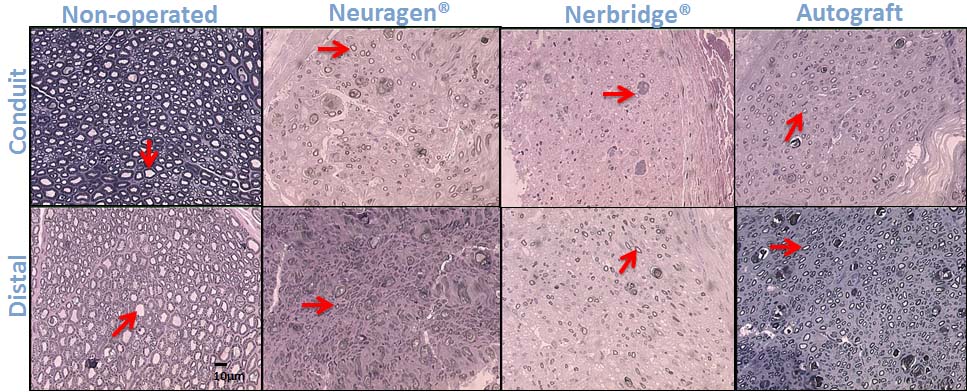
Micrographs of orthogonal sections of
the sciatic nerve 13 weeks after segmental nerve surgery.
Histologic sections of the sciatic
nerve distal to and at the conduit site 13 weeks post-surgery of autograft, Neuragen®,
and NerbridgeTM with toluidine staining at 100x magnification. For
comparison, a normal sciatic nerve is shown on the left. The red arrows are
pointing to regenerated axons. Axon density and axonal diameter are decreased
within conduit and autograft groups compared to normal controls. Note: Color
differences are due to staining/drying of toluidine blue.
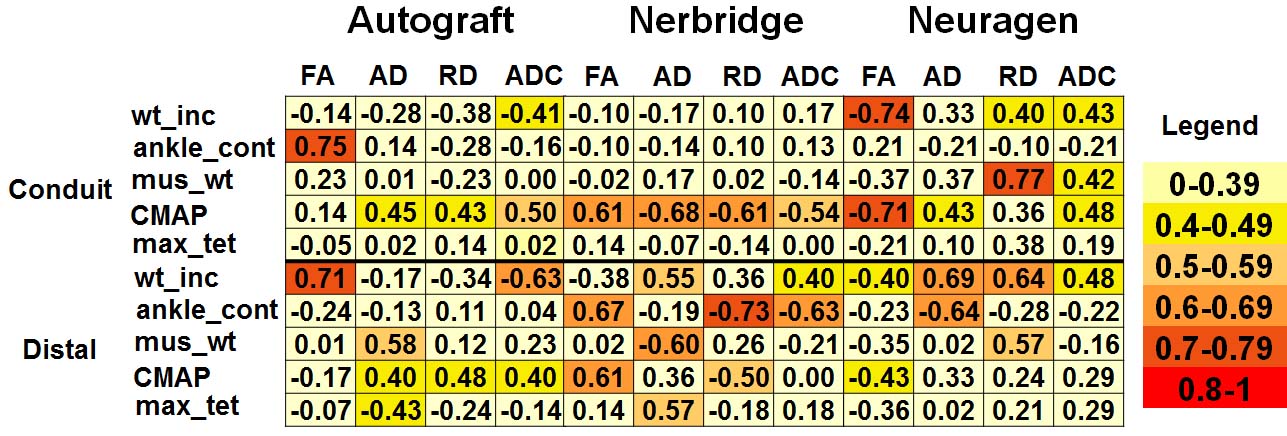
Spearman correlations of DTI and functional
measures. The heat map indicates the
level of correlation:
0.00 to (-)0.19 = very weak
(-)0.20 to (-)0.39 = weak
(-)0.40 to (-)0.59 = moderate
(-)0.60 to (-)0.79 = strong
(-)0.80 to (-)1.0 = very strong