3206
Prostate Cancer: Influence of the Diffusion Time on Diffusion Kurtosis Imaging1Medical Physics in Radiology, German Cancer Research Center (DKFZ), Heidelberg, Germany, 2Institute of Radiology, University Hospital Erlangen, Friedrich-Alexander-Universität Erlangen-Nürnberg (FAU), Erlangen, Germany, 3Radiology, German Cancer Research Center (DKFZ), Heidelberg, Germany, 4Conradia, Hamburg, Germany
Synopsis
Diffusion MRI is routinely used in prostate cancer diagnosis. Diffusion kurtosis imaging allows measuring the kurtosis Kapp, related to deviations from free diffusion, additionally to the diffusion coefficient Dapp. Varying the diffusion time may yield additional information about the investigated tissue by probing the diffusion barriers at different length scales. Here, Dapp and Kapp were measured at three diffusion times in 27 patients with histologically confirmed prostate cancer. A reduction of Kapp was observed in tumor and normal control regions with increasing diffusion time, while a Dapp reduction was mostly seen in control regions.
Introduction
Due to the reduction of the apparent diffusion coefficient (ADC) in tumor tissue, diffusion weighted imaging (DWI) is routinely applied for tumor detection, especially for prostate cancer [1-3]. However, tumor grading is most important for therapeutic decisions, which is not easily achievable using ADC measurements only. Therefore, it would be desirable to obtain additional parameters linked to tissue structure from diffusion measurements. Diffusion kurtosis imaging (DKI) is an approach in this regard, which measures the diffusion coefficient $$$D_\mathrm{app}$$$ and the apparent kurtosis $$$K_\mathrm{app}$$$ [4-8]. $$$K_\mathrm{app}$$$ quantifies the deviation from free Gaussian diffusion. The diffusion time $$$T$$$ is an additional experimental dimension [9]. Measuring $$$D_\mathrm{app}(T)$$$ and $$$K_\mathrm{app}(T)$$$ at varying diffusion time may yield additional information regarding the investigated tissue, since the typical length scale of the structures probed by the diffusing water molecules changes. In this work, the feasibility of measuring $$$D_\mathrm{app}(T)$$$ and $$$K_\mathrm{app}(T)$$$ for patients with histologically confirmed prostate cancer is demonstrated.Methods
This study was performed on a set of patients who received a diagnostic MRI which was extended by diffusion kurtosis measurements with three different diffusion times $$$T$$$ according to the institutional ethical guidelines. For the analysis, those patients were chosen, who exhibited prostate cancer confirmed by transperineal hybrid MR/ultrasound fusion image-guided biopsy in the areas previously identified as suspect on MRI by the reading radiologist. The 27 patients meeting these criteria were diagnosed with Gleason scores between 6 and 9. DKI measurements comprised three diffusion times, acquired using a spin echo (SE) EPI sequence with TE=70 ms and a stimulated echo (STEAM) EPI sequence with TE=30 ms and the mixing times TM=250 ms and TM=500 ms (3T, Siemens Magnetom Trio, body matrix coil). Additional sequence parameters: FOV 329 × 164 mm², matrix 100 × 50, slice thickness 3.3 mm, bandwidth 2632 Hz/pixel, b-values 50, 250, 500, 750, 1000, 1250, 1500, 2000 s/mm², three orthogonal diffusion directions. Additional parameters for the SE sequence: TR=2.7 s, 5 averages. For STEAM: TM=250 ms: TR=4.5 s, 4 averages; for TM=500 ms: TR=5.7 s, 4 averages. For the evaluation, regions of interest (ROIs) were placed in the histologically confirmed tumor regions as well as in normal tissue. $$$D_\mathrm{app}(T)$$$ and $$$K_\mathrm{app}(T)$$$ were calculated by fitting the equation $$S(b)=\sqrt{(S_0\exp(-bD_\mathrm{app}+b^2 D_\mathrm{app}^2 K_\mathrm{app} / 6))^2+\eta^2}$$ to the measured signal $$$S(b)$$$ with the noise level $$$\eta$$$ of the MR images [4,8].Results
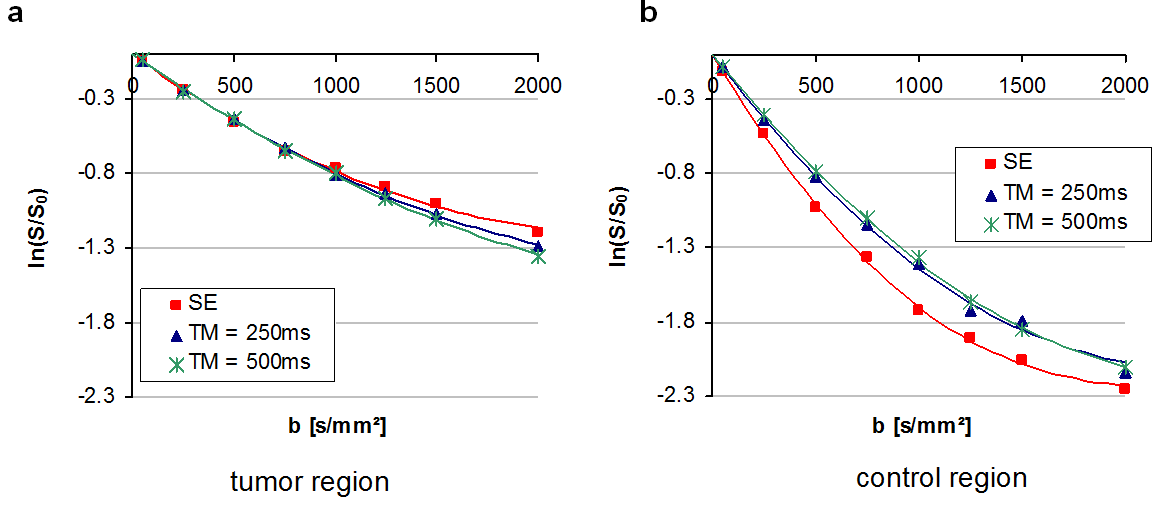
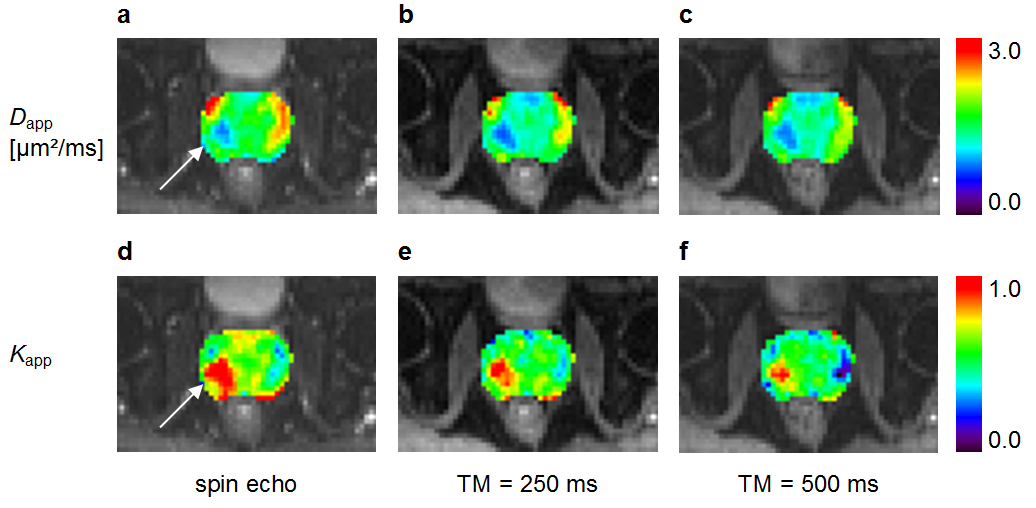
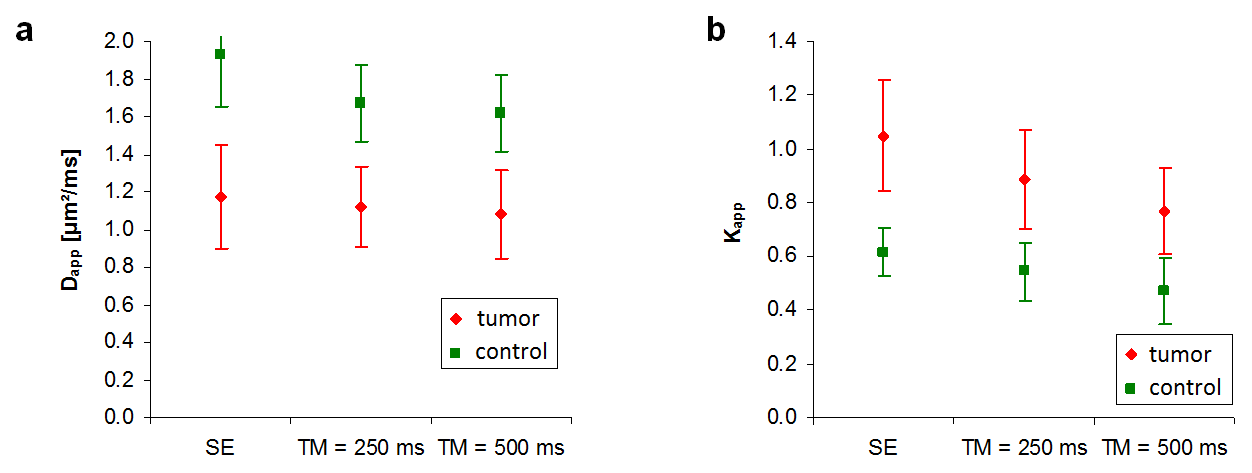
Figure 1 shows exemplarily the influence of the different diffusion times on the fitted functions for ROI averaged signals for one patient. Differences in the slope for small b-values $$$(\leq500\,\mathrm{s/mm}^2)$$$ can be observed resulting in different $$$D_\mathrm{app}$$$ values. In the tumor region, only a different curvature is visible. Therefore, in this region, mostly variations in $$$K_\mathrm{app}$$$ are to be expected. In Fig. 2, $$$D_\mathrm{app}$$$ and $$$K_\mathrm{app}$$$ maps are depicted for one patient. A slight decrease of the measured diffusion coefficient $$$D_\mathrm{app}$$$ especially in areas with higher $$$D_\mathrm{app}$$$ values can be observed. A significant decrease of $$$K_\mathrm{app}$$$ with increasing diffusion time can be observed both in the tumor and the normal tissue. $$$D_\mathrm{app}$$$ and $$$K_\mathrm{app}$$$ values averaged over 27 patients are depicted in Fig. 3. For the control regions, a decrease of the averaged $$$D_\mathrm{app}$$$ values from 1.93 µm²/ms to 1.62 µm²/ms can be observed with increasing $$$T$$$; $$$K_\mathrm{app}$$$ decreases from 0.62 to 0.47. In tumor regions, $$$D_\mathrm{app}$$$ is mainly constant, while a decrease of the mean value of $$$K_\mathrm{app}$$$ from 1.05 to 0.77 was observed.Discussion
The larger packing density of diffusion restrictions in the tumor area may be a possible explanation for the lower $$$T$$$ dependence of $$$D_\mathrm{app}$$$ compared to the normal region. It may be assumed that the diffusion process is closer to the long-time limit in the tumor area resulting in smaller $$$T$$$ dependence. On the other hand, a substantial $$$T$$$ dependence of $$$K_\mathrm{app}$$$ was observed both in the normal and the tumor region, which may be interpreted as a sign of higher sensitivity of $$$K_\mathrm{app}$$$ to changing diffusion distance. Additionally, compartments with different relaxation times may contribute to the observed $$$T$$$ dependence. The general trend of decreasing diffusion coefficient was also observed using diffusion tensor imaging [9]. The larger $$$T$$$ dependence of the diffusion coefficient in tumor areas observed in [9] may be due to the use of different b-values and the fact that no kurtosis term was fitted.
Conclusion
In this work, the possibility of measuring the diffusion time dependence of $$$D_\mathrm{app}(T)$$$ and $$$K_\mathrm{app}(T)$$$ in patients with prostate cancer was demonstrated. In future studies, a correlation with the Gleason score will be investigated with the possible aim to name an optimal $$$T$$$ for best separation. Furthermore, using similar $$$T$$$ is necessary for quantitative comparison of DKI-derived parameters from different sites or studies.
Acknowledgements
No acknowledgement found.References
1. Woodfield CA, Tung GA, Grand DJ, Pezzullo JA, Machan JT, Renzulli JF, 2nd. Diffusion-weighted MRI of peripheral zone prostate cancer: comparison of tumor apparent diffusion coefficient with Gleason score and percentage of tumor on core biopsy. AJR Am J Roentgenol 2010;194(4):W316-322.
2. Kim CK, Park BK, Lee HM, Kwon GY. Value of diffusion-weighted imaging for the prediction of prostate cancer location at 3T using a phased-array coil: preliminary results. Invest Radiol 2007;42(12):842-847.
3. Gibbs P, Liney GP, Pickles MD, Zelhof B, Rodrigues G, Turnbull LW. Correlation of ADC and T2 measurements with cell density in prostate cancer at 3.0 Tesla. Invest Radiol 2009;44(9):572-576.
4. Jensen JH, Helpern JA, Ramani A, Lu H, Kaczynski K. Diffusional kurtosis imaging: the quantification of non-gaussian water diffusion by means of magnetic resonance imaging. Magn Reson Med 2005;53(6):1432-1440.
5. Rosenkrantz AB, Sigmund EE, Johnson G, Babb JS, Mussi TC, Melamed J, Taneja SS, Lee VS, Jensen JH. Prostate cancer: feasibility and preliminary experience of a diffusional kurtosis model for detection and assessment of aggressiveness of peripheral zone cancer. Radiology 2012;264(1):126-135.
6. Tamura C, Shinmoto H, Soga S, Okamura T, Sato H, Okuaki T, Pang Y, Kosuda S, Kaji T. Diffusion kurtosis imaging study of prostate cancer: preliminary findings. J Magn Reson Imaging 2014;40(3):723-729.
7. Quentin M, Pentang G, Schimmoller L, Kott O, Muller-Lutz A, Blondin D, Arsov C, Hiester A, Rabenalt R, Wittsack HJ. Feasibility of diffusional kurtosis tensor imaging in prostate MRI for the assessment of prostate cancer: preliminary results. Magn Reson Imaging 2014;32(7):880-885.
8. Roethke MC, Kuder TA, Kuru TH, Fenchel M, Hadaschik BA, Laun FB, Schlemmer HP, Stieltjes B. Evaluation of Diffusion Kurtosis Imaging Versus Standard Diffusion Imaging for Detection and Grading of Peripheral Zone Prostate Cancer. Invest Radiol 2015;50(8):483-489.
9. Lemberskiy G, Rosenkrantz AB, Veraart J, Taneja SS, Novikov DS, Fieremans E. Time-Dependent Diffusion in Prostate Cancer. Invest Radiol 2017;52(7):405-411.
Figures