3205
Towards a definition of the biophysical bases of transient Anomalous Diffusion (tAD) parameters. Evaluation of tAD, DKI and DTI in normal and cancer prostate tissue with Magnetic Resonance micro-imaging at 9.4 Tesla1SAIMLAL Dept., Sapienza University of Rome, Rome, Italy, 2CNR-ISC Physics Dept., Sapienza University of Rome, Rome, Italy, 3Diagnostic and Interventional Radiology Dept., Tor Vergata University, Rome, Italy
Synopsis
Since DKI and transient anomalous diffusion imaging (tADI) are based on statistical models, they can be performed without the need of a-priori hypothesis on tissue micro-structures. However, the relation between tissue micro-structure DKI and tADI derived parameters have not been clearly established yet. In this work, we evaluated DKI, tAD and DTI diffusion parameters in normal and high-grade cancer prostate, by MR microimaging at 9.4T with a 70μmx70μm in plane resolution. As prostate tissue is a complex tissue, composed by several micro-compartments that exhibit different diffusion behaviors, it is an ideal tissue to investigate the biophysical features of diffusion parameters.
Introduction
In this work Diffusion Kurtosis Imaging (DKI) and transient Anomalous Diffusion Imaging (tADI) were performed on ex-vivo prostate specimens, in addition to the conventional DTI. Kurtosis is the fourth-order term of the NMR signal cumulant expansion, it quantifies the signal deviation from the mono-exponential decay, providing a measure of tissue heterogeneity [1]. tADI derived from Continuous Time Random Walk model introduced by Metzler and Klafter [2], a generalization of the basic random walk theory, developed with the purpose to investigate heterogeneous and complex media. tADI allows to measure the γ-parameter that is sensitive to tissue susceptibility differences and multi-compartmentalization [3,4]. Since DKI and tADI are based on statistical models, they can be performed without needing a-priori hypothesis on tissue micro-structures. However, the relation between tissue micro-modifications and DKI- and tADI-derived parameters must be investigated and established. In this preliminary work, we evaluated DKI, tAD and DTI diffusion parameters in normal and high-grade PCa, by MR microimaging at 9.4T and with a resolution of 70x70μm2 in the plane. Prostate tissue is composed by several micro-compartments that exhibit different diffusion behaviors [5]. Therefore, as prostate is a complex tissue, consisting of structures with length scale from 100 μm to less than 1 μm, it is an ideal tissue to investigate the biophysical features of diffusion parameters.Methods
Tissue samples were obtained from radical prostatectomy specimens and kept in 4% PBS formaldehyde at 4°C for conservation. An expert uropathologist selected one normal and one cancer sample from 3 patients with high-grade Pca (Gleason Score ≥ 4+4). Acquisition was performed on a Bruker AV400 spectrometer operating at 9.4 T with a micro-imaging probe and maximum gradient strength of 1200mT/m. XWINNMR® and ParaVision® 3.0 software were employed for data acquisition. DWIs were acquired with a Pulsed Gradient Stimulated Echo (TE/TR=14,8/4500 (ms); resolution=70x70x1000μm3; δ/Δ=3/40 (ms); NSA=8), by varing diffusion gradient strengths; 9 b-values from 0 to 5000 s/mm2 were applied along 6 non-collinear directions
DTI was performed by FSL 5.0 software, with the b-value range 0-1500 s/mm2; non-Gaussian parameters were calculated by a customized algorithm developed in Matlab R2012b. Mean Kurtosis (MK) and kurtosis-derived mean diffusivity (MDk) were calculated by fitting DWI signal for each diffusion encoding direction, with the following equation:
$$\frac{S}{S_0}=e^{-bMD_k + \frac{1}{6}b^2MD_k^2\cdot K}$$
in the b-value range 0-2000 s/mm2. Moreover, proxy Kurtosis Fractional Anisotropy (KFA) was calculated as reported in [6].
tAD was performed, as described in [7], by fitting signal in the b-values range 0-5000s/mm2 with the following equation:
$$\frac{S}{S_0}=\prod_1^3 e^{-A_ib^{\gamma_i} (V_{ix}G_x+V_{iy}G_y+V_{iz}G_z)^{\gamma_i}}$$
where Gx,Gy,Gz are the diffusion-encoding directions, Ai are the generalized diffusion constants, γi, the three values of the anomalous exponent projected along the 3 main axes of the DTI reference frame, individuated by the eigenvectors Vix,Viy,Viz. Mean γ (Mγ), i.e. the mean values of the pseudo-superdiffusion γ-parameter, was calculated as reported in [3].
Region of Interests (ROI) were manually drawn on DW-images in tumoral and normal tissue.
Results
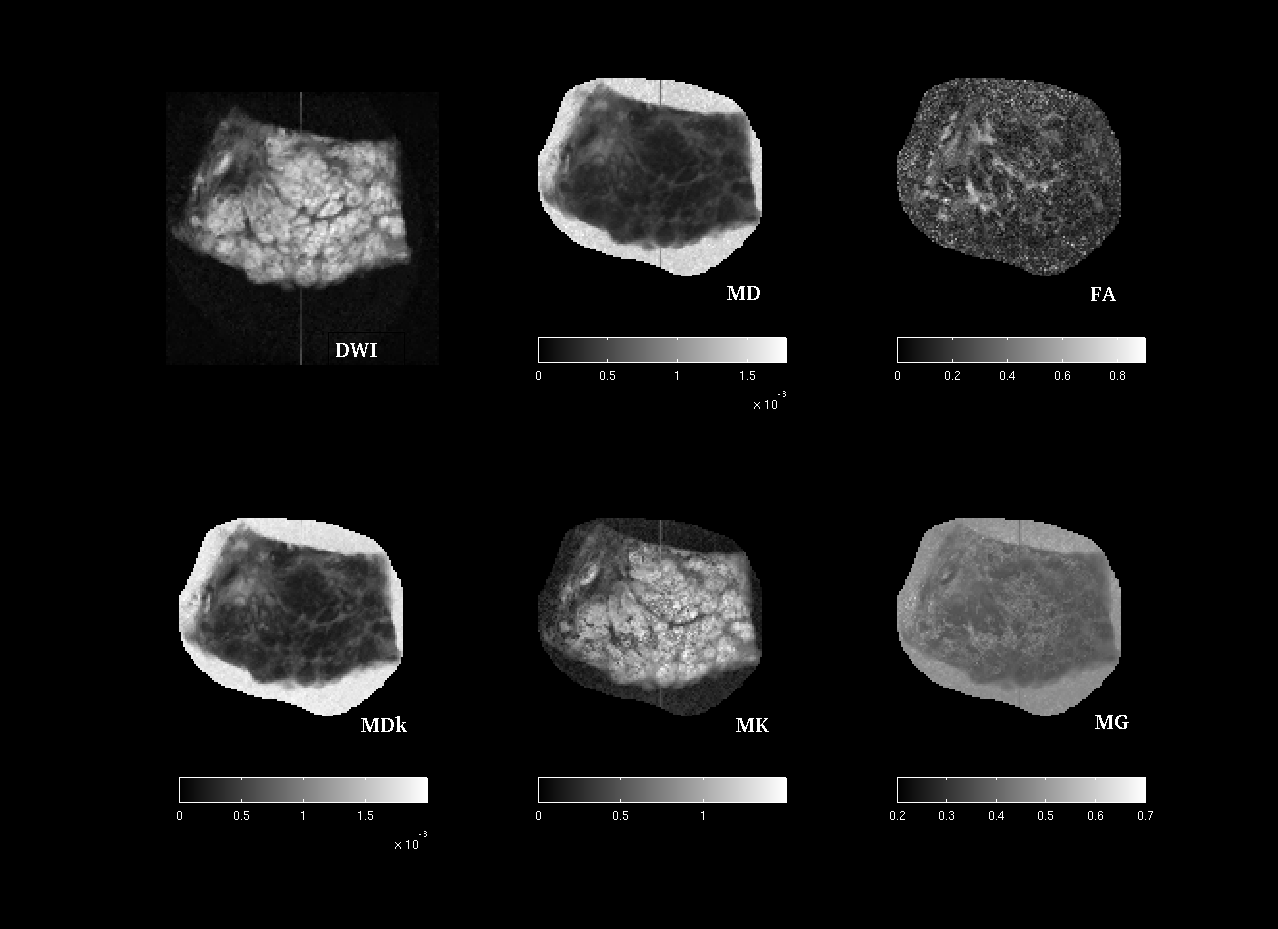
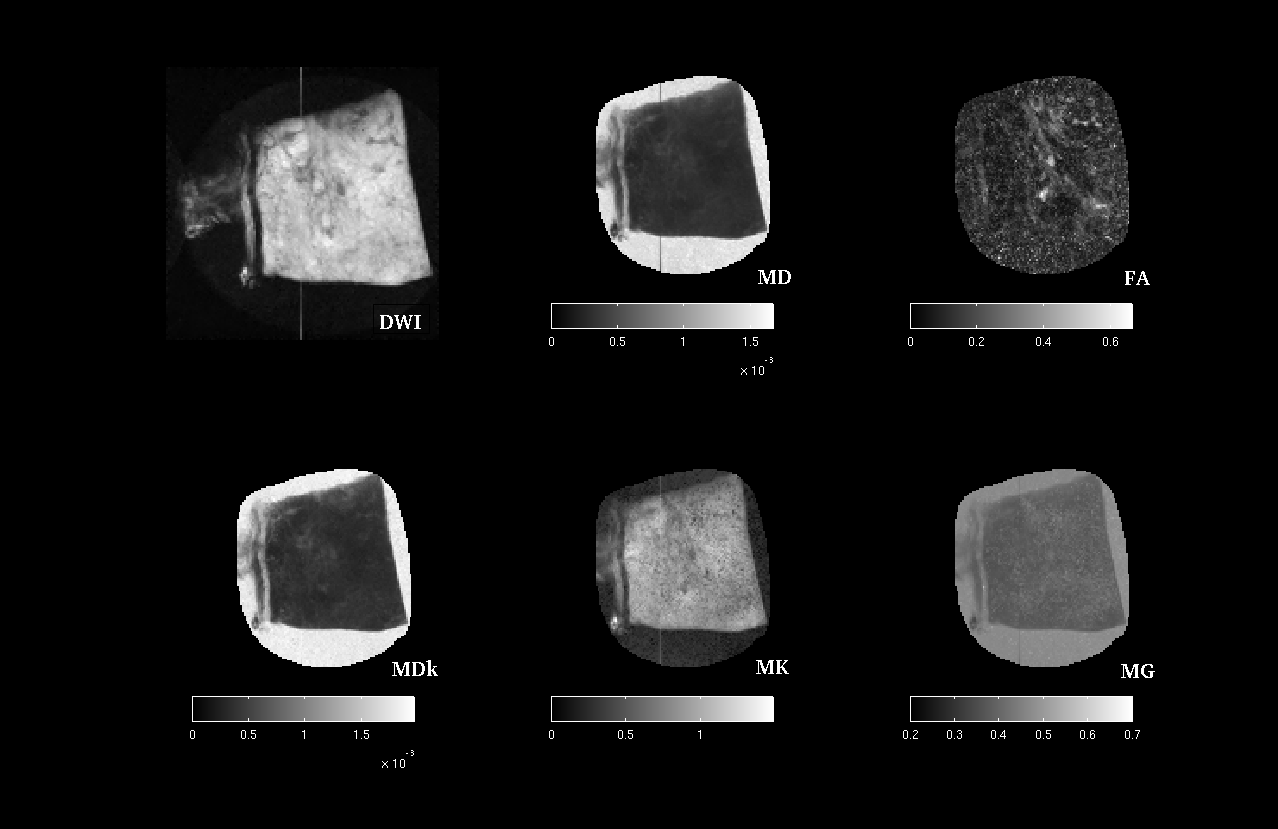
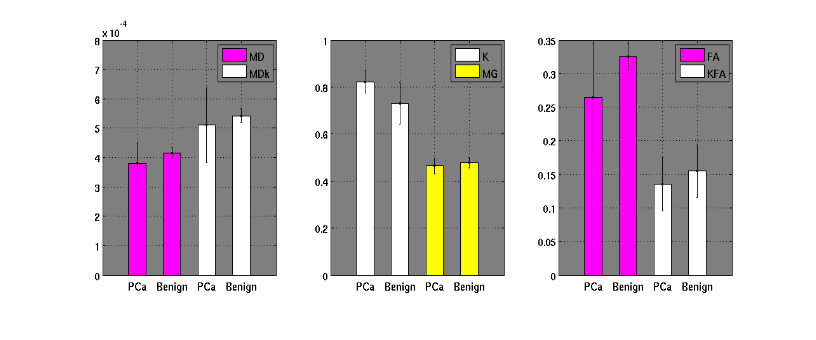
The glandular structure of prostate is visible in DWIs and diffusion parameters maps of normal samples, except for FA-map; MDk seems to better describe the tissue architecture (Fig. 1 and 2). MD, MDk and Mγ are lower in PCa, while FA, KFA and MK are higher; DTI-parameters show mean values comparable with other ex-vivo studies [5,8].Discussion and Conclusions
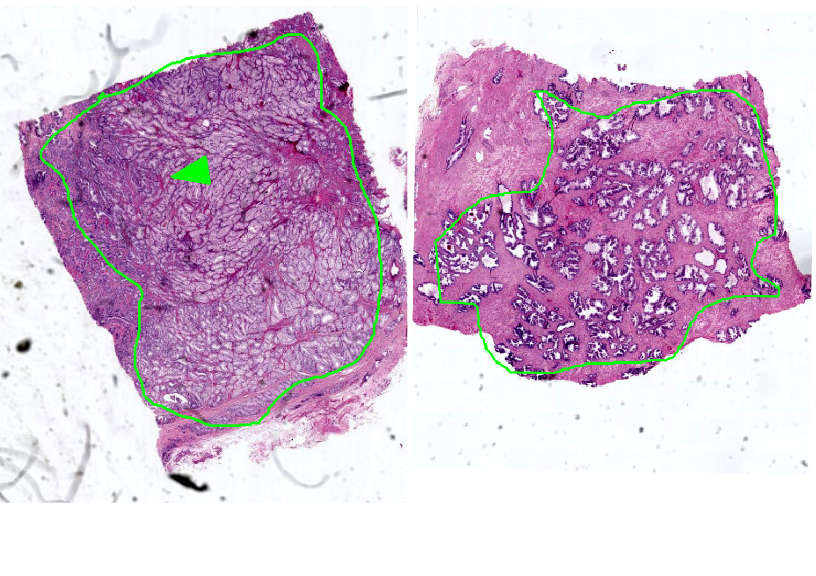
Diffusion derived micro-images highlight tissue architecture and reflect structural modifications occurring with tumor. Histopathological evidences showed that Pca with Gleason Score (GS) ≥ 4+4 consists in a solid mass of undifferentiated cells (Fig.3), indeed no glandular structure is recognizable on DWIs or diffusion maps (Fig. 2). MD and MDk are lower in PCa, as a result of malignant cells proliferation that obstructs the almost-free diffusion compartments (acini, ducts), leading to an increase of tissue heterogeneity (K increases) and a reduction of tissue susceptibility differences (Mγ decreases). As a consequence of increasing cell density, FA and KFA are lower in cancer tissue.
In conclusion, MR micro-imaging in healthy and cancer prostate tissue allows to investigate diffusion proprieties of micro-structures approaching the cellular scale. As a consequence, micro-imaging technique could be employed to elucidate the biophysical underpinning of non–Gaussian diffusion parameters and in particular of the tAD parameters.
Acknowledgements
No acknowledgement found.References
[1] Jensen J.H. and Helpern J.A., MRI quantification of Non-Gaussian water diffusion by Kurtosis Analysis. NMR Biomed, 2010.
[2] Metzler R. and Klafter J., The random walk’s guide to anomalous diffusion: a fractional dynamics approach. Physics Reports, 2000.
[3] Palombo M. et al., Spatio-temporal anomalous diffusion in heterogeneous media by nuclear magnetic resonance. J Chem Phys, 2011.
[4] Capuani S. et al., Spatio-temporal anomalous diffusion imaging: results in controlled phantoms and in excised human meningiomas. Magn Reson Imaging, 2013.
[5] Bourne R.M. et al., Microscopic diffusivity compartmentation in formalin-fixed prostate tissue.Magnetic Resonance in Medicine, 2012.
[6] Hansen B. and Jespersen S.N., Kurtosis fractional anisotropy, its contrast and estimation by proxy. Sci. Rep., 2016.
[7] Caporale A. et al.,The γ-parameter of Anomalous Diffusion quantified in human brain by MRI depends on local magnetic susceptibility differences, NeuroImage, 2016.
[8] Xu J.Q., et al.,. Magnetic resonance diffusion characteristics of histologically defined prostate cancer in humans. Magn Reson Med, 2009.
Figures