3204
Postmortem MR diffusion-weighted imaging of the liver: Time behavior of the hepatic apparent diffusion coefficient in the early death interval1Diagnostic and Interevntional Radiology, University Medical Center Hamburg Eppendorf, Hamburg, Germany, 2Department Stroke and Neurovascular Imaging, The Permanente Medical Group, San Francisco, CA, United States, 3Department of Pediatric Hematology/Oncology, University Medical Center Hamburg Eppendorf, Hamburg, Germany, 4UCSF Benioff Children's Hospital Oakland, Oakland, CA, United States
Synopsis
Postmortem liver ADC values shows a characteristic change over time in the first 16 hours postmortem, which seemed to be influenced by the core body temperature. The postmortem time behavior of liver DWI values could be of interest for postmortem MRI in virtual autopsy.
Purpose
Diagnostic radiology has been playing an increasingly important role in forensic medicine [1,2]. Whereas postmortem computed tomography is already widely available, postmortem magnetic resonance imaging (PMMR) has been shown to have a high diagnostic accuracy for perinatal abnormalities and documentation of pathological findings in the deceased [3-6]. The aim of this study was to assess postmortem changes of the hepatic apparent diffusion coefficient (ADC) at multiple time points in the time interval of 16 hours postmortem in comparison to in vivo controls and to literature data.
Material and Methods
21 patients, all of whom died of natural causes, were examined (11 male, 5 female; mean age 70.2 ± 9.6 years; range: 61 – 85 years, mean body weight 69.2 ± 16.6 kg). The corpses were stored at room temperature until scanning. Initial MRI scans were conducted within a median time interval of 5 hours postmortem (range 2 to 13 hours) and proceeded in intervals of one two hours within the first 16 hours after death. Core body temperature was rectally measured prior to each MRI examination. A control group of 5 healthy subjects (3 male, 2 female; mean age 27.3 ± 6.3 years) was scanned for in vivo ADC values. All examinations were performed on a 1.5 Tesla MRI scanner using a surface body-coil. For the morphological orientation a localizer and a half Fourier-acquired single shot turbo spin echo (HASTE) -sequence (TR 1840 ms, TE 125 ms, FoV 350 mm, slice thickness 0.7 cm) in transverse, coronal and sagittal orientation was performed. A diffusion-weighted spin echo echo-planar sequence (TR 3000 ms; TE 74 ms; FOV 262 x 350 mm; matrix 115 x 192 mm; slice thickness 6 mm; gap 1.5 mm; voxel size 0.9x0.9x5 mm3; 20 slices, and NEX 10) was generated in transverse orientation. A total of 2 averages were acquired.Results
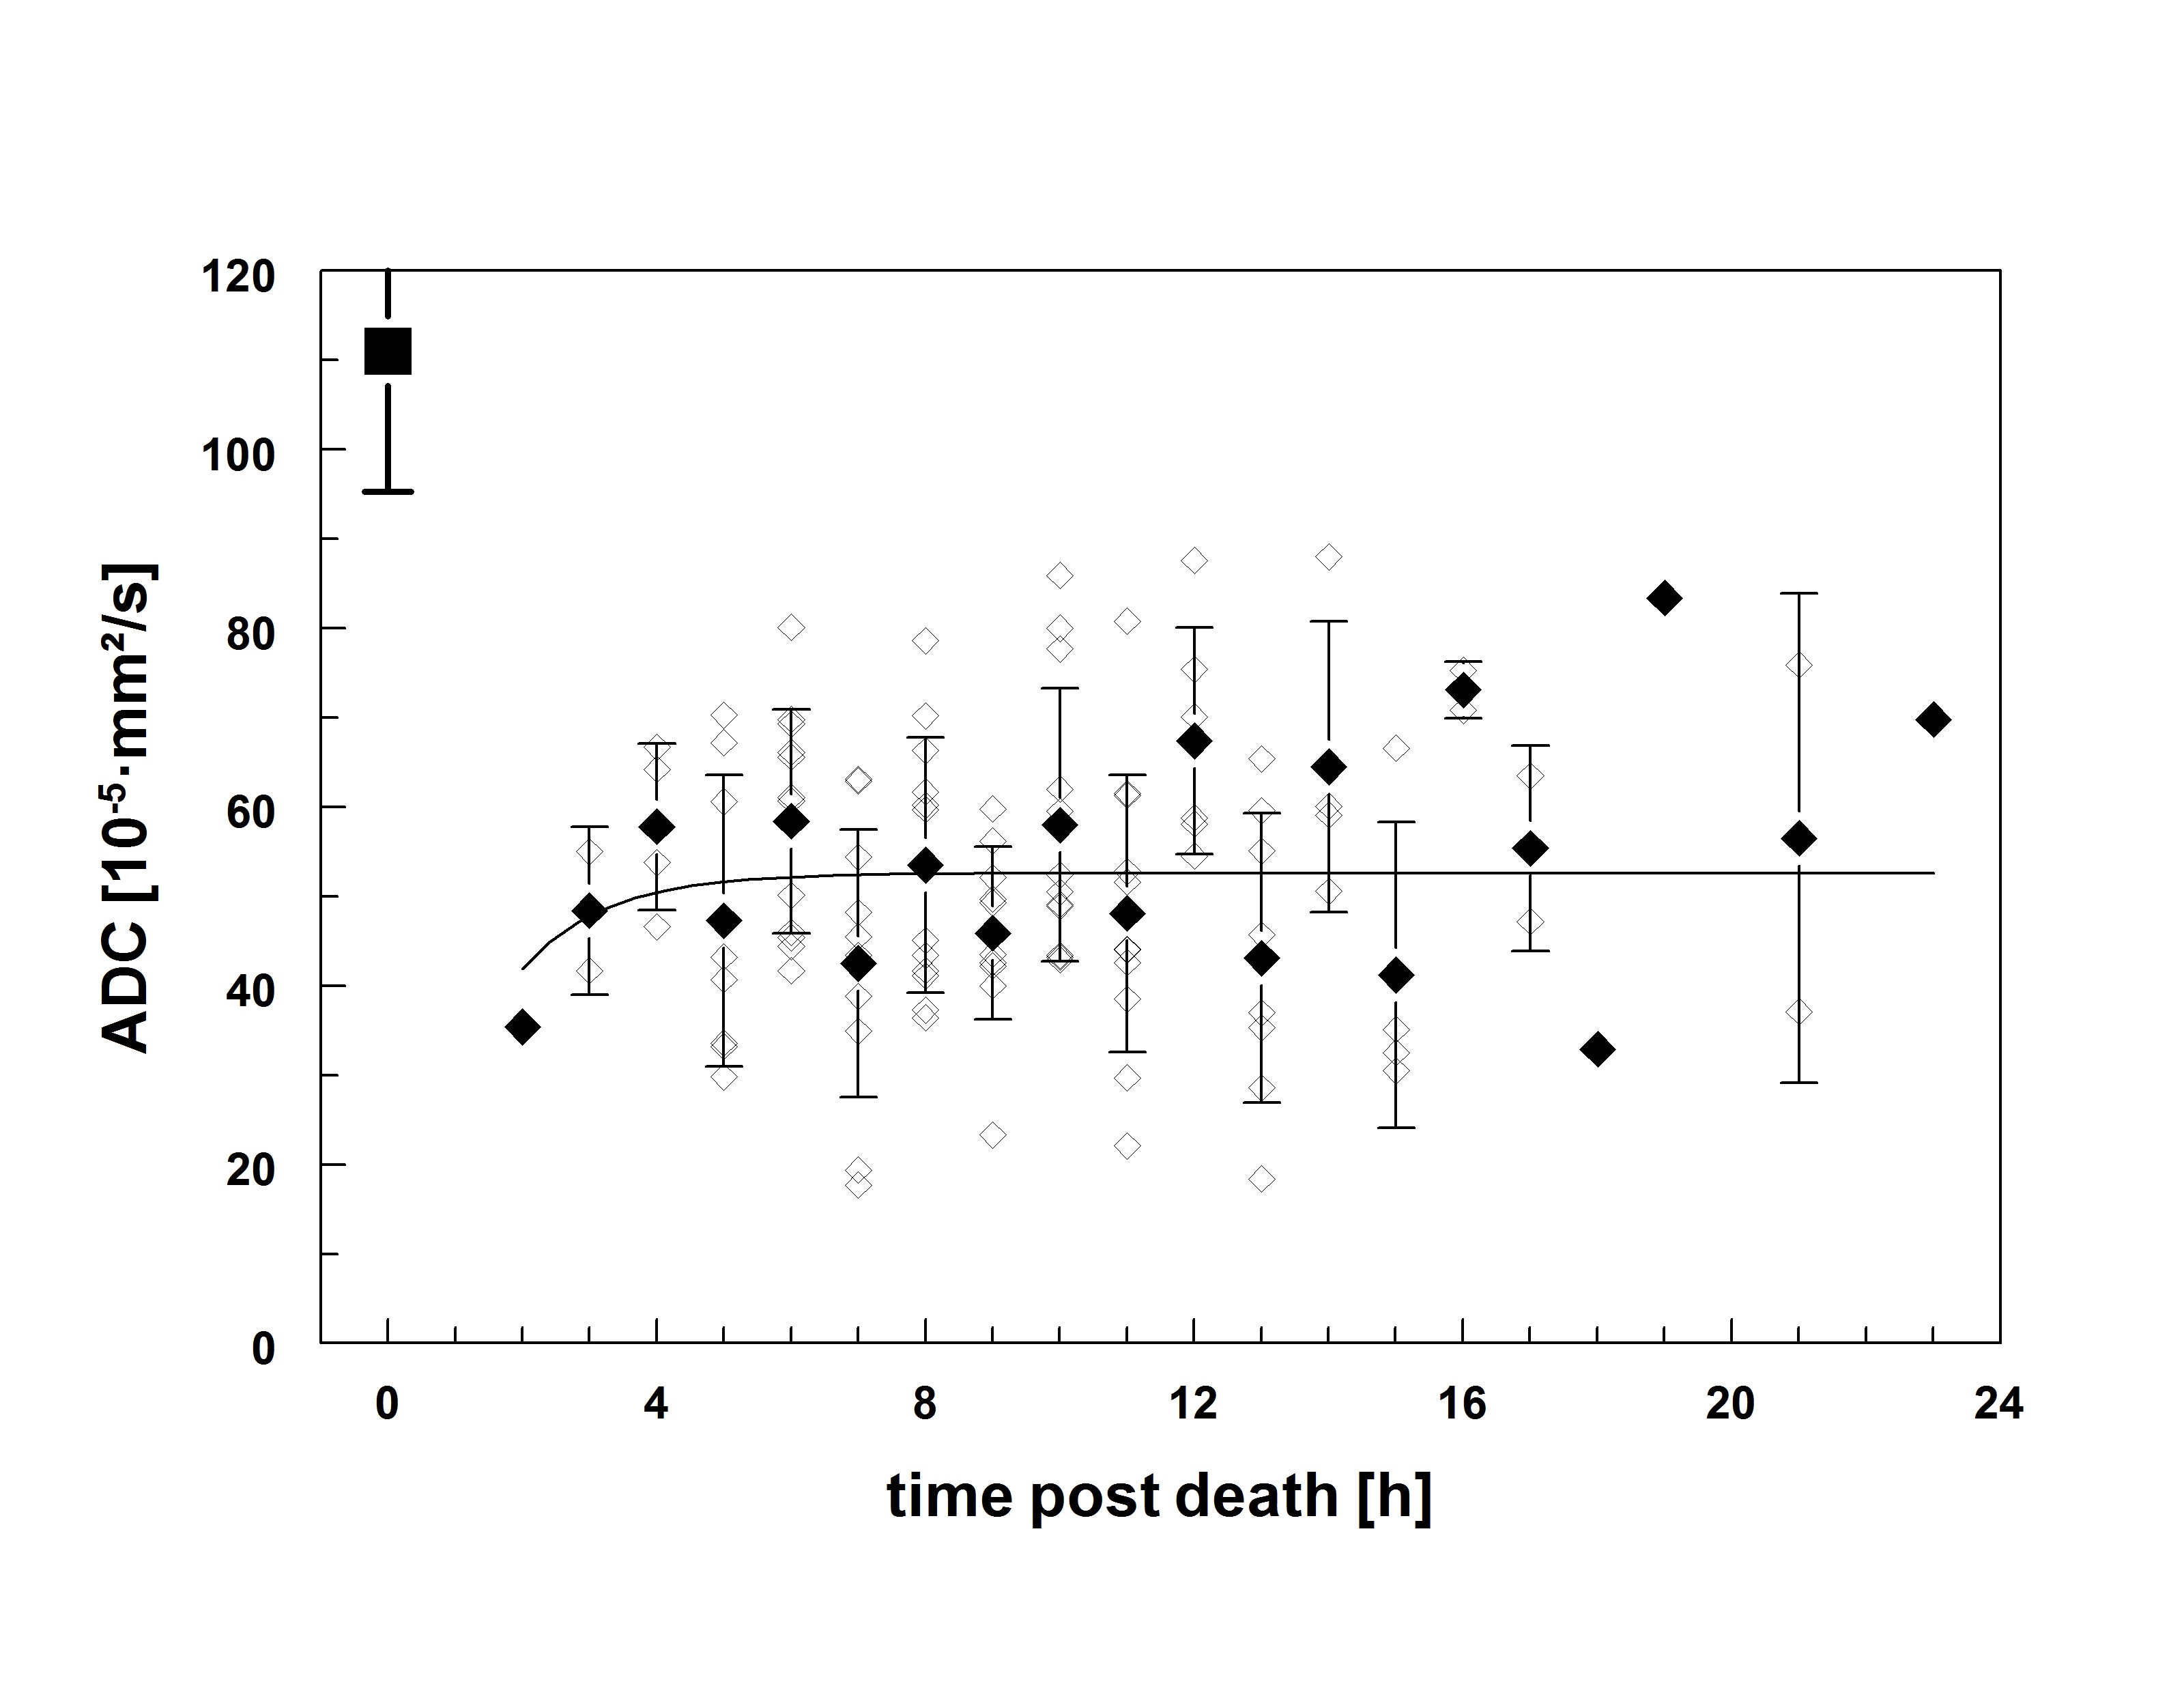
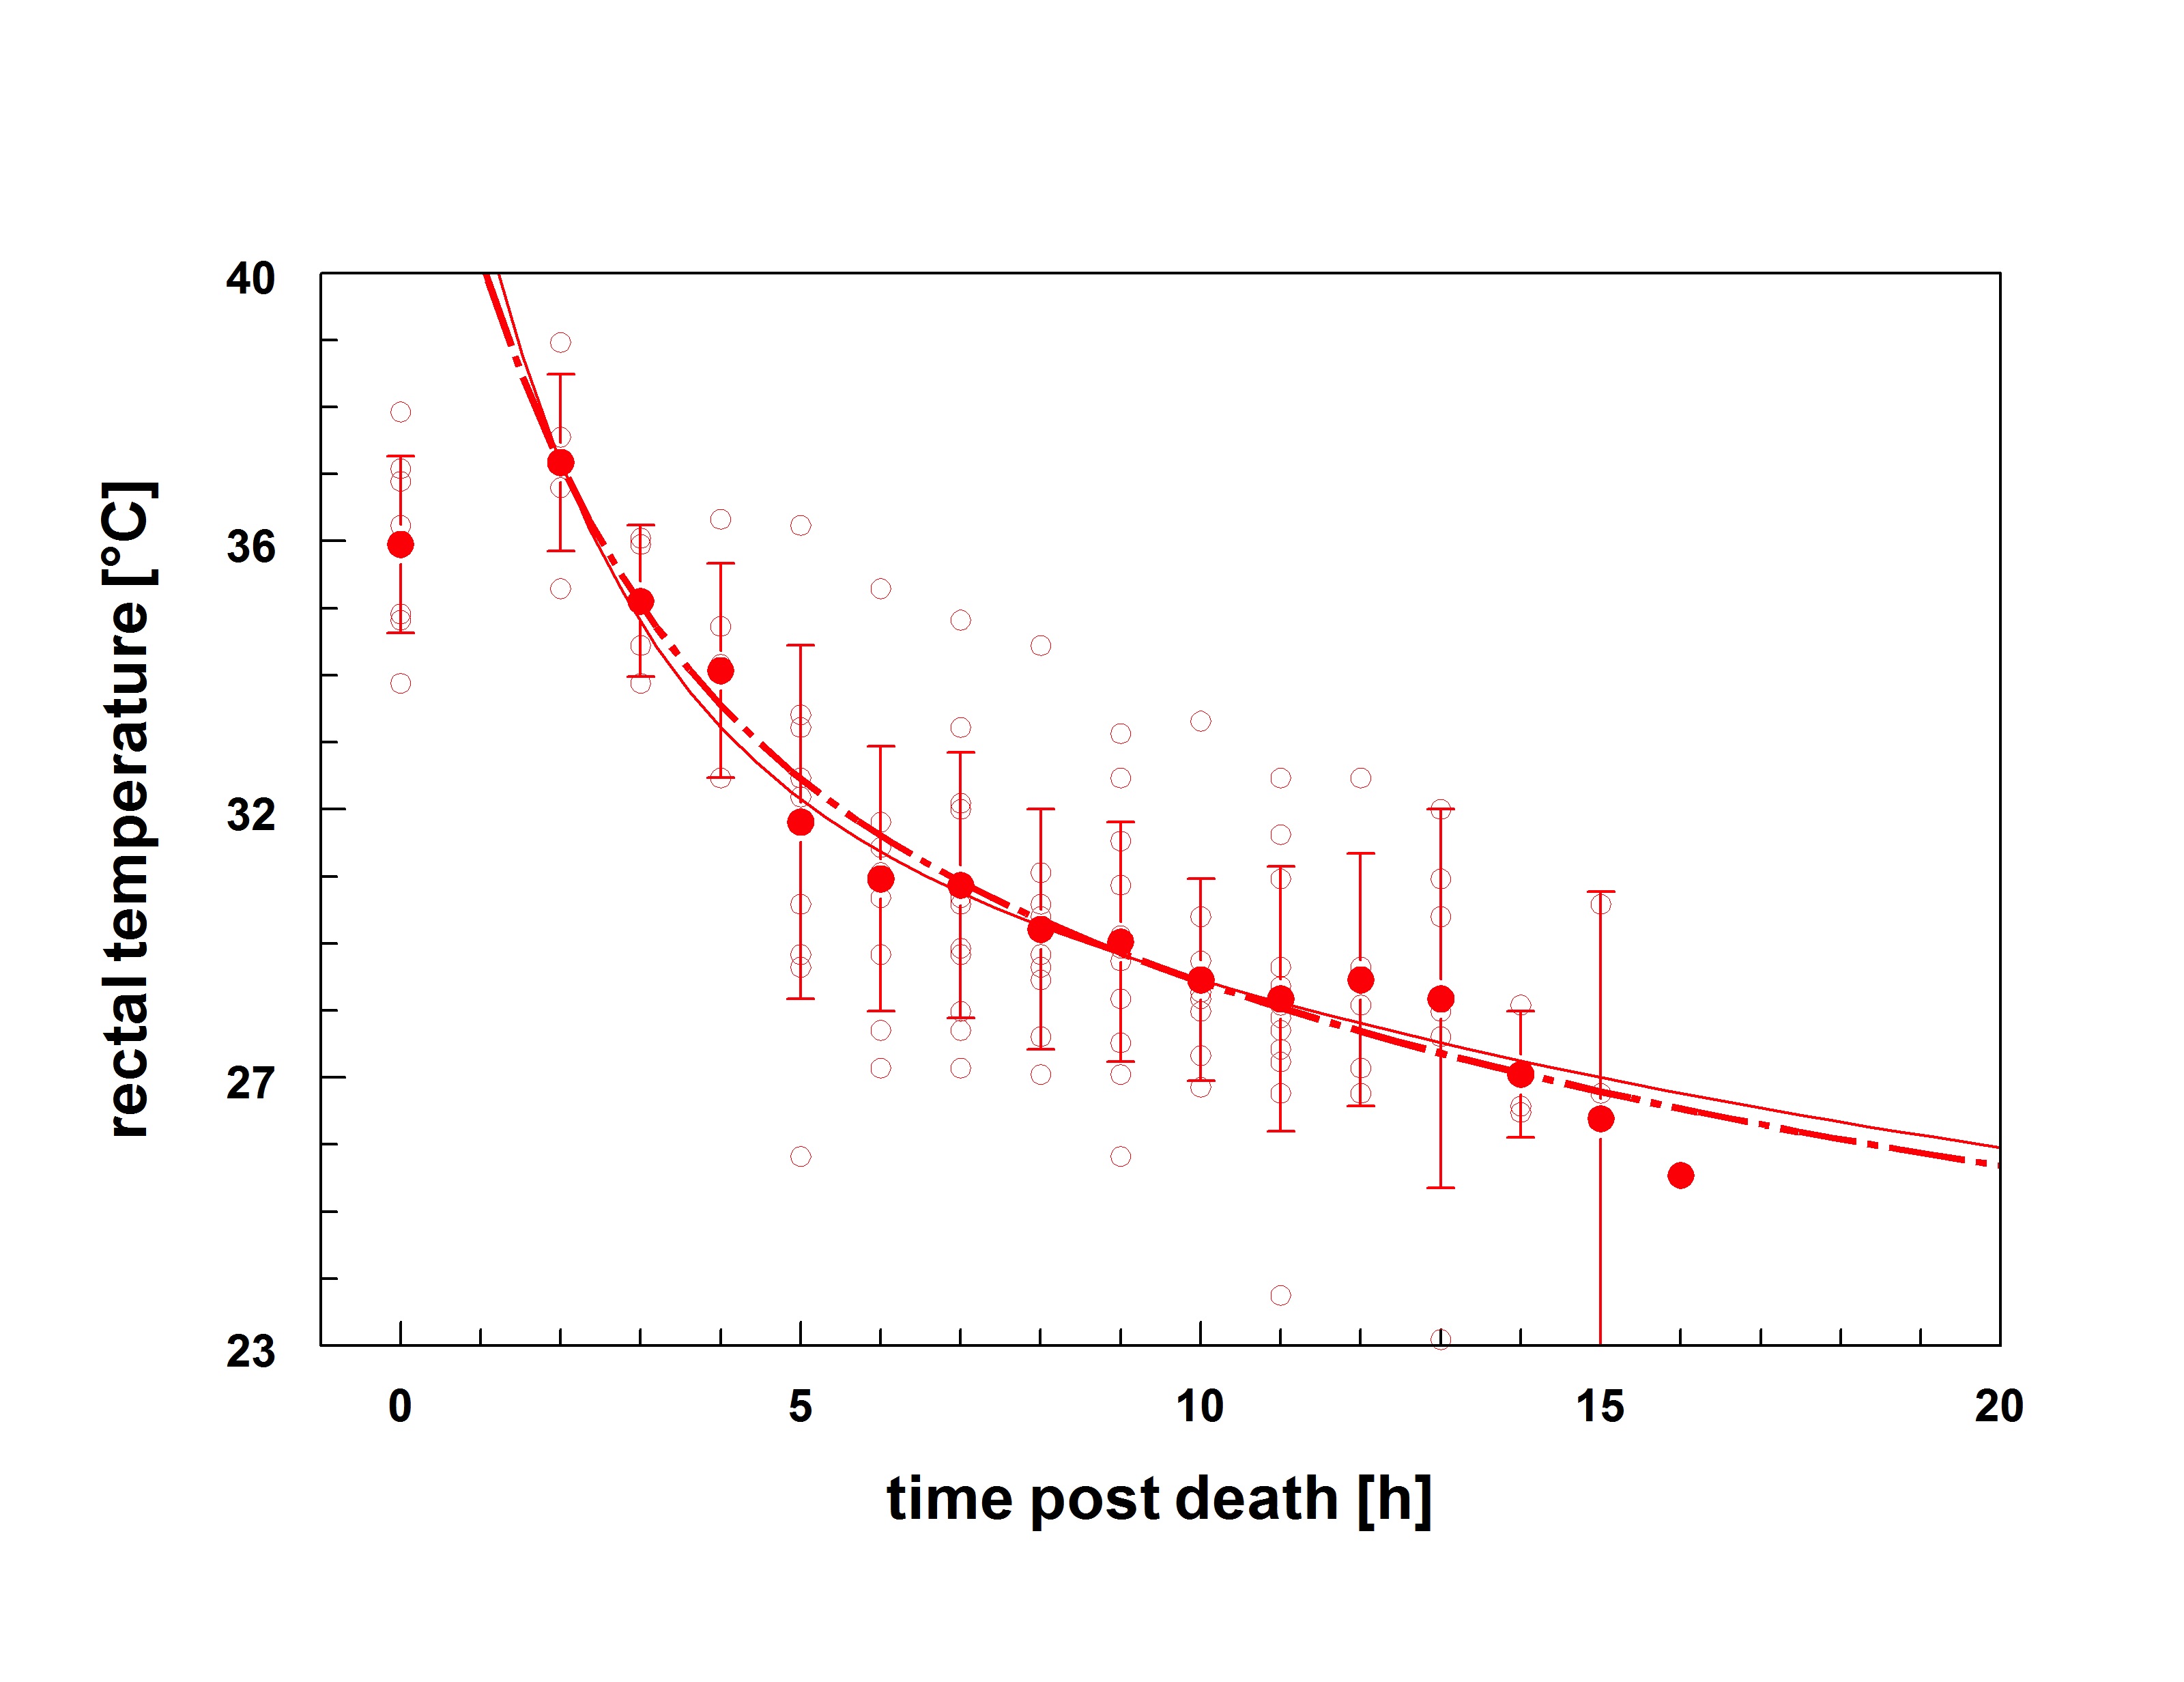
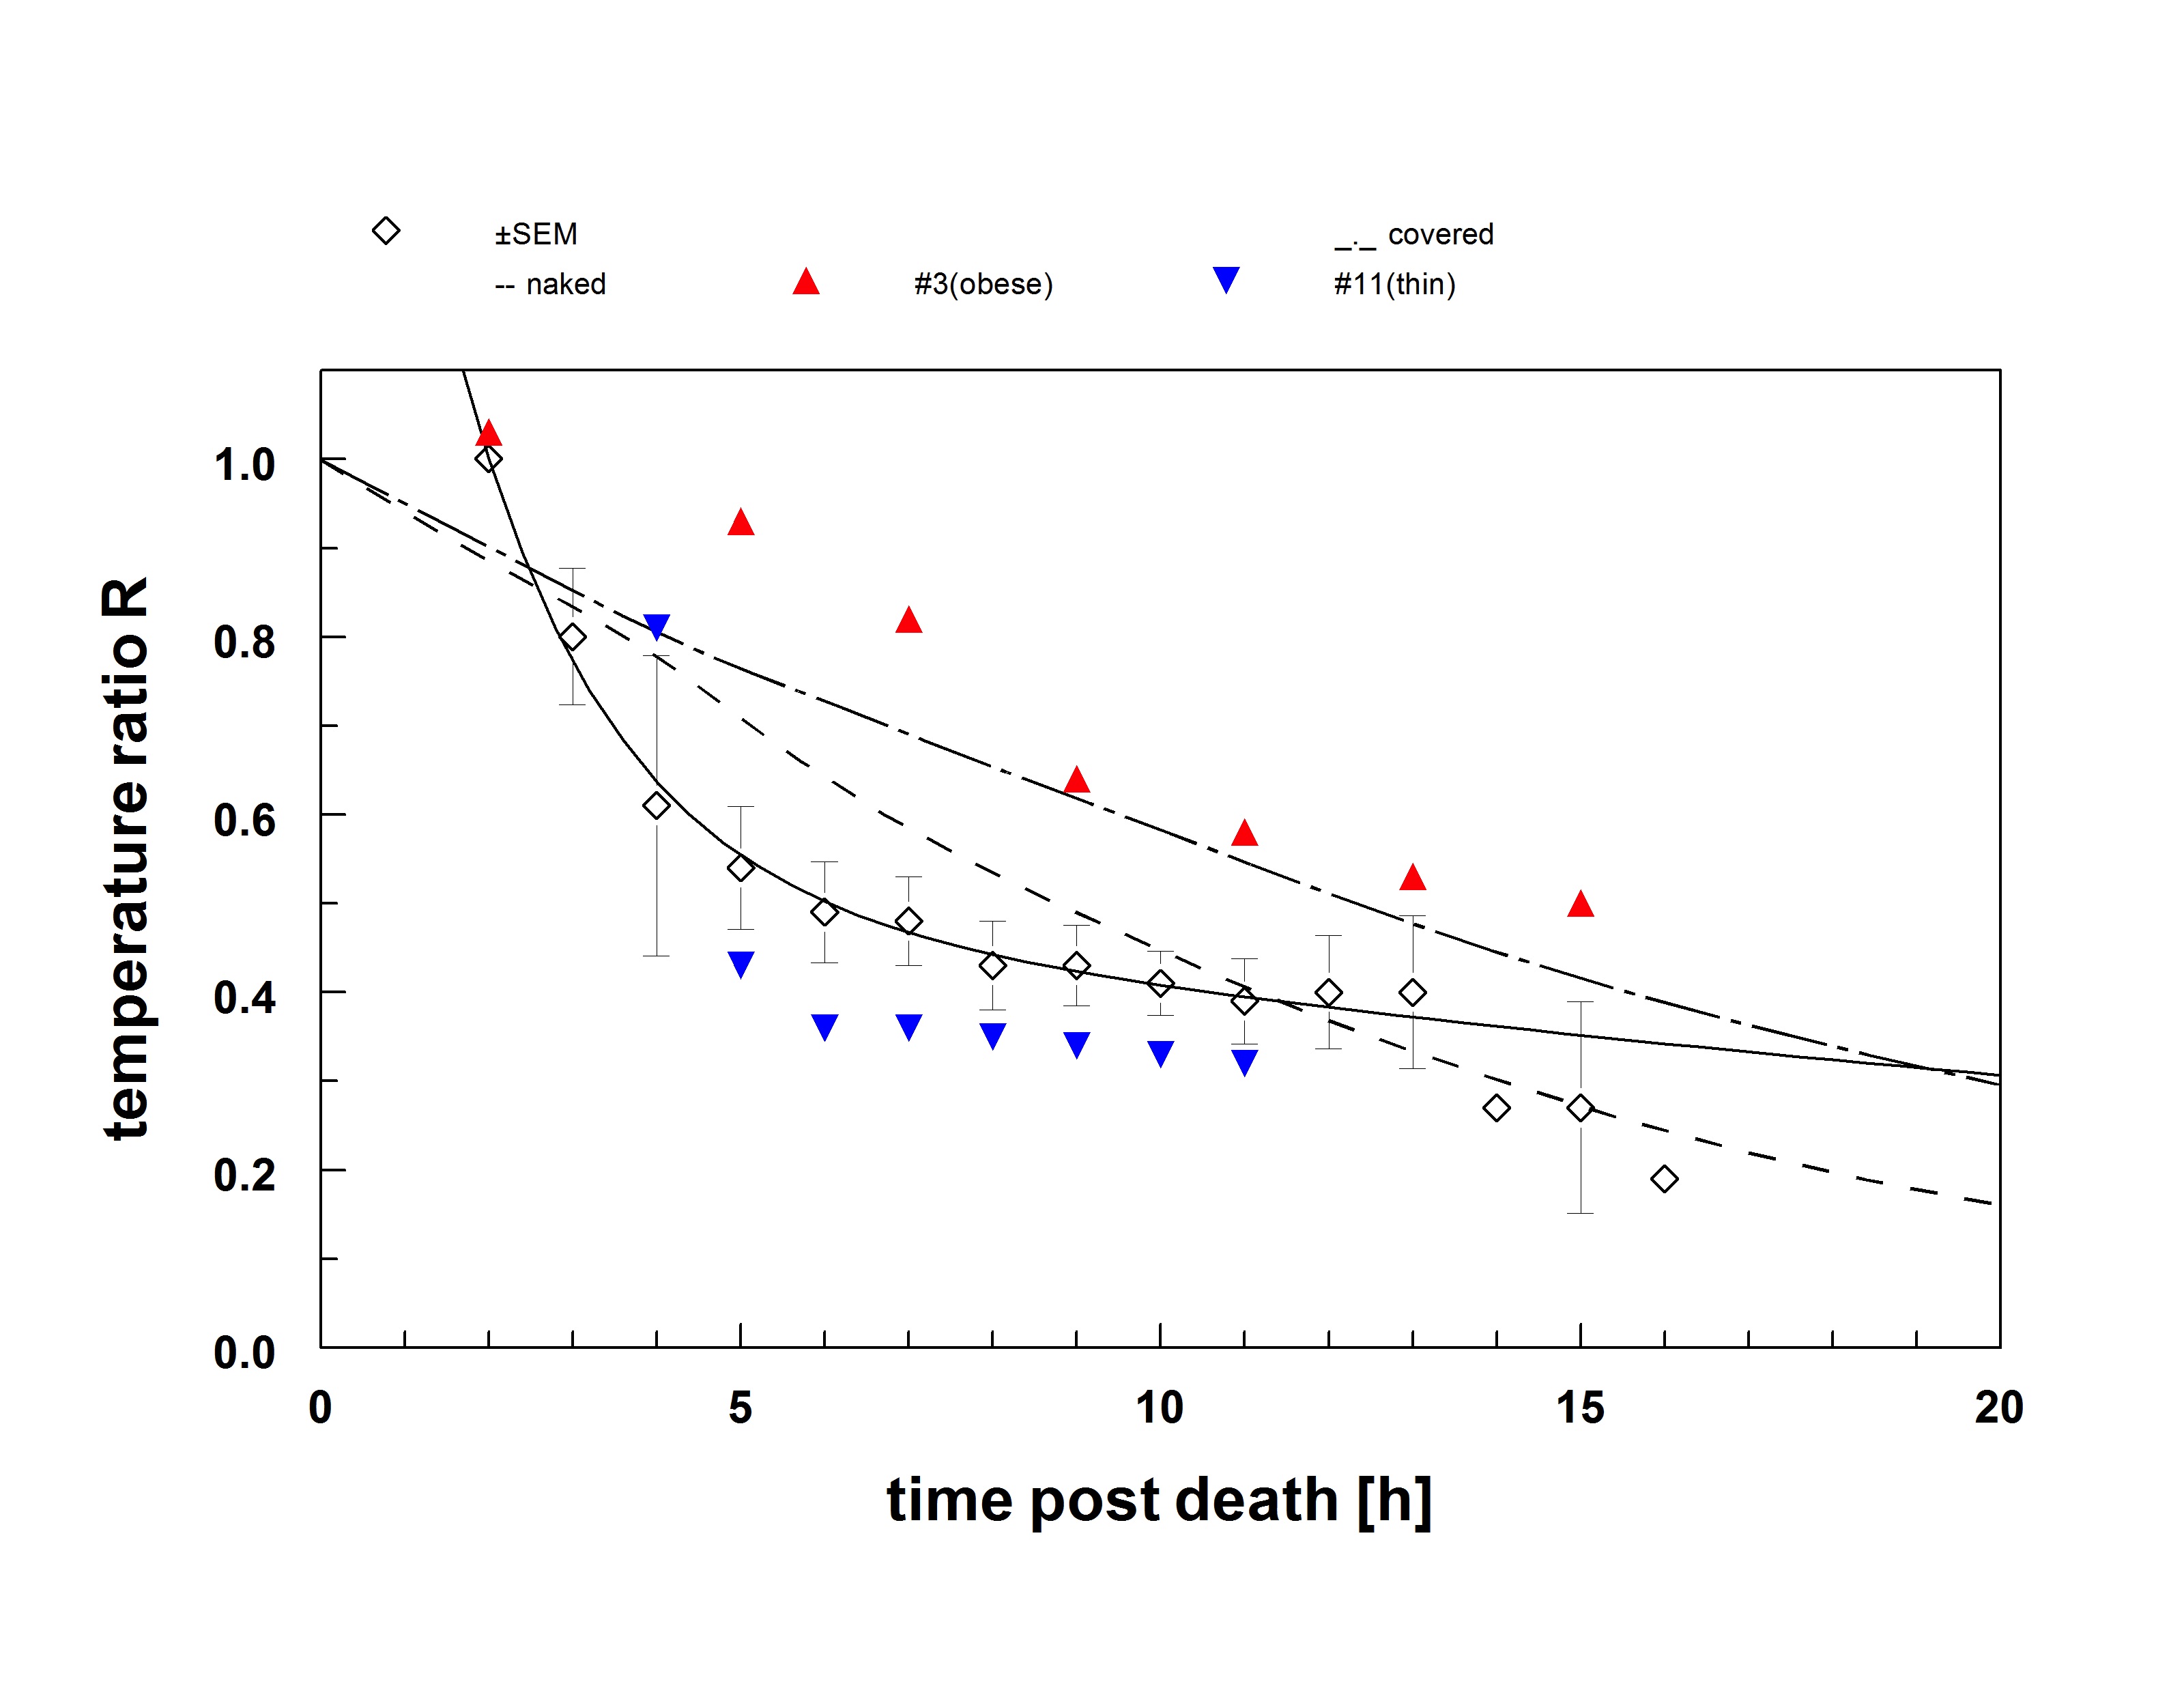
The ex vivo temperature corrected median liver ADC was 74.2 ± 13.4 · 10-5 mm2/s (range 39.6 to 96.3 · 10-5 mm2/s) and differed significantly from in vivo median ADC values of 113.7 ± 8.4 · 10-5 mm2/s (range 96.9 to 136.5 · 10-5 mm2/s), p< 0.0001. Figure 1a/b illustrates the postmortem time course of ADC values on the one hand and the temperature drop over the same time course on the other. Both the RL and LL showed a characteristic change in ADC values over time. ADC measurement at 2 hours p.m. was achievable in one patient showing a mean ADC (± SEM) of 39.6 ± 0.0 · 10-5 mm2/s. Averaged for both liver lobes, there was an increase in the mean ADC (± SEM) from 55.5 ± 4.0 · 10-5 mm2/s (3 h p.m.) (n=3) to 77.3 ± 18.7 · 10-5 mm2/s (4 h p.m.) (n=5), followed by a plateau between 77.3 ± 18.7 · 10-5 mm2/s to 78.4 ± 12.9 · 10-5 mm2/s (n=3-13), 4 to 14 hours p.m. At 15 hours p.m., the ADC reached 95.0 ± 32.7 · 10-5 mm2/s (n=3) with a high variability both from case to case and within time measured. In the examined time interval, the individual average ADC (averaged over both the RL and LL) inversely correlated to the core body temperature (r= -0.42; Confidence Interval -0.83 to -0.66, p< 0.0001). An exponential relationship (r² = 0.22) was shown with a decline of (0.4±0.2)·10-5 mm²s-1°C-1at low temperatures (< 28 °C, 6-16 h postmortem) (Figure 2).Discussion
This study demonstrates that diffusion capacities of the liver undergo time-specific changes after death, which can be assessed using postmortem repetitive MRI-scans. Compared to a recently published postmortem study of Arthurs et al. [7] the ADC (± SD) obtained over all time points in this study appeared slightly lower (74.2 ± 13.4 · 10-5 mm2/s vs. 88.0 ± 39.0 · 10-5 ± mm2/s). This difference could be explained by the selection of the ex vivo study cohort (adults in our study, versus fetal and childhood cases in the Arthurs study) [8]. The prior study only examined one time point after death, which the authors describe as one limitation of their study. The core body temperature stayed stable between 4 to 14 hours postmortem (Figure 1a/b). Despite temperature correction, the maintenance of core body temperature in corpses stored at room temperature corresponded inversely to ADC data (Figure 2). The effect of body temperature on in vivo and postmortem MR-quantification of T1, T2 and PD sequences has been previously demonstrated [9,10].Conclusion
Hepatic ADC values show a characteristic change in the immediate 16 hours postmortem, which seems to be influenced by the body core temperature. With the knowledge of the postmortem time behavior liver diffusion-weighted imaging could be added to conventional postmortem MRI in virtual autopsy.Acknowledgements
No acknowledgement found.References
1. Farina J, Millana C, Fdez-Acenero MJ, Furio V, Aragoncillo P, Martin VG, Buencuerpo J (2002) Ultrasonographic autopsy (echopsy): a new autopsy technique. Virchows Arch 440 (6):635-639. doi:10.1007/s00428-002-0607-z
2. Brogdon BG (2000) Scope of forensic radiology. Crit Rev Diagn Imaging 41 (1):43-67
3. Arthurs OJ, Price GC, Carmichael DW, Jones R, Norman W, Taylor AM, Sebire NJ (2015) Diffusion-weighted perinatal postmortem magnetic resonance imaging as a marker of postmortem interval. Eur Radiol 25 (5):1399-1406. doi:10.1007/s00330-014-3525-y
4. Breeze AC, Jessop FA, Set PA, Whitehead AL, Cross JJ, Lomas DJ, Hackett GA, Joubert I, Lees CC (2011) Minimally-invasive fetal autopsy using magnetic resonance imaging and percutaneous organ biopsies: clinical value and comparison to conventional autopsy. Ultrasound Obstet Gynecol 37 (3):317-323. doi:10.1002/uog.8844
5. Thayyil S, De Vita E, Sebire NJ, Bainbridge A, Thomas D, Gunny R, Chong K, Lythgoe MF, Golay X, Robertson NJ, Cady EB, Taylor AM (2012) Post-mortem cerebral magnetic resonance imaging T1 and T2 in fetuses, newborns and infants. Eur J Radiol 81 (3):e232-238. doi:10.1016/j.ejrad.2011.01.105
6. Thayyil S, Sebire NJ, Chitty LS, Wade A, Chong W, Olsen O, Gunny RS, Offiah AC, Owens CM, Saunders DE, Scott RJ, Jones R, Norman W, Addison S, Bainbridge A, Cady EB, Vita ED, Robertson NJ, Taylor AM, group Mc (2013) Post-mortem MRI versus conventional autopsy in fetuses and children: a prospective validation study. Lancet 382 (9888):223-233. doi:10.1016/S0140-6736(13)60134-8
7. Arthurs OJ, Price GC, Carmichael DW, Jones R, Norman W, Taylor AM, Sebire NJ (2015) Diffusion-weighted perinatal postmortem magnetic resonance imaging as a marker of postmortem interval. Eur Radiol 25 (5):1399-1406. doi:10.1007/s00330-014-3525-y
8. Kozak LR, Bango M, Szabo M, Rudas G, Vidnyanszky Z, Nagy Z (2010) Using diffusion MRI for measuring the temperature of cerebrospinal fluid within the lateral ventricles. Acta Paediatr 99 (2):237-243. doi:10.1111/j.1651-2227.2009.01528.x
9. Zech WD, Schwendener N, Persson A, Warntjes MJ, Jackowski C (2015) Temperature dependence of postmortem MR quantification for soft tissue discrimination. Eur Radiol 25 (8):2381-2389. doi:10.1007/s00330-015-3588-4
10. Le Bihan D, Delannoy J, Levin RL (1989) Temperature mapping with MR imaging of molecular diffusion: application to hyperthermia. Radiology 171 (3):853-857. doi:10.1148/radiology.171.3.2717764
Figures