3201
Whole-lesion apparent diffusion coefficient histogram analysis: significance in T and N staging of gastric cancers1Department of Radiology, Drum Tower Hospital, School of Medicine, Nanjing University, Nanjing, China, 2Philips Healthcare, Shanghai, Shanghai, China
Synopsis
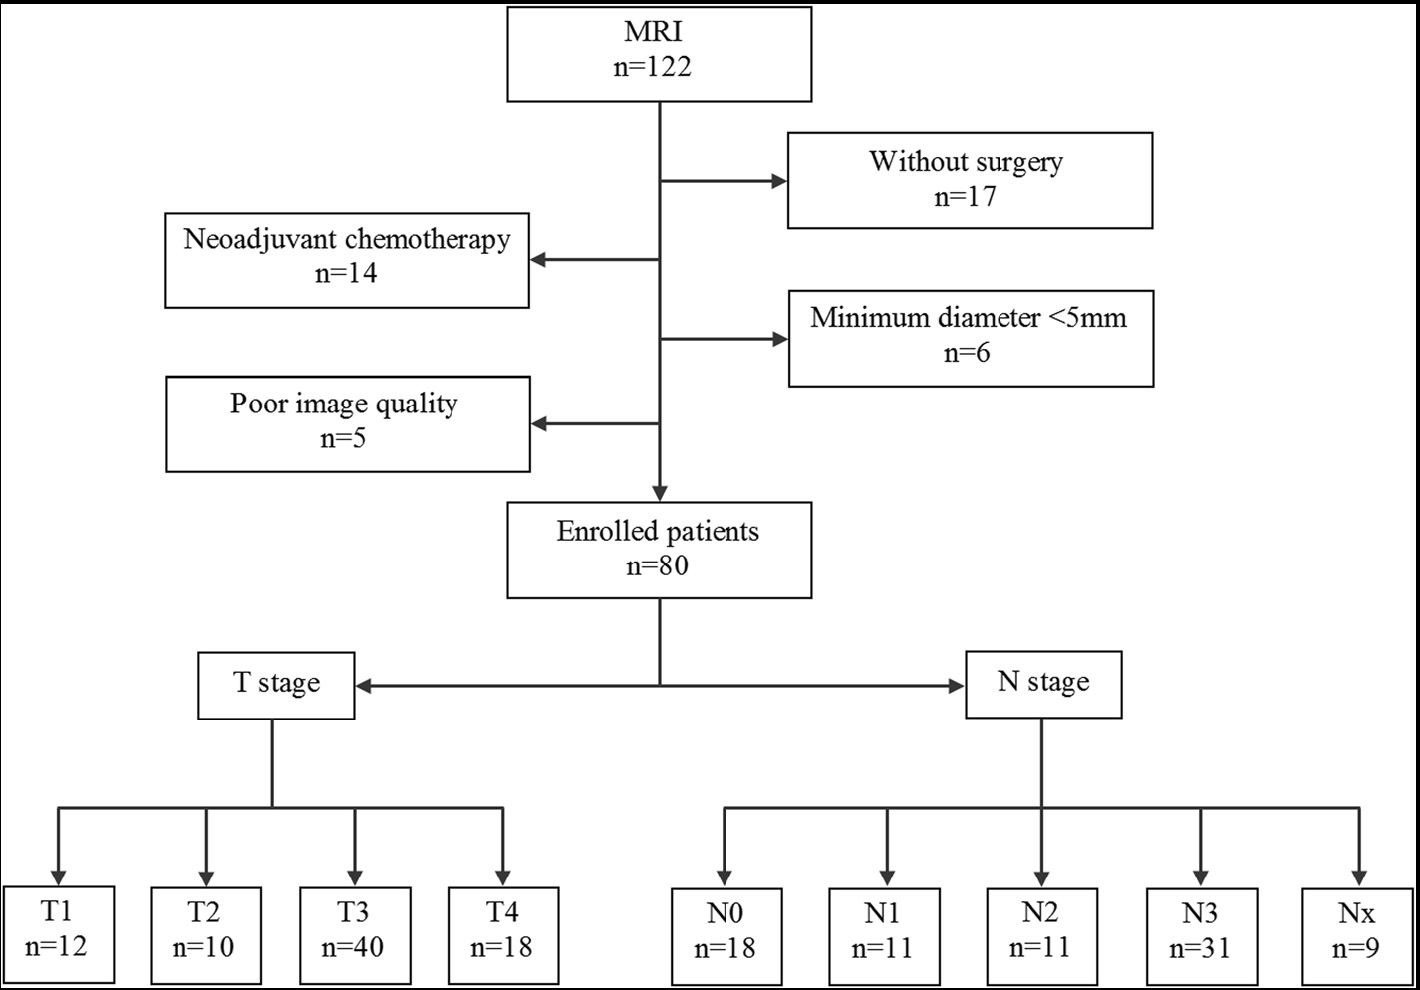
Eighty patients with pathologically confirmed gastric carcinomas underwent DWI-MR imaging before surgery prospectively. Whole-lesion ADC histogram analysis was performed. The differences of ADC histogram parameters among different T and N stages were compared with independent-samples Kruskal-Wallis test. ROC analysis was performed to evaluate the performance of ADC histogram parameters in differentiating particular T or N stages of gastric cancers.There were significant differences of all the ADC histogram parameters at different T (except ADCmin and ADCmax) and N (except ADCmax) stages. Whole-volume ADC histogram parameters held great potential in differentiating different T and N stages of gastric cancers preoperatively.
INTRODUCTION
Whole-lesion apparent diffusion coefficient (ADC) histogram analysis has been introduced and proved effective in assessment of multiple tumors. However, the application of whole-volume ADC histogram analysis in gastrointestinal tumors has just started and never been reported in T and N staging of gastric cancers.METHODS
Eighty patients with pathologically confirmed gastric carcinomas underwent diffusion weighted (DW) magnetic resonance imaging before surgery prospectively. Whole-lesion ADC histogram analysis was performed by two radiologists independently. The differences of ADC histogram parameters among different T and N stages were compared with independent-samples Kruskal-Wallis test. Receiver operating characteristic (ROC) analysis was performed to evaluate the performance of ADC histogram parameters in differentiating particular T or N stages of gastric cancers.RESULTS
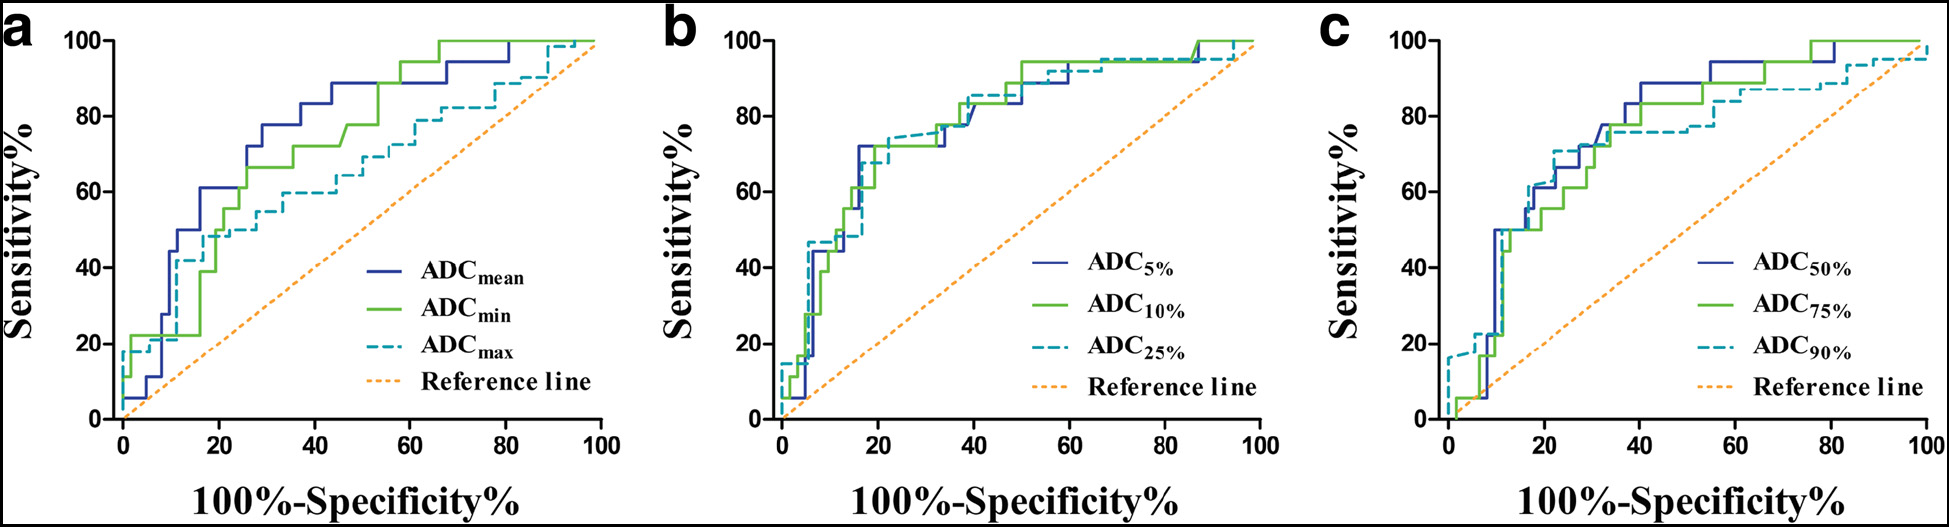
There were significant differences of all the ADC histogram parameters for gastric cancers at different T (except ADCmin and ADCmax) and N (except ADCmax) stages. Most ADC histogram parameters differed significantly between T1 vs T3, T1 vs T4, T2 vs T4, N0 vs N1, N0 vs N3, and some parameters (ADC5%, ADC10%, ADCmin) differed significantly between N0 vs N2, N2 vs N3 (all P < 0.05). Most parameters except ADCmax performed well in differentiating different T and N stages of gastric cancers. Especially for identifying patients with and without lymph node metastasis, the ADC10% yielded the largest area under the ROC curve of 0.794 (95% confidence interval, 0.677-0.911). All the parameters except ADCmax showed excellent inter-observer agreement with intra-class correlation coefficients higher than 0.800.DISCUSSION
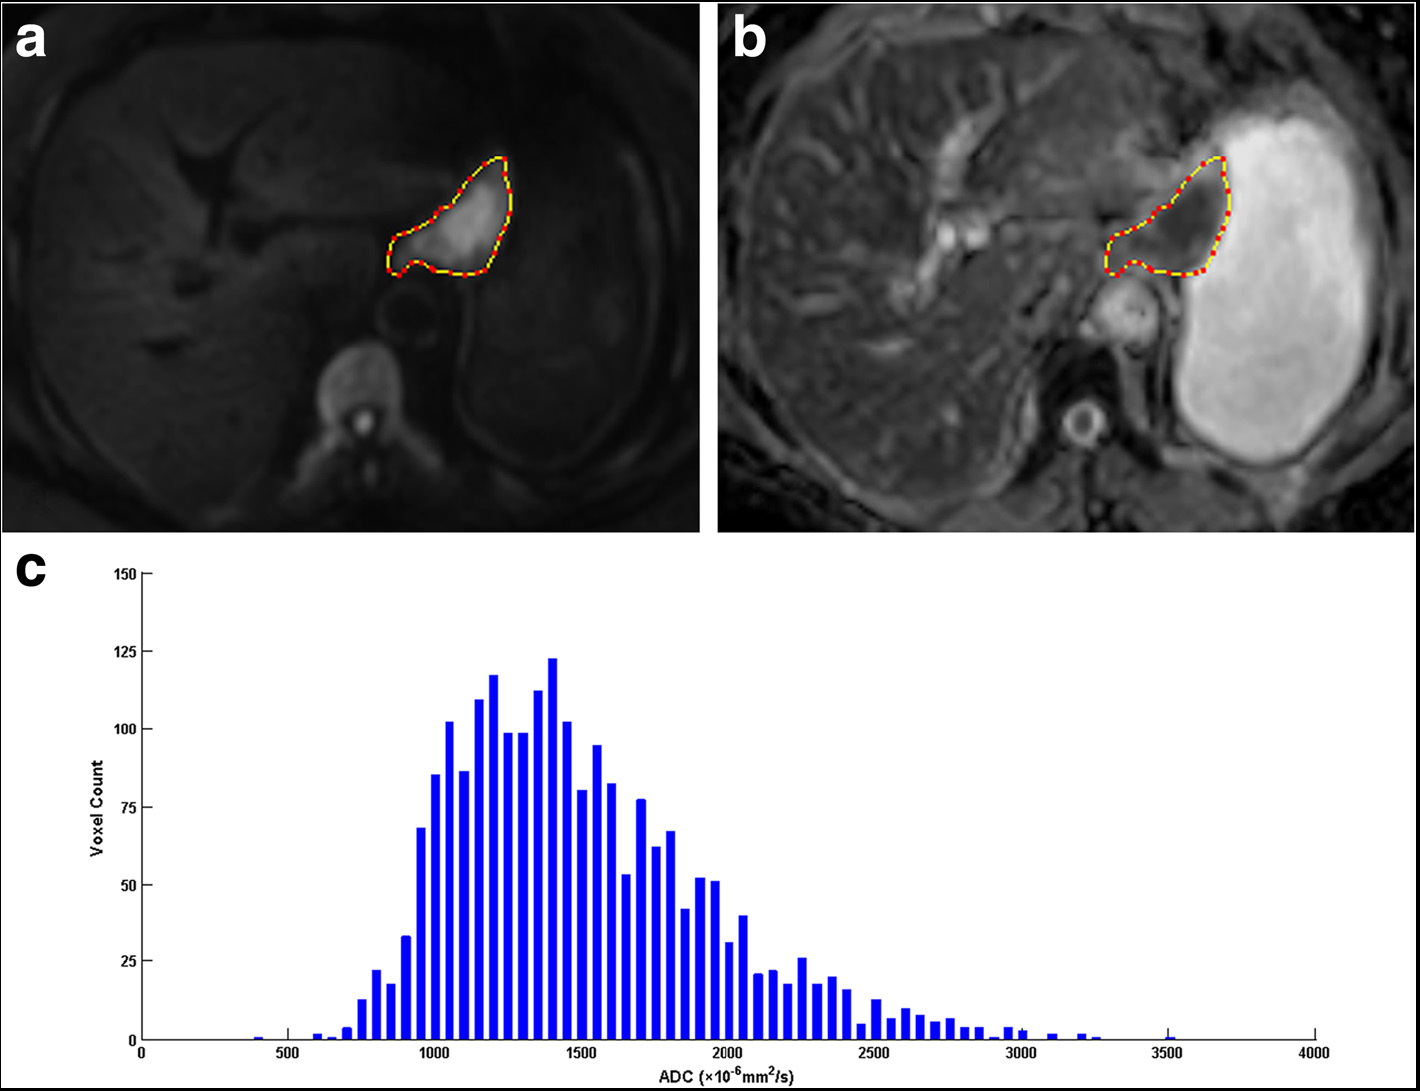
The ADC histogram parameters in this study were derived from the whole volume of the lesion, which avoided the sampling error of drawing an ROI within the tumor. All the parameters showed significant differences in different T stages of gastric cancers except ADCmin and ADCmax. Different percentiles reflected certain features of different components of the whole lesion. Lower percentiles corresponded to the most solid, condense and malignant components, while higher percentiles represented as somewhat loose, cystic or necrotic tissues. As the tumor progresses in terms of T staging, it appears more malignant with higher cellular density, larger nucleus and more disordered arrangement, leading to greater limitation to the water molecular diffusion and resulting in lower ADC values. Therefore, gastric cancers at higher T stages showed lower values of ADC percentiles than those at lower T stages. Furthermore, multiple ADC histogram parameters differed significantly between N0 vs N1, N0 vs N2, N0 vs N3, N2 vs N3, which suggested a negative relationship between ADC histogram parameters and N stage. Lymph node metastasis is a complex biological process involving multiple factors, among which the features of primary tumor undoubtedly play a critical role in this event.1, 2 Different components within the primary tumor hold different metastatic potentials to lymph nodes. Based on our findings, the lower ADC percentiles, which corresponded to more malignant components, showed closer correlations with N staging compared with higher percentiles. The lower ADC percentiles performed well in differentiating gastric cancer patients with and without lymph node metastasis. Especially the parameter ADC10% showed a sensitivity of 72.2% and a specificity of 80.6%, which was even higher than multiple indexes from lymph node itself in previous studies. For instance, Fairweather M. et al. reported an accuracy of 42.9% and 56.0% with endoscopic ultrasonography and CT for evaluating the nodal status in gastric cancers, respectively.3 Maccioni F. et al. reported an accuracy of 68% with MR imaging in N staging of gastric cancers.4 Nevertheless, lymph node metastasis is a complicated process influenced by multiple factors, so we will integrate more comprehensive factors in order to make a more accurate prediction in our future work.CONCLUSION
Whole-volume ADC histogram parameters held great potential in differentiating different T and N stages of gastric cancers preoperatively.
Acknowledgements
No acknowledgement found.References
1. Xu YY, Huang BJ, Sun Z, et al. Risk factors for lymph node metastasisand evaluation of reasonable surgery for early gastric cancer. World JGastroenterol. 2007;13(38):5133–8.
2. Jin EH, Lee DH, Jung SA, et al. Clinicopathologic factors and molecular markers related to lymph nodemetastasis in early gastric cancer. World J Gastroenterol. 2015;21(2):571–7.
3. Fairweather M, Jajoo K, Sainani N, et al. Accuracy of EUSand CT imaging in preoperative gastric cancer staging. J Surg Oncol. 2015;111(8):1016–20.
4. Maccioni F, Marcelli G, Al Ansari N,et al. Preoperative T and N staging ofgastric cancer: magnetic resonance imaging (MRI) versus multi detectorcomputed tomography (MDCT). Clin Ter. 2010;161(2):e57–62.
Figures