3196
A pilot study of the effect of high pressure renal pelvic perfusion on the renal microstructure and microcirculation using multiparametric magnetic resonance imaging (mpMRI)1The First Affiliated Hospital of Wenzhou Medical University, Wenzhou, China
Synopsis
Multiparametric MRI is widely used for tissue characterization. High pressure perfusion is commonly used in endoscopic surgery. In this study we compared the quantitative change of renal microstructure and microcirculation using DTI and simplified intravoxel incoherent motion imaging (sIVIM) in an operation simulating high pressure renal pelvic perfusion in the process of endoscopic surgery. Additionally, we compared the cortical and medullar difference. The results of this pilot study showed the feasibility of mpMRI to characterize renal physiology and investigate its quantitative change, with the potential value in early detection of renal function. But further study with larger sample size is required to draw a clear conclusion.
Abstract
Introduction
The incidence of kidney stones has increased in China, while its incidence in the south of China is as high as 5~10%. Currently, the endoscopic surgery is the main treatment option for kidney stone. However high pressure perfusion is required during the operation to keep the field of view clear, accompanied with renal physiology affected (1, 2). This pilot work intends to study the effects of high pressure renal pelvic perfusion on the renal microstructure and microcirculation using mpMRI.
Methods
Five New Zealand rabbits with the age of 2 to 3 months were used in this study. 2% pentobarbital sodium (dose: 3 ml/kg) combined with Xylazine Hydrochloride (dose: 0.2 ml/kg) was injected intramuscularly for anesthesia. The surgery was performed on the left kidney. Perfusion tube was planted into renal pelvis and connected to a perfusion setup filled with saline. Perfusion pressure was set at 50mmHg with temperature 25℃ for 2min to simulate internal pressure and temperature of the renal pelvis in the process of endoscopic surgery. MRI was performed before and after surgery.
MRI was carried out on 3.0T scanner (Achieva, Philips Healthcare, The Netherlands) equipped with heart coil. MpMRI protocol included T2WI in sagittal and axial directions followed by DTI and simplified intravoxel incoherent motion imaging (sIVIM). DTI was acquired with single-shot spin-echo EPI sequence: TE/TR=82/1344ms, FOV=95×148mm2, sth=3.0mm with gap=0.5mm, NA=4, b-values=0, 500 s/mm2 in 6 directions, SENSE=2.0, scan time=5min18sec. sIVIM was acquired with single-shot spin-echo EPI sequence: TE/TR=87/1344ms, the geometry was identical to DTI, NA=4, 5 b-values=0, 188, 375, 563, 750 s/mm2, SENSE=2.0, scan time=2min54sec. Respiration trigger was applied during MR acquisition.
DTI was analyzed in FSL. FA and MD were used for further analysis. All sIVIM parametric maps were generated using home-developed programming in Matlab (The MathWorks Inc., Natick, MA, USA). ADC was calculated with monoexponential fitting of signal intensities over all b-values. For sIVIM, the influence of pseudo-diffusion and non-Gaussian diffusion could be neglected for the range of b-values used (188≤b≤750, s/mm2) (3,4).
S(b)=S(0)·(fp·δ0(b)+(1-fp)·e-b·Ds)
Where S(b) is the signal intensity, S(0) is the signal intensity at b=0, Ds is the pure tissue diffusion, fp is the volume fraction of pseudo-diffusion. δ0(b)=1 for b=0 and 0 for all other b-values (5).
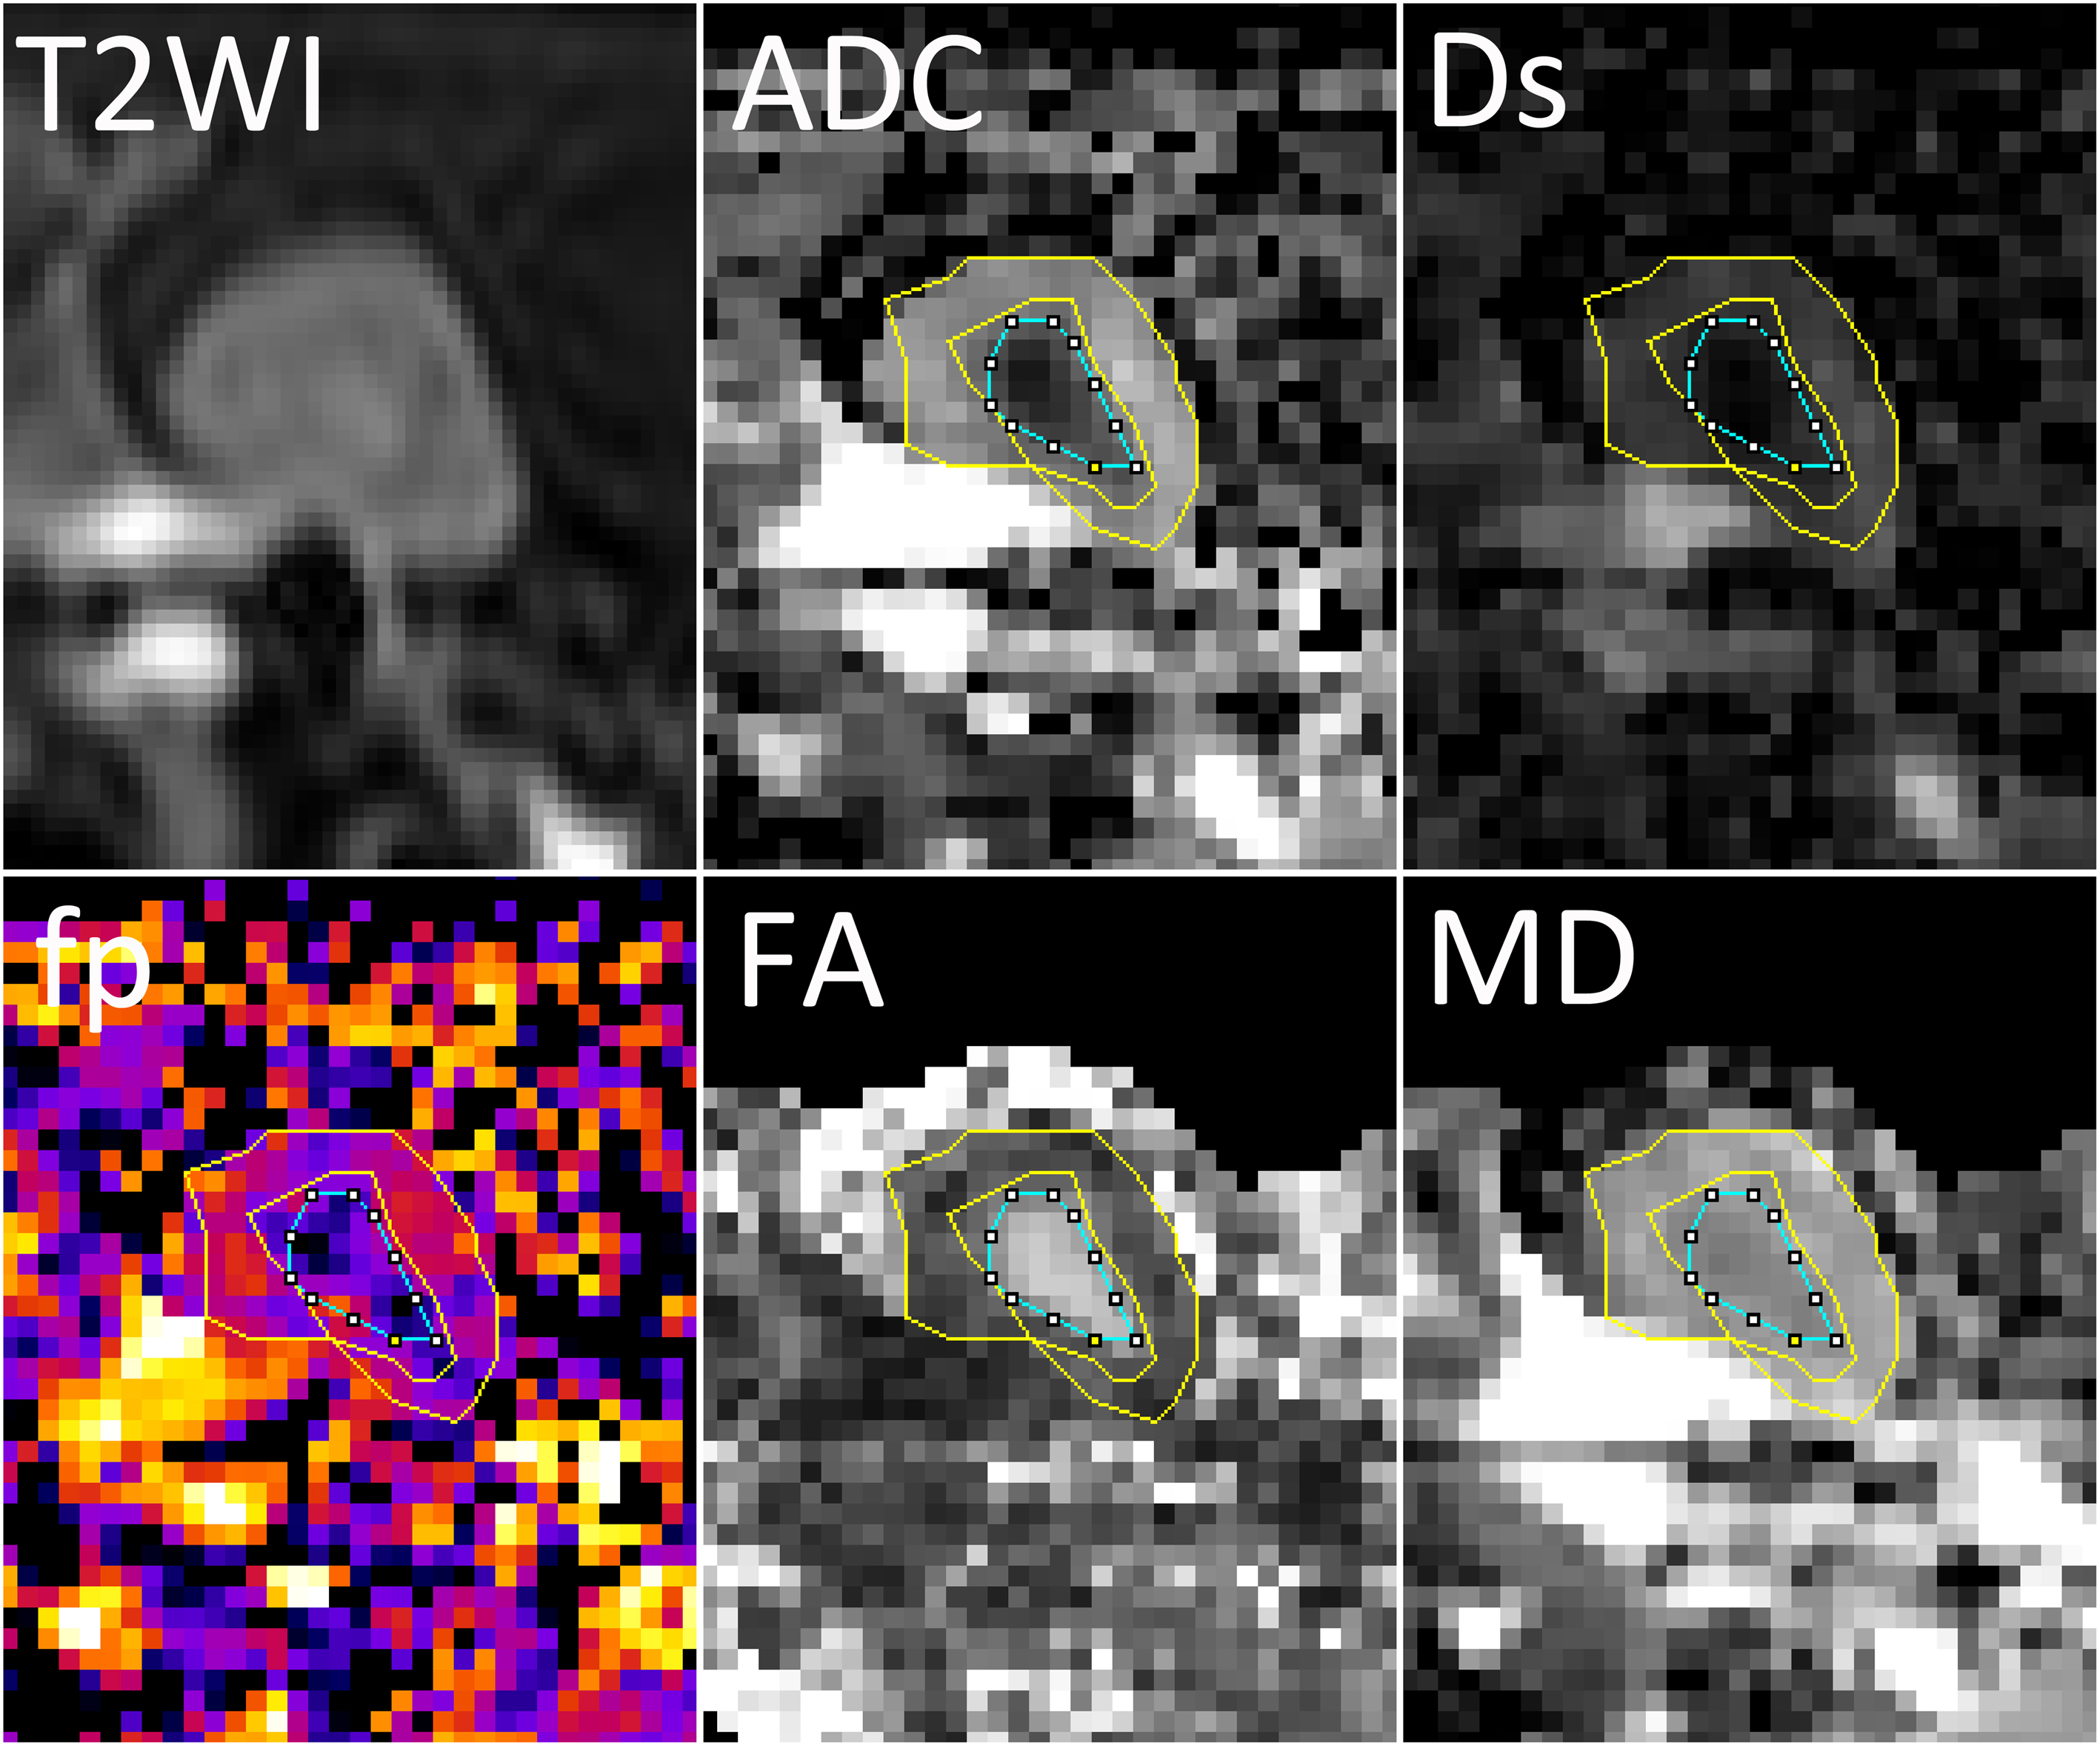
Regions of interest (ROIs) were manually drawn in ImageJ (NIH, USA). A representative renal mpMRI with ROIs is shown in Fig 1. Cortex and medulla were outline on ADC maps with T2WI and FA maps as reference. The same ROIs were projected to all other parametric maps.
Data is presented as the mean ± STD. Statistics was performed in SPSS (IBM Corp., version 16.0, release 2007). The normality of the data was evaluated. Statistical comparison was performed between pre- and post-surgery. Cortical and medullary difference in these parameters were analyzed as well. P<0.05 was considered significant.
Results
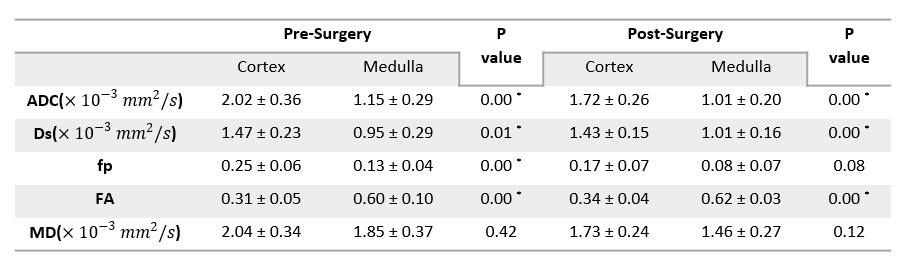
All parameters showed normal distribution except for MD of the cortex after surgery. As shown in Table 1, before the surgery, the values of ADC, Ds, and fp in cortex were significantly higher than that in medulla, while FA was significantly lower (p<0.05 for all). After the surgery, the values of ADC and Ds in cortex remained significantly higher than that in medulla, and FA was still significantly lower (p<0.05 for all). Yet, the cortical and medullar difference in fp vanished. No significant cortical and medullar difference was found in MD for both before and after surgery.
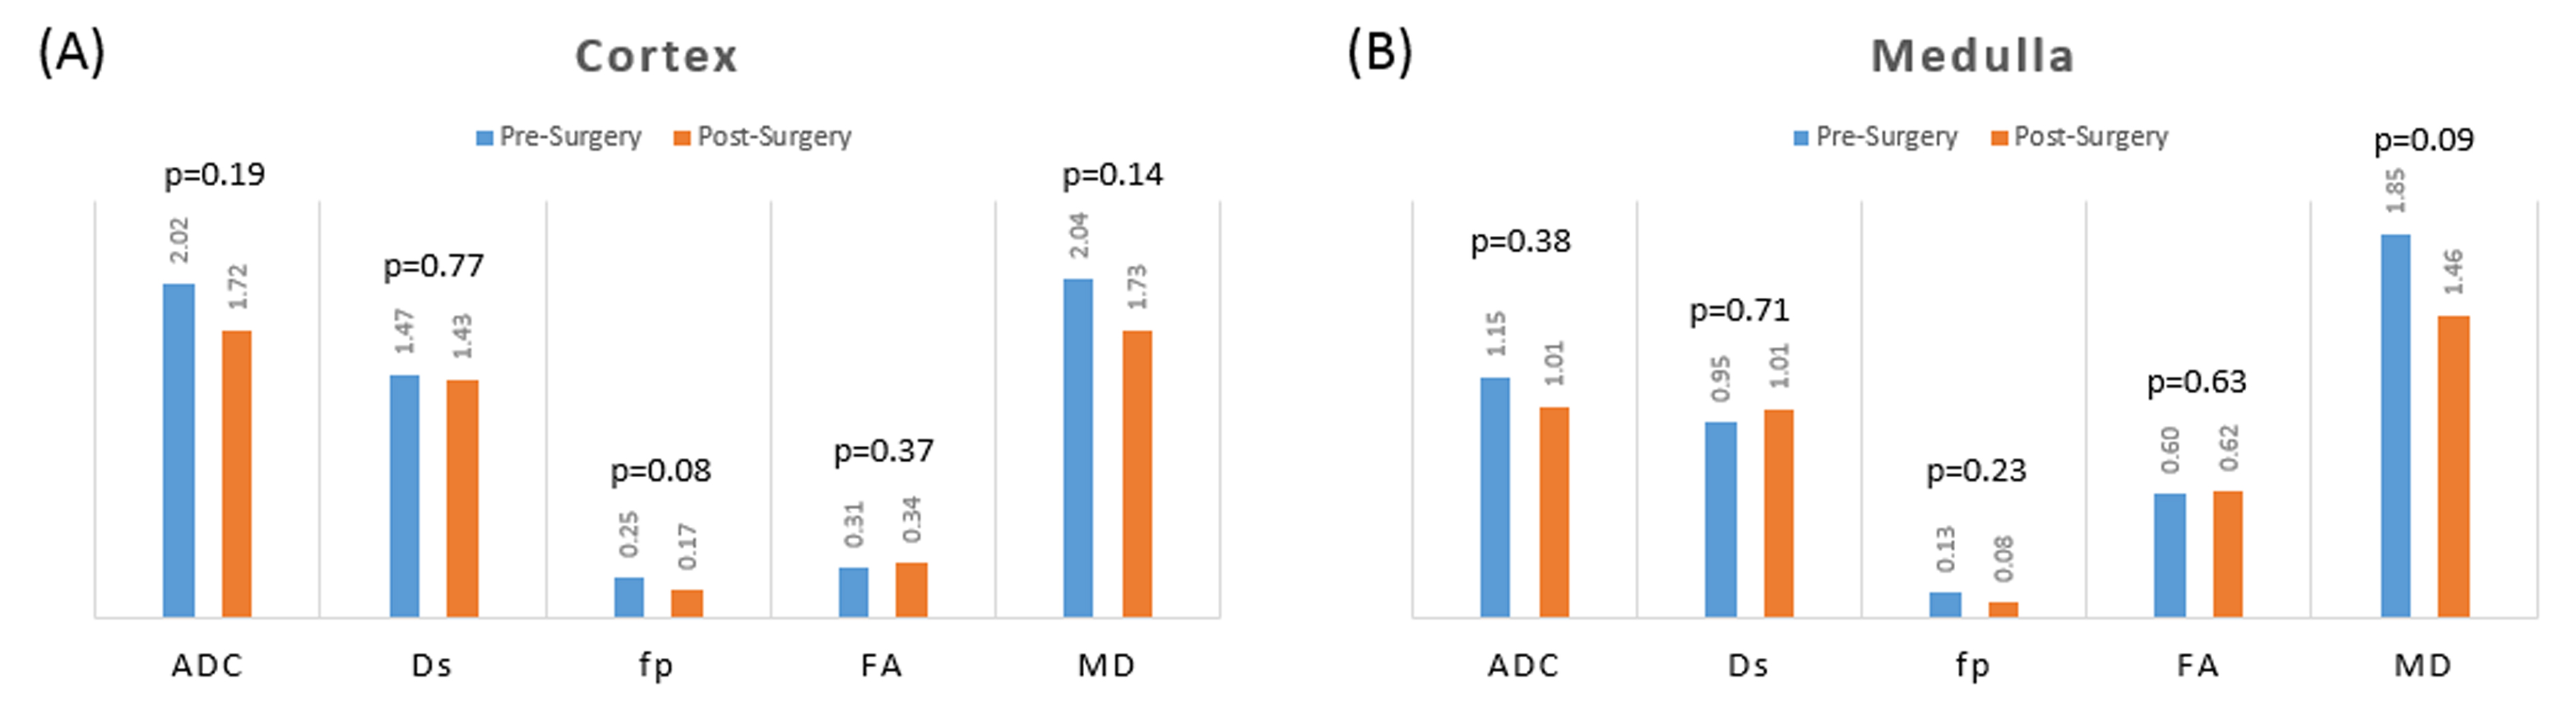
The volume of kidney did not change significantly after surgery (pre-surgery: 7.67±1.56 ml vs. post-surgery: 7.66±1.01 ml, p>0.05). As shown in Fig 2, the values of ADC, Ds, fp, and MD in cortex tended to decrease after surgery while FA showed the trend of increase. In medulla, ADC, fp, MD tended to decrease, while Ds and FA showed the trend of increase. However, no significant change was found in all analyzed parameters. The most obvious change was found in the fp of cortex (p=0.08)
Discussion
ADC, Ds, fp and FA can differentiate renal cortex and medulla. FA was demonstrated to be closely correlated to renal function in previous literature (1). But FA in both cortex and medulla showed insignificant change after high pressure perfusion, even slight increased. The influence on microcirculation was more obvious, with fp decreased in both cortex and medulla. It might be possible that the blood circulation was decreased after the surgery, and the fluid in and the size of nephric tubule were decreased accordingly. The results of this study showed the feasibility of mpMRI to investigate the quantitative change of renal microstructure and microcirculation, with the potential value in early detection of renal function. Larger sample size is required to draw a clear conclusion.
Acknowledgements
This study has received funding by the National Natural Science Foundation of China (Grant No. 81401544) and Natural Science Foundation of Zhejiang Province of China (Grant No. LQ14H180006).References
1. Fan WJ, Ren T, Li Q, et al. Assessment of renal allograft function early after transplantation with isotropic resolution diffusion tensor imaging. Eur Radiol. 2016;26(2):567-575.
2. Hueper K, Khalifa AA, Brasen JH, et al. Diffusion-Weighted imaging and diffusion tensor imaging detect delayed graft function and correlate with allograft fibrosis in patients early after kidney transplantation. J Magn Reson Imaging. 2016;44(1):112-121.
3. Pang Y, Turkbey B, Bernardo M, et al. Intravoxel incoherent motion MR imaging for prostate cancer: an evaluation of perfusion fraction and diffusion coefficient derived from different b-value combinations. Magn Reson Med. 2013;69(2):553-562.
4. Le Bihan D, Breton E, Lallemand D, et al. Separation of diffusion and perfusion in intravoxel incoherent motion MR imaging. Radiology. 1988;168(2):497-505.
5. Yuan Q, Costa DN, Senegas J, et al. Quantitative diffusion-weighted imaging and dynamic contrast-enhanced characterization of the index lesion with multiparametric MRI in prostate cancer patients. J Magn Reson Imaging. 2017;45(3):908-916.
Figures