3193
Comparison between 2D and 3D MEDIC in human cervical spinal cord at 3T1Centre for Advanced Imaging, University of Queensland, Brisbane, Australia, 2Radiology department, College of applied medical sciences, Najran University, Najran, Saudi Arabia, 3Radiology Department, Ramsay Sime Darby Healthcare, Surabaya, Indonesia
Synopsis
High-resolution MRI of the cervical spinal cord is important to provide accurate diagnosis and pathological assessment of injuries. MEDIC (Multiple Echo Data Image Combination) sequence appears promising for use in clinical imaging, however the comparison in the performance of two-dimensional (2D) and three-dimensional (3D) MEDIC sequences for spinal cord imaging has not been reported. This study aims to compare axial 2D and 3D MEDIC sequence for the visualization of the grey matter (GM) and white matter (WM) of the human cervical spinal cord.
Introduction/Purpose
The MEDIC sequence refers to a T2*- spoiled gradient echo, which consists of a single radiofrequency excitation followed by multiple bipolar gradient echoes which are combined to form an image (1). The former echoes are used to increase SNR and the later echoes to improve T2* weighted image contrast (2, 3). This sequence can be performed to create a two or three-dimensional image, and has been shown to provide good contrast between the GM and WM in the cervical spine in MRI 1.5T with a scan time of around 5 minutes (4, 5).
This study compared 2D and 3D MEDIC sequences acquired with comparable scan times at 3T to obtain the best image quality for delineating the human cervical spinal cord structures. The examination evaluated the GM and WM tissue contrasts, SNR, artefacts and anatomical structure visibility.
Methods
Participants: 8 volunteers with mean age of 30.25 ± 6.52 years were underwent a MRI C-spine scan on a 3T Prisma (Siemens, Erlangen, Germany) at Centre for Advanced Imaging, The University of Queensland. A 64-channel head and neck coil was used for imaging. The MRI procedure obtained the approval of The University of Queensland Ethic Committee 2005000502.
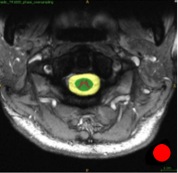
MRI protocols: Axial 2D-MEDIC: FOV=180 x 135 mm, matrix size 384 x 230, voxel size 0.4 x 0.4 mm, slice thickness 3.0 mm, gap 3.3 mm. TR 1000.0 ms, TE 14.0 ms, flip angle 30 degrees, two averages. Scan time was ≈6mins. Axial 3D MEDIC: FOV = 133 x 192 mm, matrix size 400 x 576 x 30, voxel size 0.3 x 0.3 mm x 3mm. TR 38.0 ms, TE 17.0 ms, flip angle 11 degrees and scan time was ≈7min. ITK-SNAP software was used to draw the ROIs in multiple regions (Figure 1).
Quantitative image assessment: SNR, CNR and Non-Uniformity (NU) were calculated.
Qualitative image assessment: Two experienced neuro-radiologists (CS and FN) assisted as independent observers to evaluate the anatomical visibility, image quality (presence of artefact).
Statistical analysis: The Wilcoxan signed rank test was used for evaluating the statistical difference. Pearson’s correlation was used to measure the relationship between the quantitative and qualitative results using SPSS.
Results and Discussion
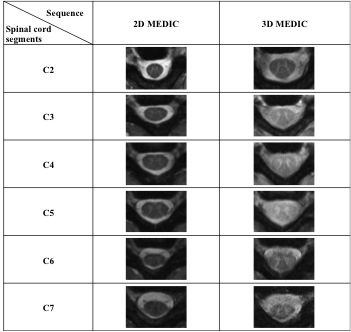
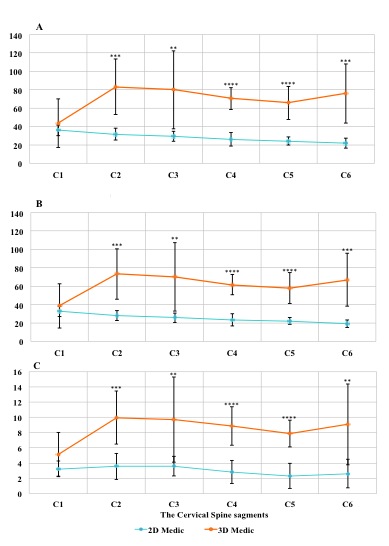
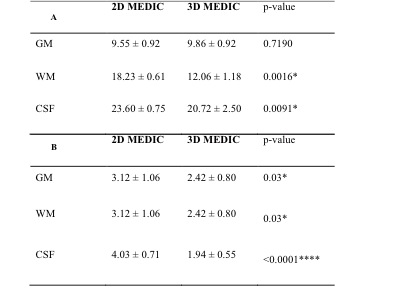
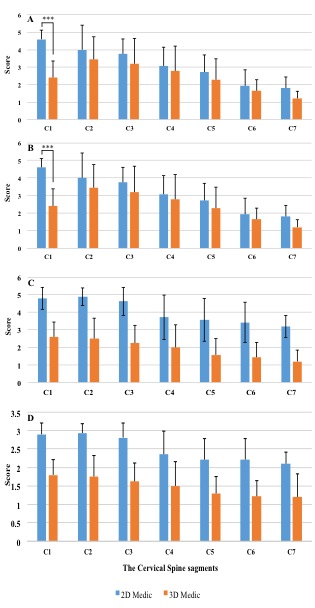
Cervical spine MRIs of both axial 2D and 3D images were arranged for each participant and the cervical spine levels (Figure 2). The grey matter SNR of the 3D MEDIC was higher than the 2D MEDIC (p < 0.0001). A similar SNR was observed at C1 but the SNR of the 2D were significantly lower at the lower levels of the spine (Figure 3A). A similar SNR profile was also observed for the WM (p < 0.0002, Figure 3B). 3D MEDIC showed a higher CNR compared to 2D MEDIC (p < 0.0005) (Figure 3C). Tissue CNR is directly dependent on the SNR and therefore image SNR is an important parameter in achieving good WM/GM tissue contrast. 3D MEDIC showed a significant lower NU value in both WM/CSF (p=0.0016 and 0.0091 respectively (better image homogeneity) compared to the 2D MEDIC (Figure 4A). However, qualitative assessment showed that 2D MEDIC provided better anatomical visibility for the GM, WM and CSF by measuring the whole cervical levels (p<0.015) (Figure 4B). The visibility scores of the grey and white mater structures were similar and decreased steadily from C2 to C7 (Figure 5A, B), with a significant difference was only observed at C1 (p <0.0001). Whereas 2D MEDIC showed a higher CSF visibility score compared to the 3D (Figure 5C). Image quality (presence of artefact) assessment shows that 2D MEDIC has significantly higher score (2.51 ± 0.36) compared to 3D MEDIC (1.48 ± 0.25) (p <0.0001) (Figure 5D). Positive and strong correlations were found between the visibility of the gray matter in 2D MEDIC vs GM/WM CNR (R=0.834, p=0.020), vs GM SNR (R=0.982, p<0.001) and vs WM SNR (R=0.990, p<0.001). A strong correlation was also observed between the visibility of GM and 2D image quality (R=0.941, p=0.002). For 3D MEDIC, such correlations between quantitative and qualitative image parameters were not statistically significant. These data indicate that although 3D MEDIC can produce high SNR and CNR, it could not sufficiently provide clear visualization and better quality of the spinal cord structures.
Conclusion
2D MEDIC produced superior images for visualizing the internal architecture of the cervical spinal cord compared to 3D MEDIC, as the later was more prone to registering movement artefacts. Further development of 3D MEDIC is required before it can be used for diagnostic imaging in the cervical spinal cord.Acknowledgements
We thank Nicole Atcheson for assistance in data acquisition, and Dr Cindy Sadikin and Dr Francisca Notopiro for MR image assessments.References
1. McRobbie DW, Moore EA, Graves MJ, Prince MR. MRI from Picture to Proton: Cambridge University Press; 2007.
2. Martin N, Malfair D, Zhao Y, Li D, Traboulsee A, Lang D, et al. Comparison of MERGE and axial T2-weighted fast spin-echo sequences for detection of multiple sclerosis lesions in the cervical spinal cord. AJR Am J Roentgenol. 2012;199(1):157-62.
3. Nitz W. Fast and ultrafast non-echo-planar MR imaging techniques. European Radiology. 2002;12(12):2866-82.
4. Held P, Seitz J, Fründ R, Nitz W, Lenhart M, Geissler A. Comparison of two-dimensional gradient echo, turbo spin echo and two-dimensional turbo gradient spin echo sequences in MRI of the cervical spinal cord anatomy. European Journal of Radiology. 2001;38(1):64-71.
5. Vertinsky AT, Krasnokutsky MV, Augustin M, Bammer R. Cutting-edge imaging of the spine. Neuroimaging clinics of North America. 2007;17(1):117-36.
Figures