3190
Axial Gradient Echo Spiral MRI of the Pediatric Spine1Phoenix Children's Hospital, Phoenix, AZ, United States, 2Philips Healthcare, Phoenix, AZ, United States, 3Barrow Neurological Institute, Phoenix, AZ, United States
Synopsis
MRI spine examinations are an important tool in pediatric care. Long acquisition times and artifacts related to motion and flow are a regular challenge in these examinations. Spiral MRI offers substantial potential benefits with regards to both acquisition time and artifact reduction. This work studies spiral MRI for gradient echo imaging of the pediatric spine and demonstrates promising results in preliminary patient data. The results from a contrast and SNR optimization study in a volunteer are also presented.
Purpose
To evaluate the utility of spiral MRI for axial imaging in the pediatric spineIntroduction
Spine imaging comprises nearly 25% of pediatric MRI examinations and is an important tool for congenital and development disorders and injury. Spiral MRI offers several theoretical advantages over standard Cartesian MRI including greater k-space coverage per readout, reduced in-plane flow sensitivity, and reduced motion artifact coherence. The first advantage helps to mitigate the well-known tradeoff between scan time, resolution, and signal-to-noise (SNR). The major limitations of spiral, including off-resonance blurring, eddy currents, and more complicated reconstructions, can be alleviated through modern computing and advanced reconstruction methods [1-3]. Spiral MRI brain studies have demonstrated an improvement in SNR and reduction in scan time compared to similar Cartesian scans, and a reduction in flow artifacts in T1w post-contrast images [4-6]. More recently, spiral was applied in the spine using a sagittal T1w MPRAGE sequence [7]. This work investigates the use of spiral MRI for 3DT1w and 2DT2*w axial gradient echo imaging of the pediatric spine. At our institution, axial 3DT1w and 2DT2*w gradient echo (GRE) sequences are part of our standard-of-care spine MRI examination.Methods
Spiral and Cartesian data were acquired in pediatric patients on two 3.0T Philips Ingenia scanners following IRB approval and informed consent. The Cartesian data were acquired as part of each patient’s routine spine examination. The spiral acquisitions were matched to each corresponding Cartesian acquisition and performed at the end of the study. The T1w spiral acquisition readout began at the center of k-space and spiraled outward, while the T2*w spiral acquisition readout began at the edge of k-space and spiraled in to the center. The spiral acquisitions were preceeded by the acquisition of a B0 field map using a short (<1min) Cartesian Dixon scan. This B0 map was used for deblurring in the spiral reconstruction. Spiral data were reconstructed at the scanner using an extension of the vendor’s reconstruction software. In-plane parallel imaging was not supported by the on-scanner reconstruction, but through-slice parallel imaging was used in the slice direction for 3D spiral scans.
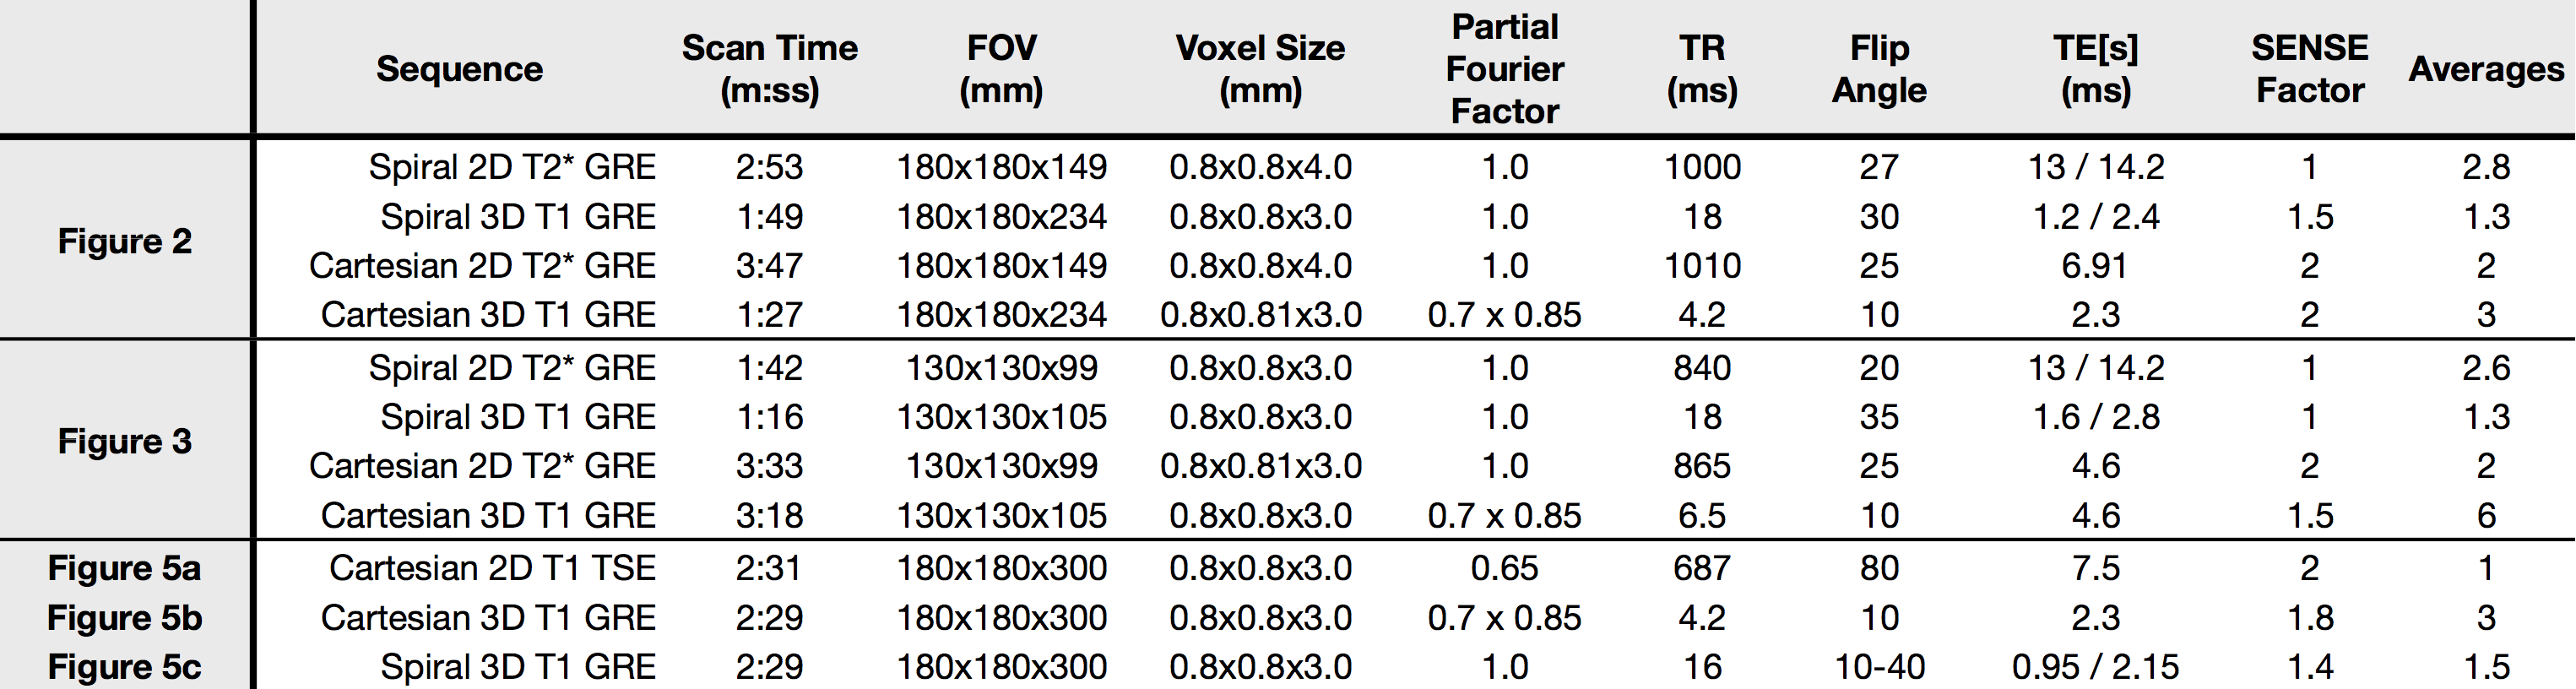
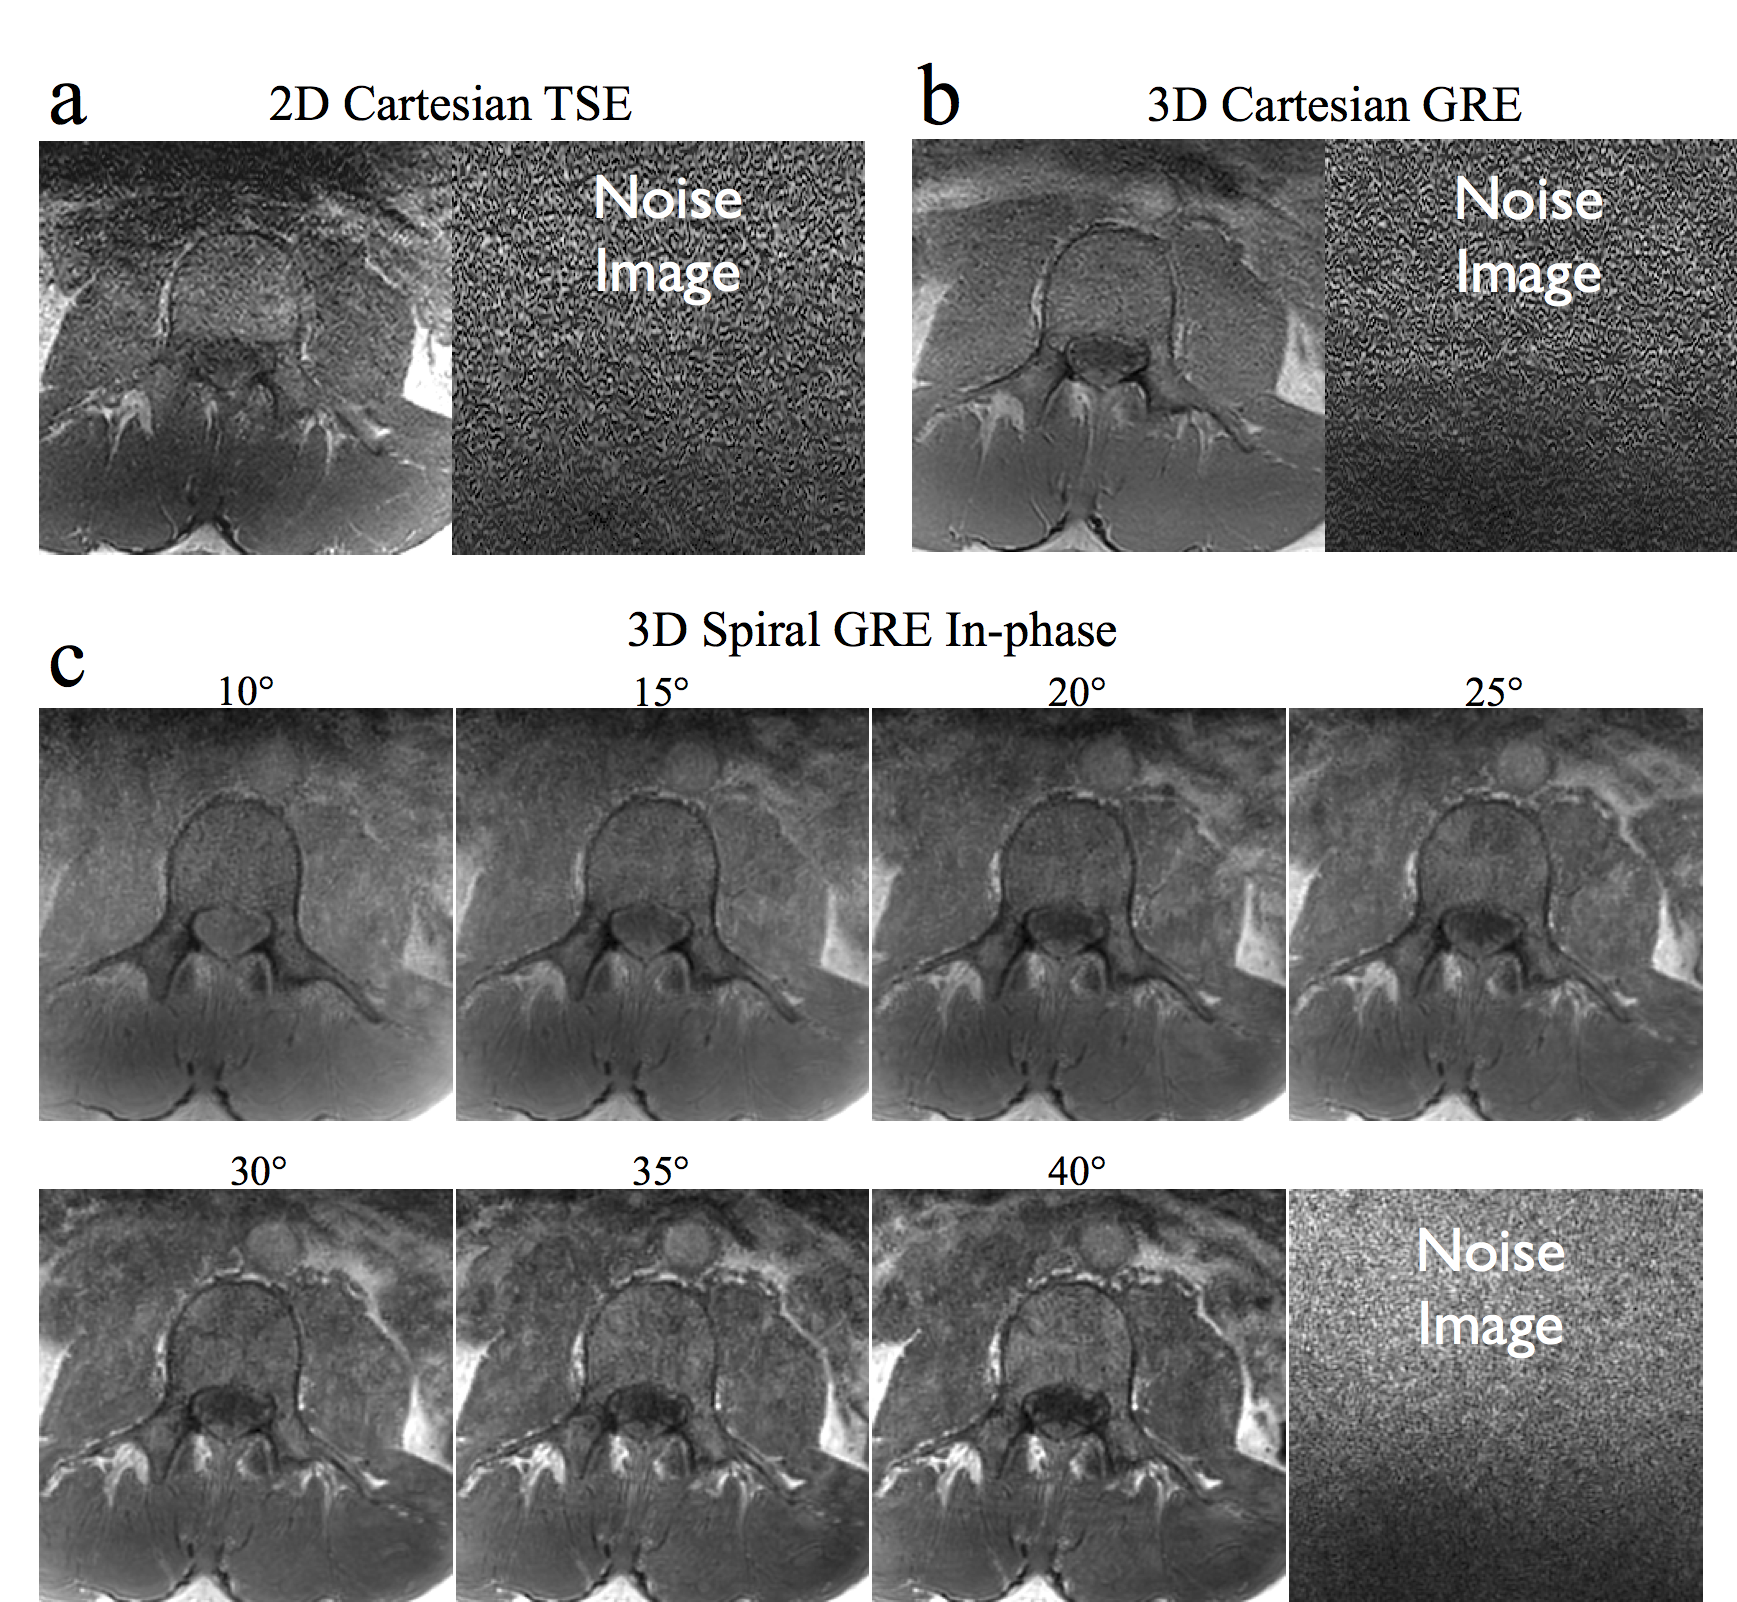
One challenge in comparing spiral acquisitions with long (~10ms) readouts to standard Cartesian sequences is the differences in contrast caused by unmatched echo and repetition times. To help address this issue, a study was performed on an adult volunteer by acquiring seven 3D axial T1w spiral datasets with identical scan parameters and with flip angles increasing from 10 to 40 degree in 5 degree increments. Both 3DT1w GRE and 2DT1w TSE Cartesian data were acquired for comparison. A separate noise scan was performed with each acquisition by repeating the acquisition without the application of RF and gradient fields. These data were used to calculate the cord to CSF contrast to noise ratio (CNR), and the SNR for each image. Measurements were taken from ROIs in the spinal cord, the spinal canal CSF, and the vertebrae. Noise standard deviation was taken from an ROI in each corresponding noise image. Scan parameters for all Cartesian and spiral acquisitions are given in table 1.
Results and Discussion
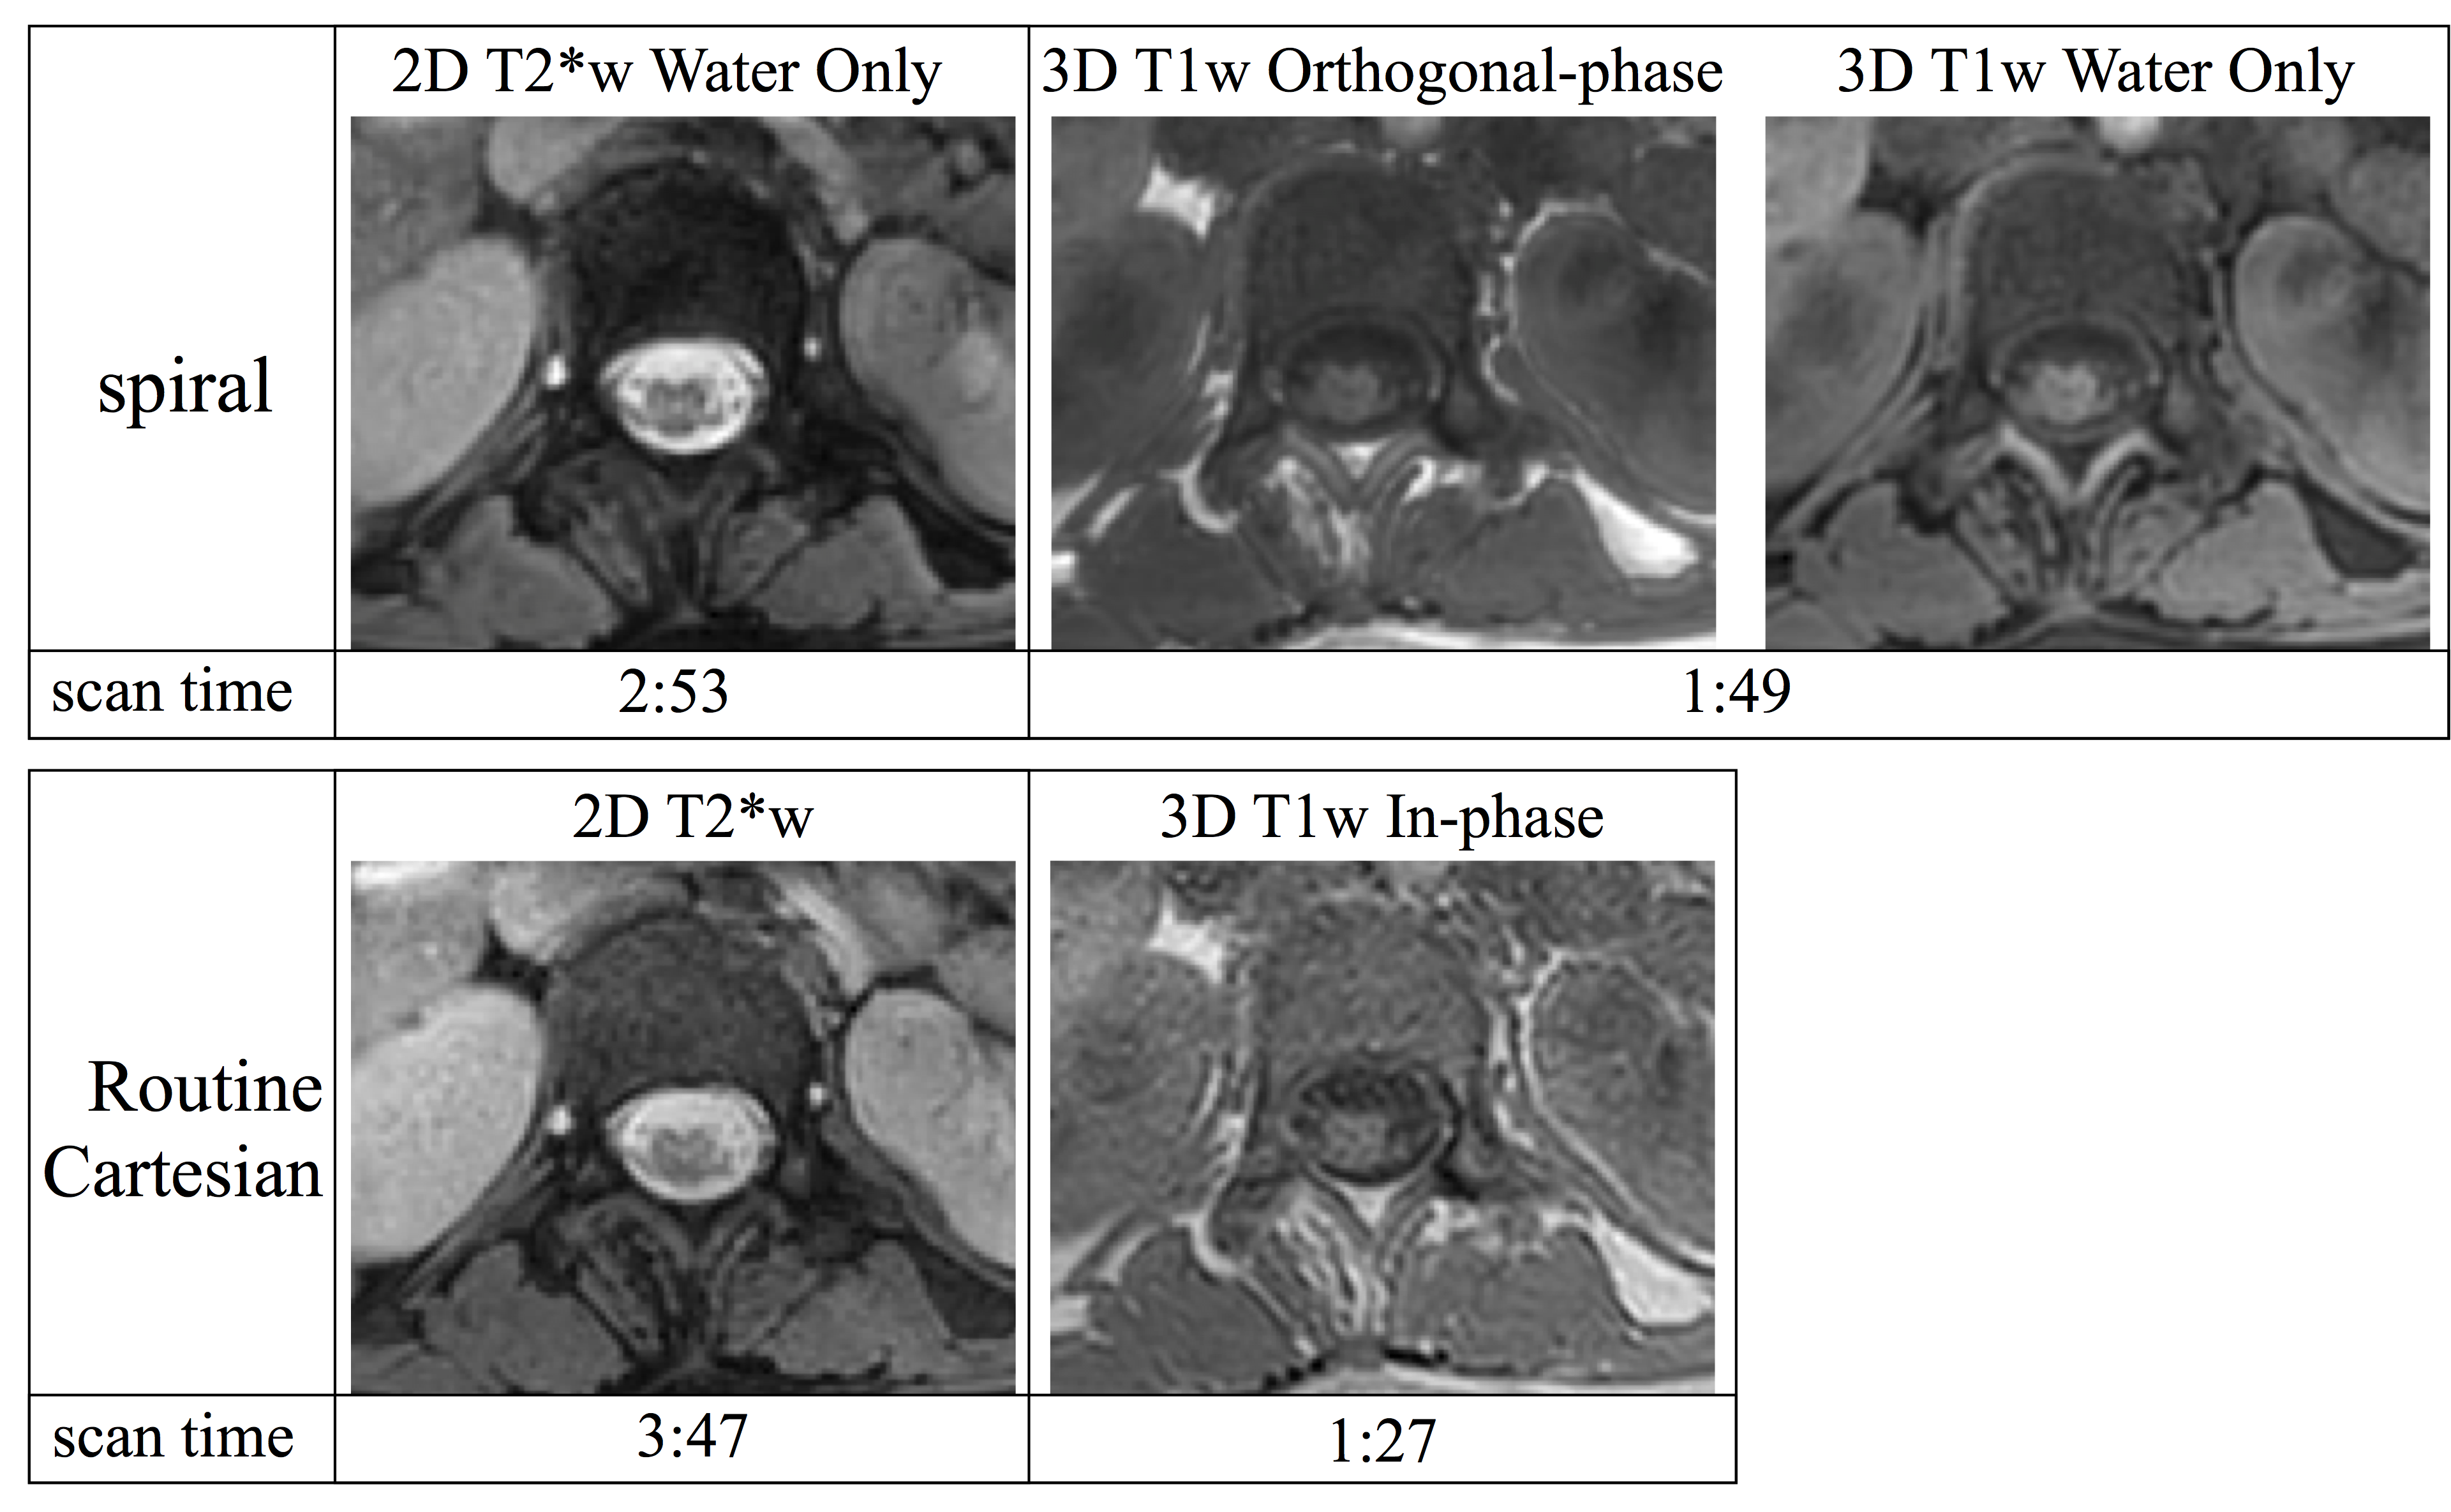
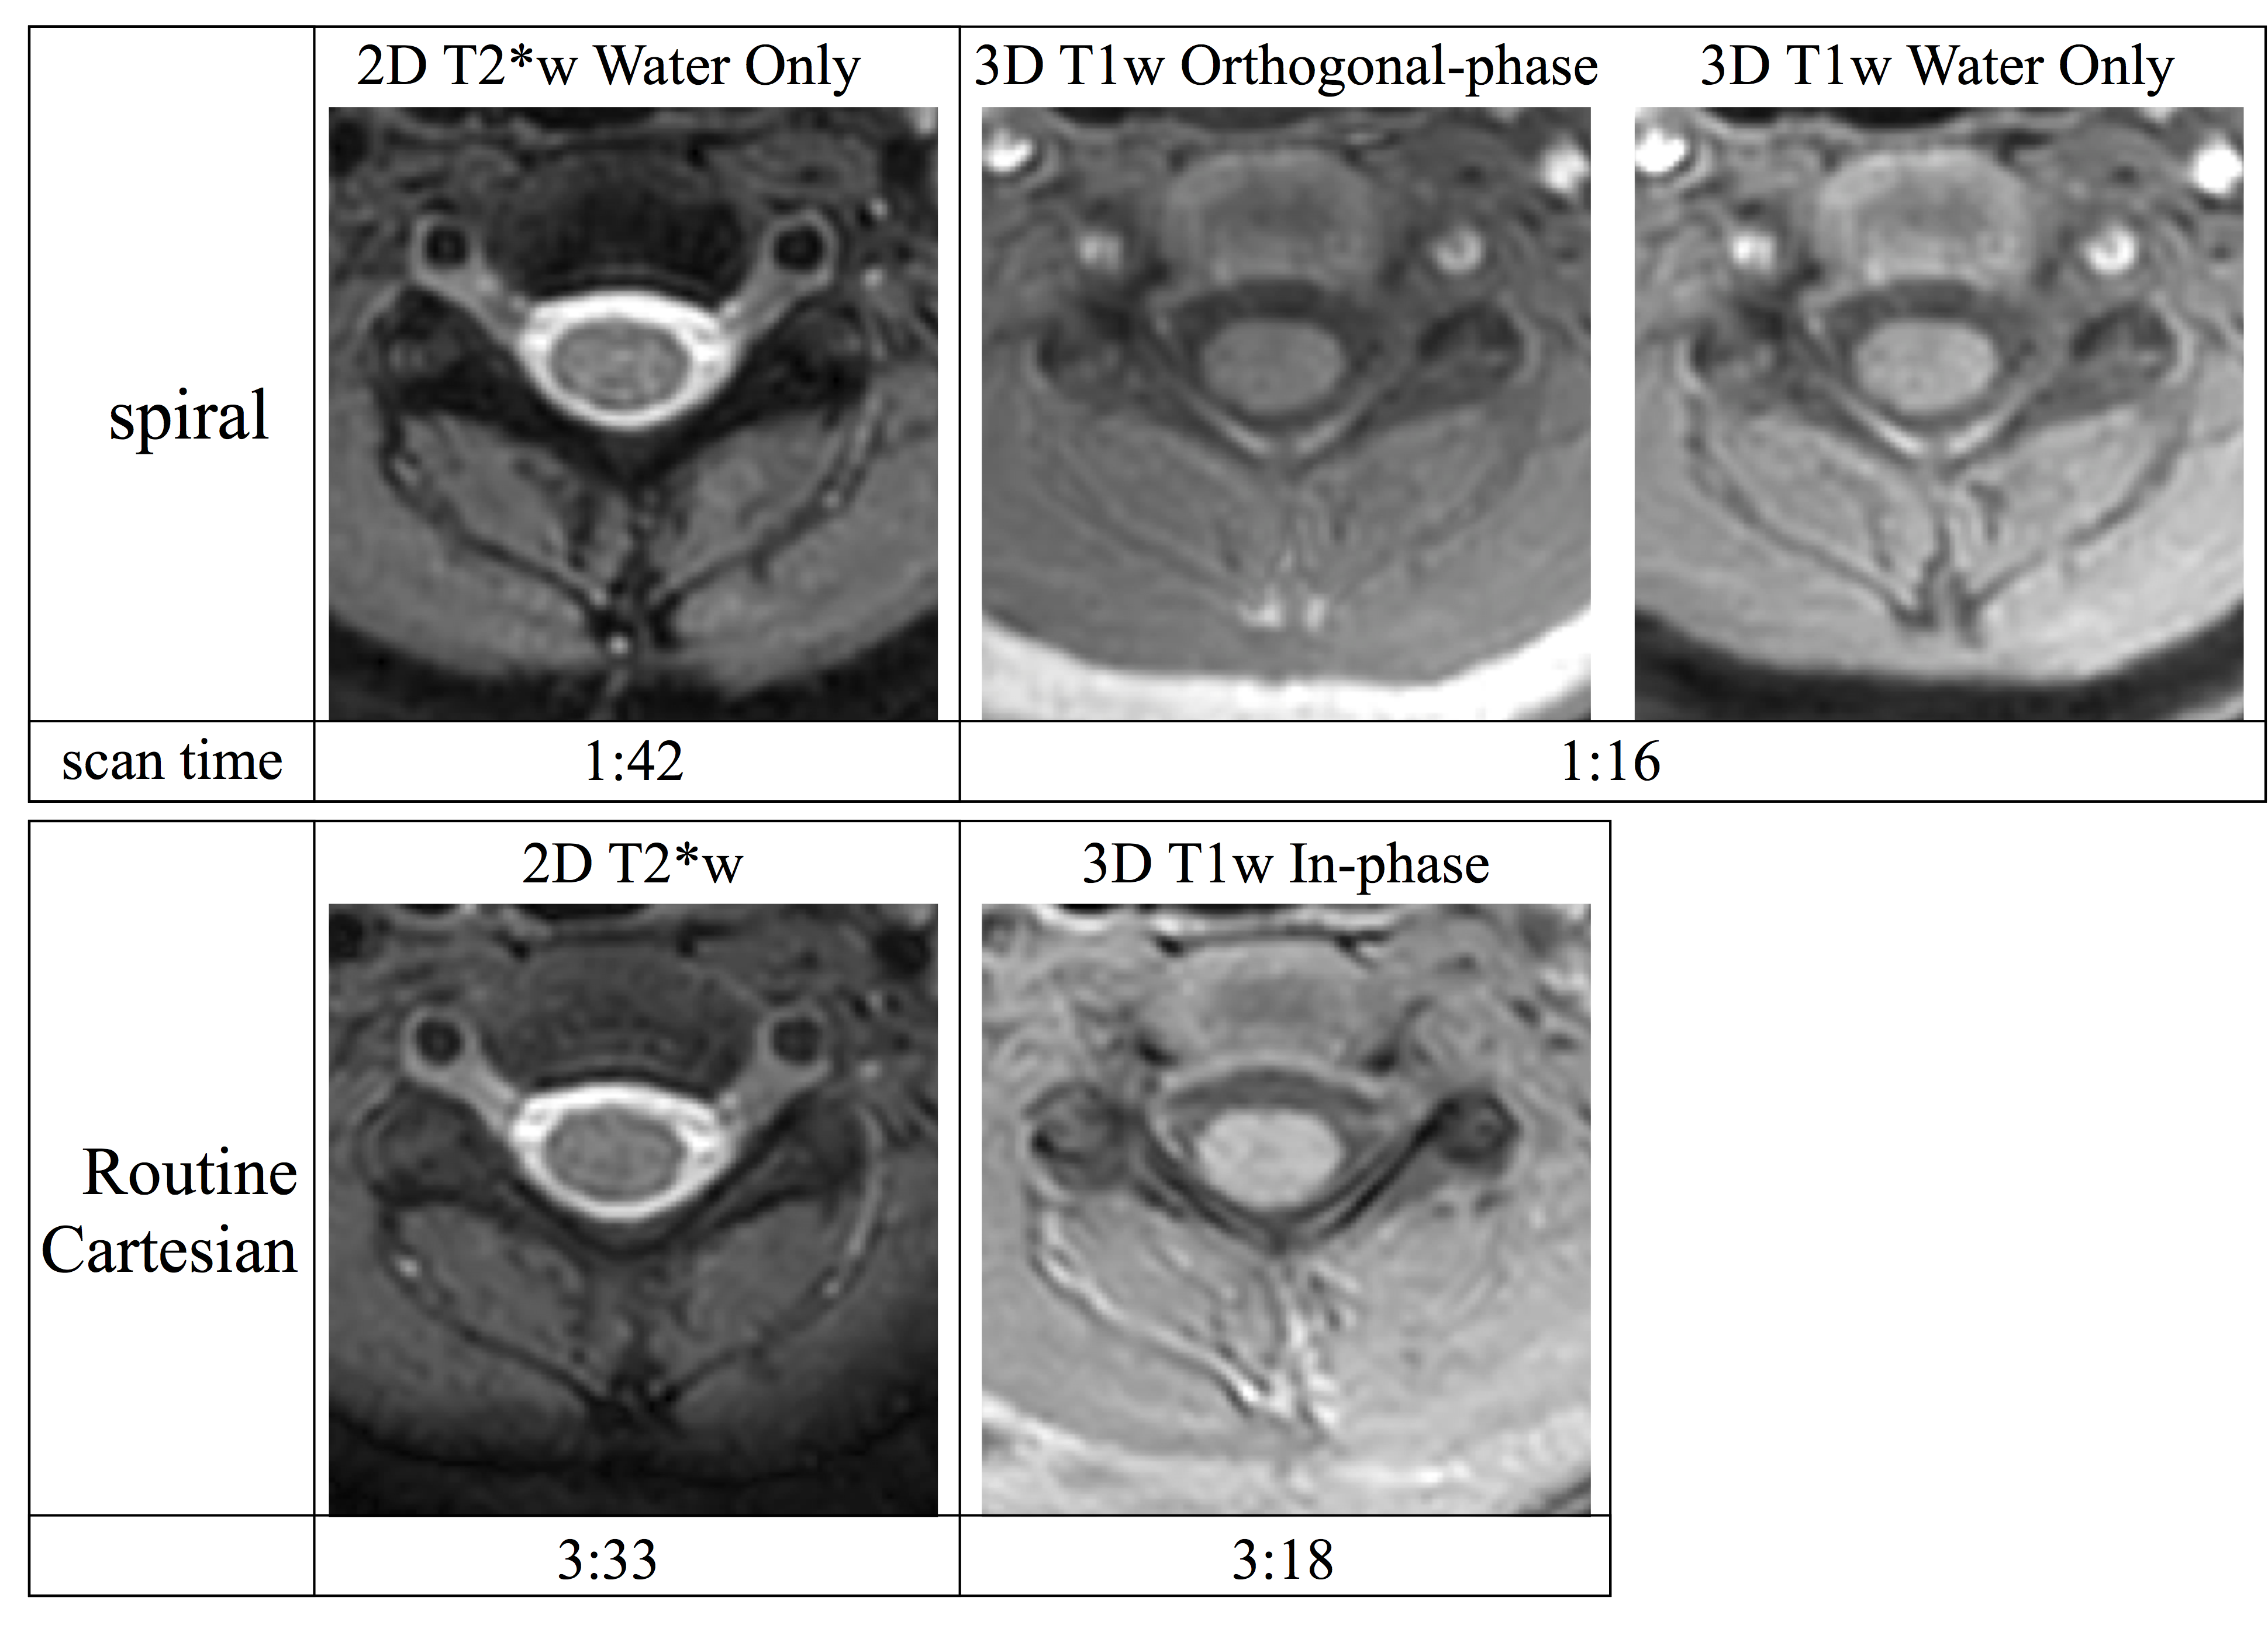
Example T1w and T2*w Cartesian and spiral data for two pediatric patients are shown in figures 2 and 3. The spiral data show superior apparent cord contrast and SNR compared to the Cartesian data. However, some artifacts remain in the spiral data, particularly for slices near the edges of the acquired volumes or near regions of strong susceptibility. It is expected that improvements in B0 map acquisition and the addition of parallel imaging reconstruction will further improve the spiral image quality.
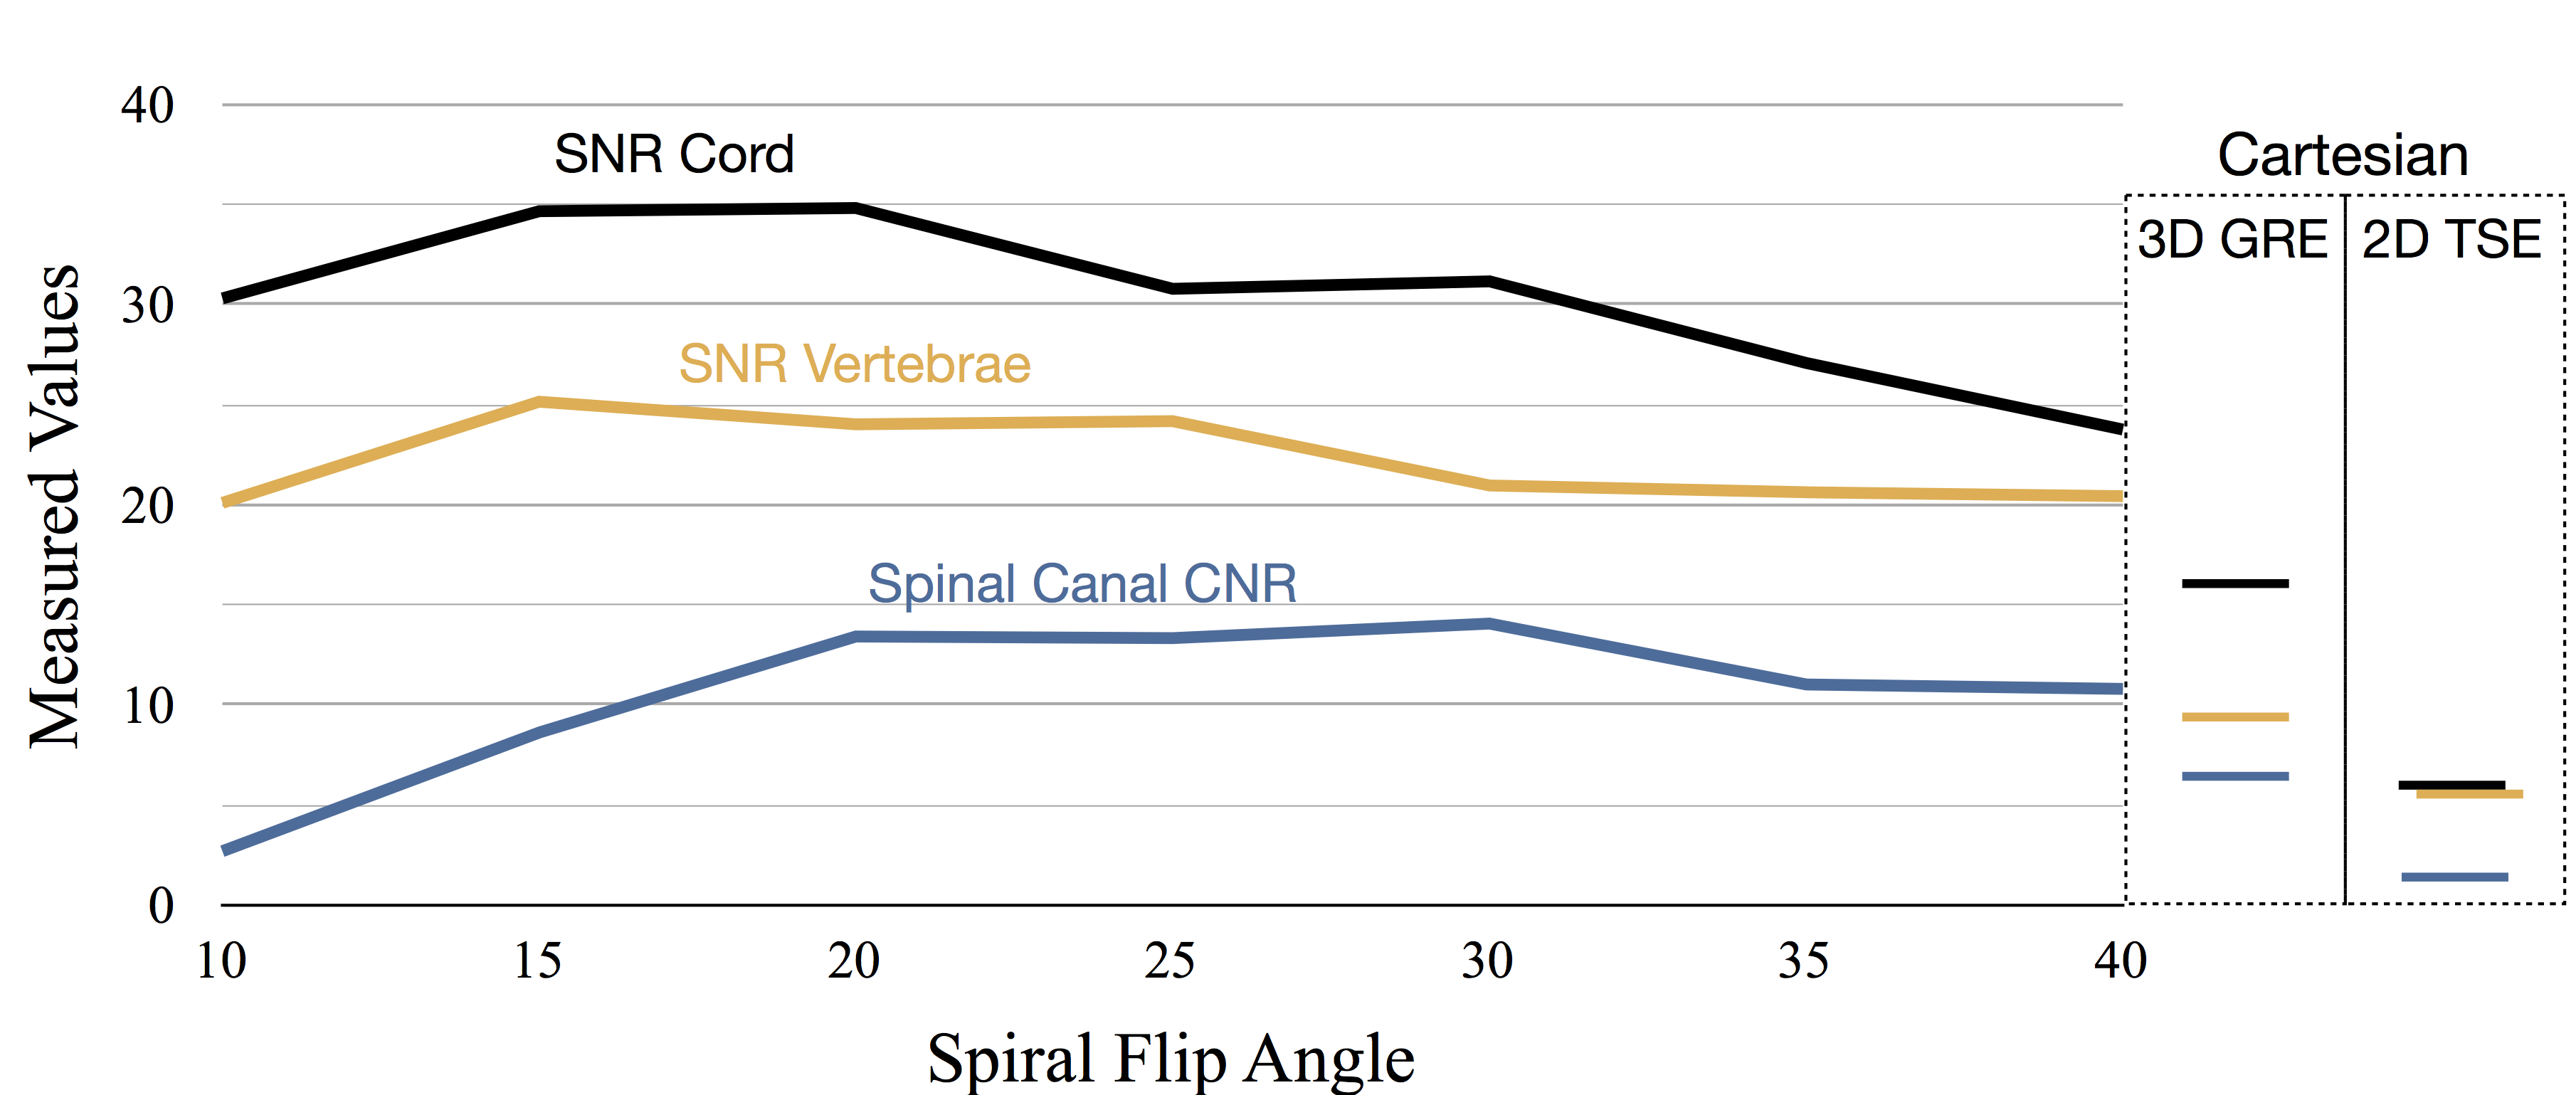
The SNR and CNR measured in the volunteer contrast optimization study are plotted against flip angle in figure 4. The maximum measured cord to CSF CNR for the spiral scan was 14.05 and occurred at a flip angle of 30. However, the CNR was roughly equivalent for flip angles from 20-30 degrees. By comparison the CNR was 6.34 for the 3D T1 Cartesian data and 1.68 for the T1 Cartesian TSE data. The measured SNR was highest for flip angles between about 15 and 25 degrees. As such, a flip angle of 20-25 degrees was identified as optimal for the 3DT1w spiral acquisition. Example images from this study are shown in figure 5.
Conclusion
This work has demonstrated the potential of spiral MRI to acquire axial T1 and T2* weighted spine data in a pediatric population with superior SNR and reduced scan time compared to similar Cartesian scans.Acknowledgements
This work was funded in part by Philips HealthcareReferences
- Wang D, Zwart NR, Pipe JG. Joint water–fat separation and deblurring for spiral imaging. Magn Reson Med 2017 . doi: 10.1002/mrm.26950 [Epub ahead of print]
- Zwart NR, Johnson KO, Pipe JG. Efficient sample density estimation by combining gridding and an optimized kernel. Magn Reson Med 2012;67:701–710.
- Pruessmann KP, Weiger M, Bornert P, Boesiger. Advances in sensitivity encoding with arbitrary k-space trajectories. Magn Reson Med 2001; 46:638-51.
- Li Z et al. Sliding-slab three-dimensional TSE imaging with a spiral-In/Out readout. Magn Res Med 2015; 75:729-738.
- Li Z et al. Arterial spin labeled perfusion imaging using three-dimensional turbo spin echo with a distributed spiral-in/out trajectory. Magn Res Med 2015; 75:266-273.
- Li Z et al. A Spiral Spin-Echo MR Imaging Technique for Improved Flow Artifact Suppression in T1-Weighted Postcontrast Brain Imaging: A Comparison with Cartesian Turbo Spin-Echo. Am J Neuroradiol. 2016; 37:642-647.
- Robison RK, Wang D, Ooi M, Pipe JG. Three-Dimensional T1-weighted spiral imaging of the spine. Proc. ISMRM annual meeting 2017. #1481.
Figures