3187
Rapid Myelin Measurement: Comparison Between SyMRI (Simultaneous Tissue Relaxometry), Magnetization Transfer Saturation Index, and T1w/T2w Ratio Methods1Department of Radiology, Graduate School of Medicine, The University of Tokyo, Tokyo, Japan, 2Department of Radiology, Juntendo University School of Medicine, Tokyo, Japan, 3Hôpital Cochin, Paris, France
Synopsis
In 20 healthy adults, we examined the correlation between three rapid MR myelin measurement methods, including simultaneous tissue relaxometry of R1 and R2 relaxation rates and proton density (SyMRI), magnetization transfer saturation (MTsat) index, and the ratio of T1-weighted to T2-weighted images (T1w/T2w ratio). Even though SyMRI and MTsat showed strong correlation in the white matter, only weak to moderate correlation was found between T1w/T2w and SyMRI or MTsat. In conclusion, SyMRI and MTsat seem to be suitable for evaluating myelin in the white matter, but T1w/T2w ratio may be less optimal.
Introduction
Measuring myelin in the brain by MRI is important for evaluating development and aging of healthy human, and the progression of degenerative or demyelinating diseases.1, 2 Recently, rapid simultaneous relaxometry (SyMRI) based on a single pulse sequence was developed.3 It became possible to create contrast-weighted images (synthetic MRI4) and measure myelin based on the acquired quantitative values,5 thus obviating the need for acquiring these images separately. There are several other techniques for myelin measurement, including magnetization transfer (MT) imaging6 and T1w/T2w ratio.7, 8 The aim of this study was to validate SyMRI myelin measurement method by comparing these myelin measurement methods.Methods
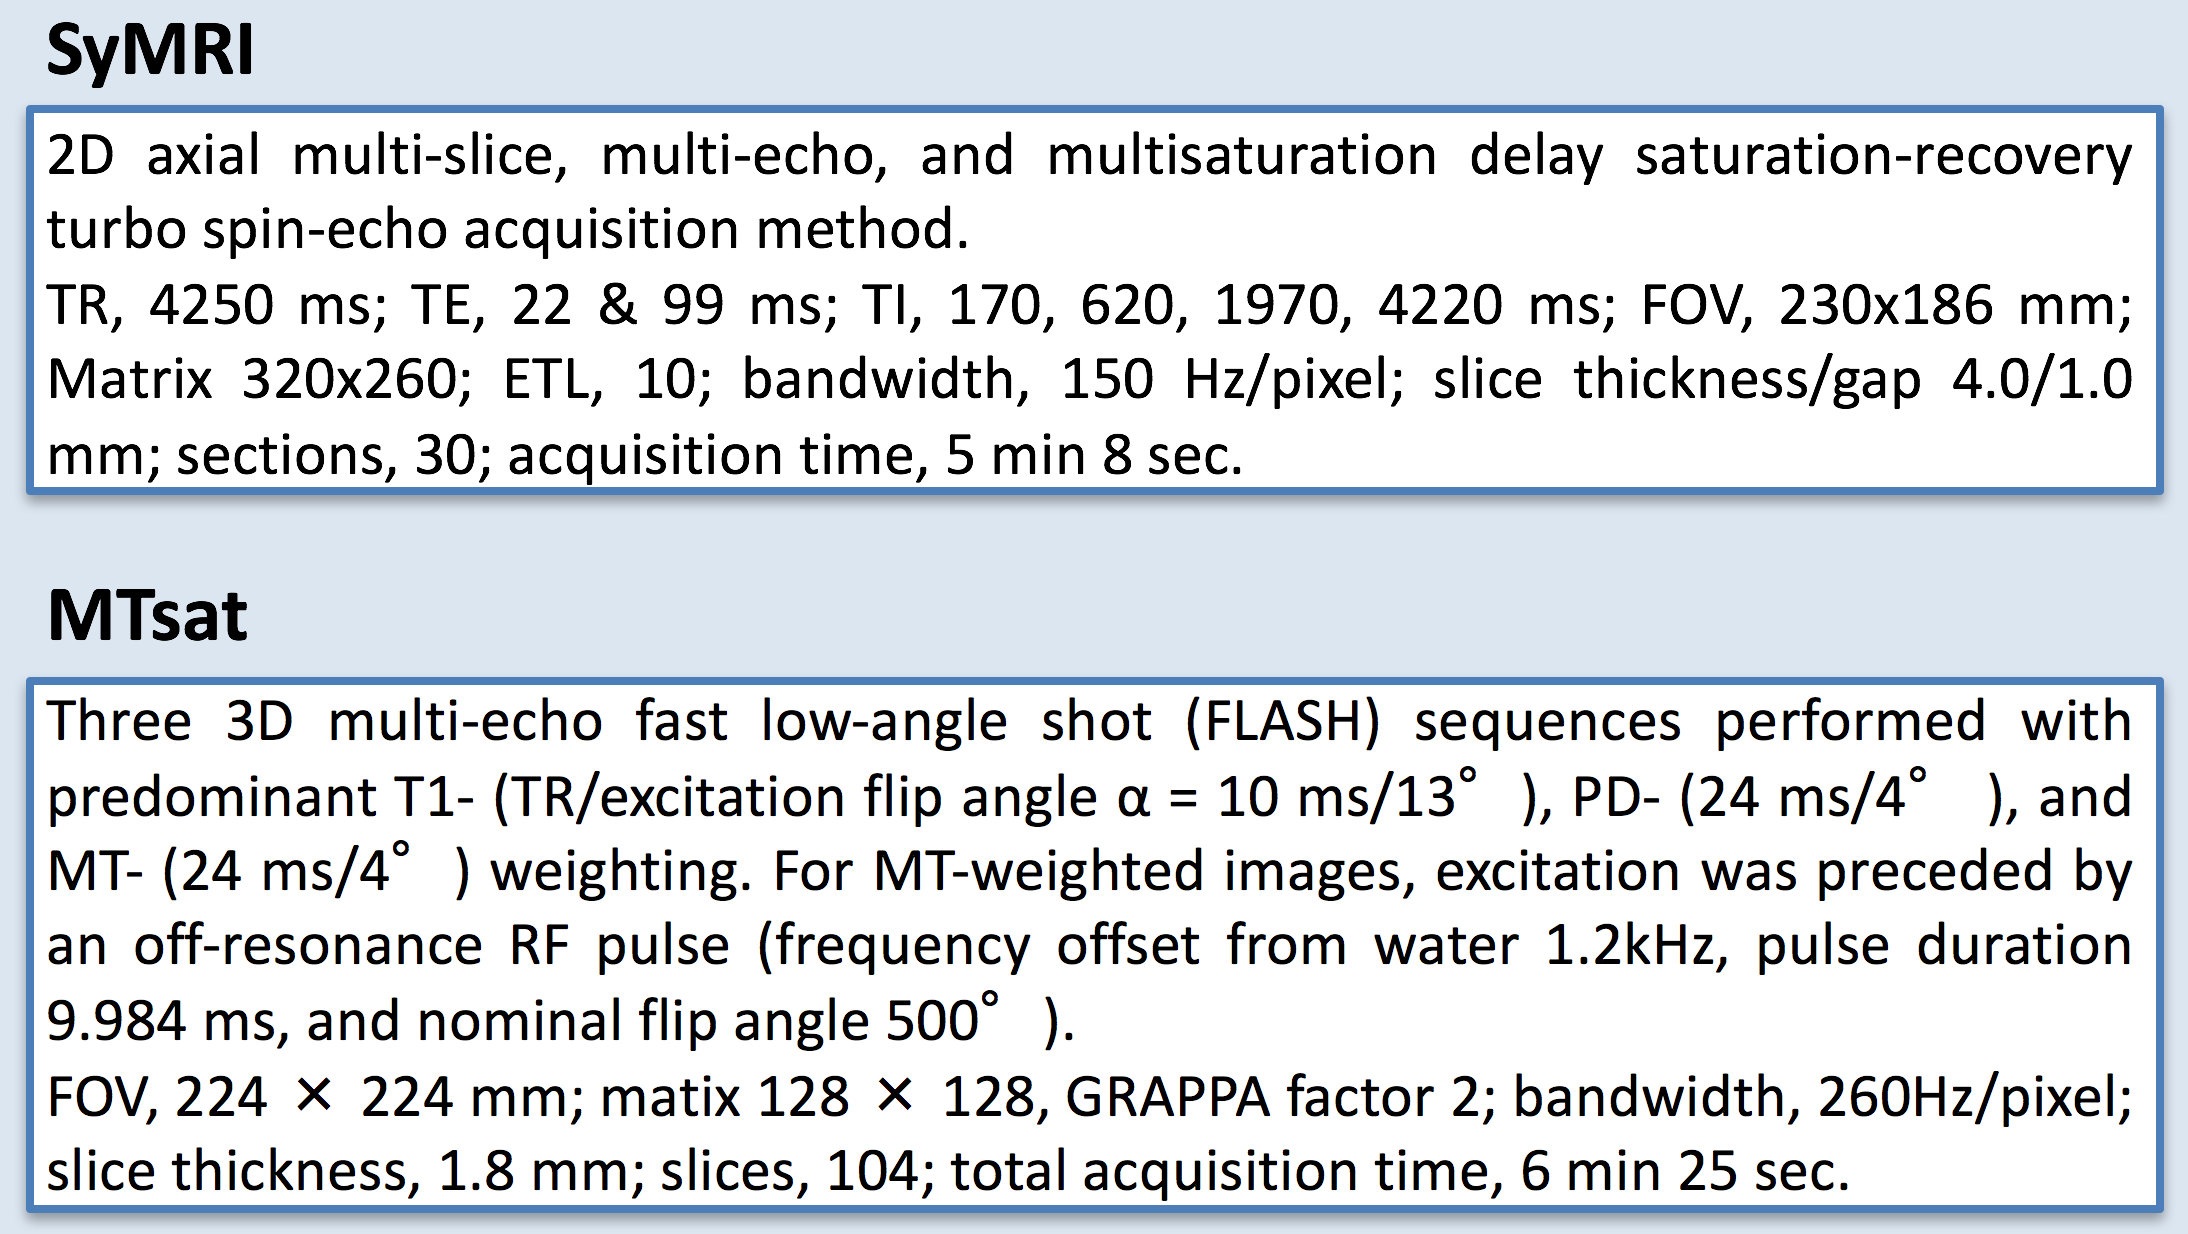
20 healthy volunteers (9 male and 11 female, mean age 55.3 years, age range 25–71 years) were included in this study, and scanned by SyMRI and MT imaging (Table 1) on a 3-T MR scanner (MAGNETOM Prisma, Siemens Healthcare, Erlangen, Germany). Myelin volume fraction (MVFSyMRI) was calculated automatically based on the R1, R2, and proton density on SyMRI software (ver.8.0, SyntheticMR, Linkoping, Sweden).3 Although other methods for myelin imaging require scaling factors to estimate MVF,6 SyMRI directly estimates the volume fraction of myelin in a voxel using 4-compartment model.3 Synthetic T1-weighted (TR, 500 ms; TE, 10 ms) and T2-weighted (TR, 4500 ms; TE, 100 ms) images were produced from SyMRI data. Before making ratio of T1-weighted to T2-weighted images, the intensities of these images were calibrated to eyes and temporalis muscle to increase reproducibility.9 Three 3D multi-echo fast low-angle shot (FLASH) sequences were performed with predominant T1-, PD-, and MT-weighting for all subjects. These three images were used to calculate the MT saturation (MTsat) index.10
We used JHU ICBM-DTI-81 white-matter atlas and AAL as white matter (WM) and gray matter (GM) ROIs, respectively. We warped the ROIs to each metric map using FSL. To remove the partial volume effects, tissue probability maps were thresholded at 0.95 and used as masks to be applied to MVFSyMRI, T1w/T2w ratio, and MTsat. Upon ROI analysis, the mean values were recorded. For calibration of MTsat and T1w/T2w ratio to be used as quantitative markers for myelin, we assumed linear relationship between MVFSyMRI, MTsat, T1w/T2w ratio and actual myelin content in the WM.11, 12 We determined the scaling factors of T1w/T2w ratio and MTsat by making the averages of these values in all the 48 WM ROIs to be equal to that of MVFSyMRI. We denoted calibrated MTsat and T1w/T2w ratio as MVFMTsat and MVFT1w/T2w, respectively (Fig. 1). After calibration, we performed ROI analysis again for MVFT1w/T2w and MVFMTsat.
We used Spearman rank order correlation coefficient to investigate the correlation among MVF metrics for WM, subcortical GM, and cortical GM.
Results
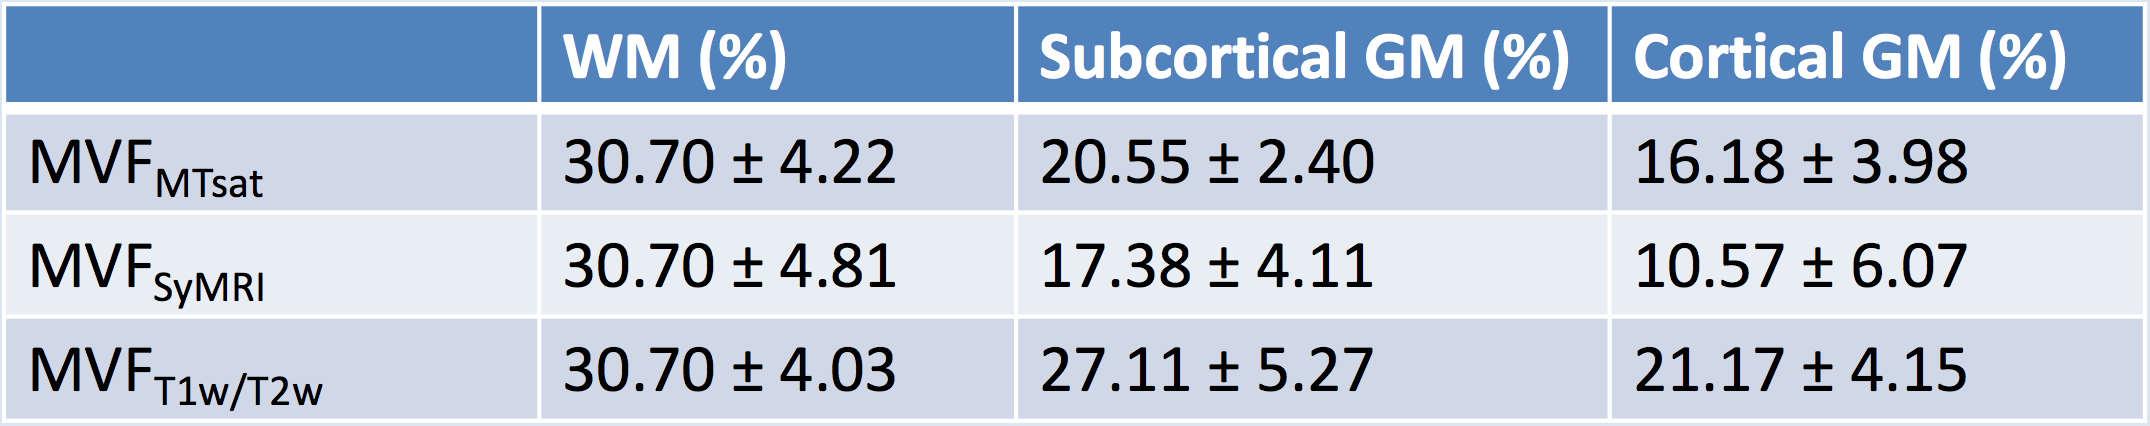
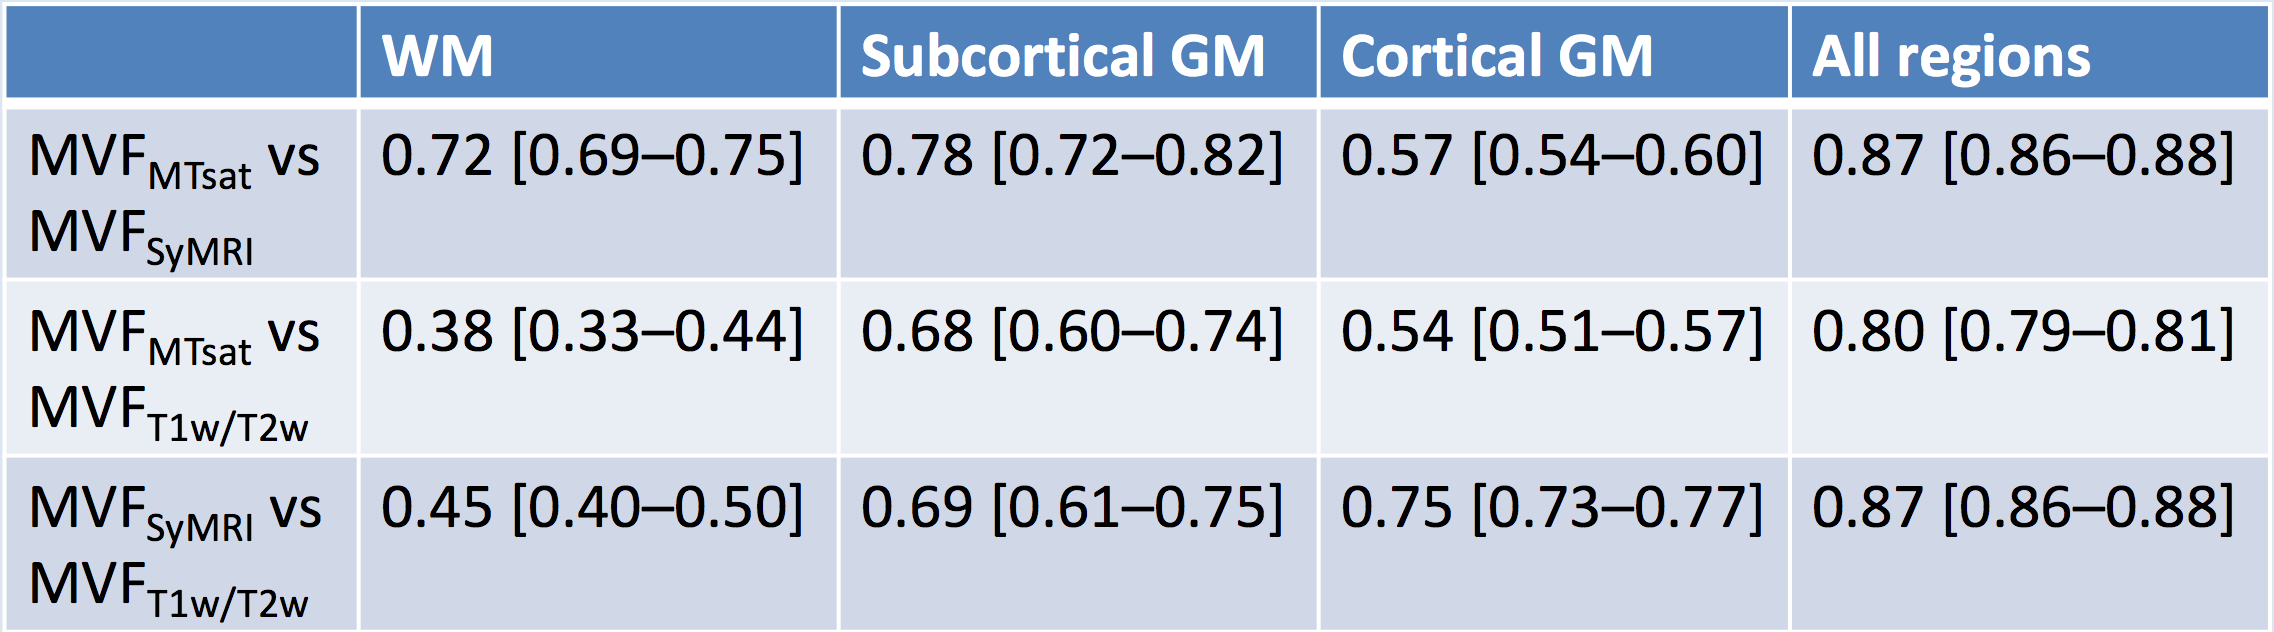
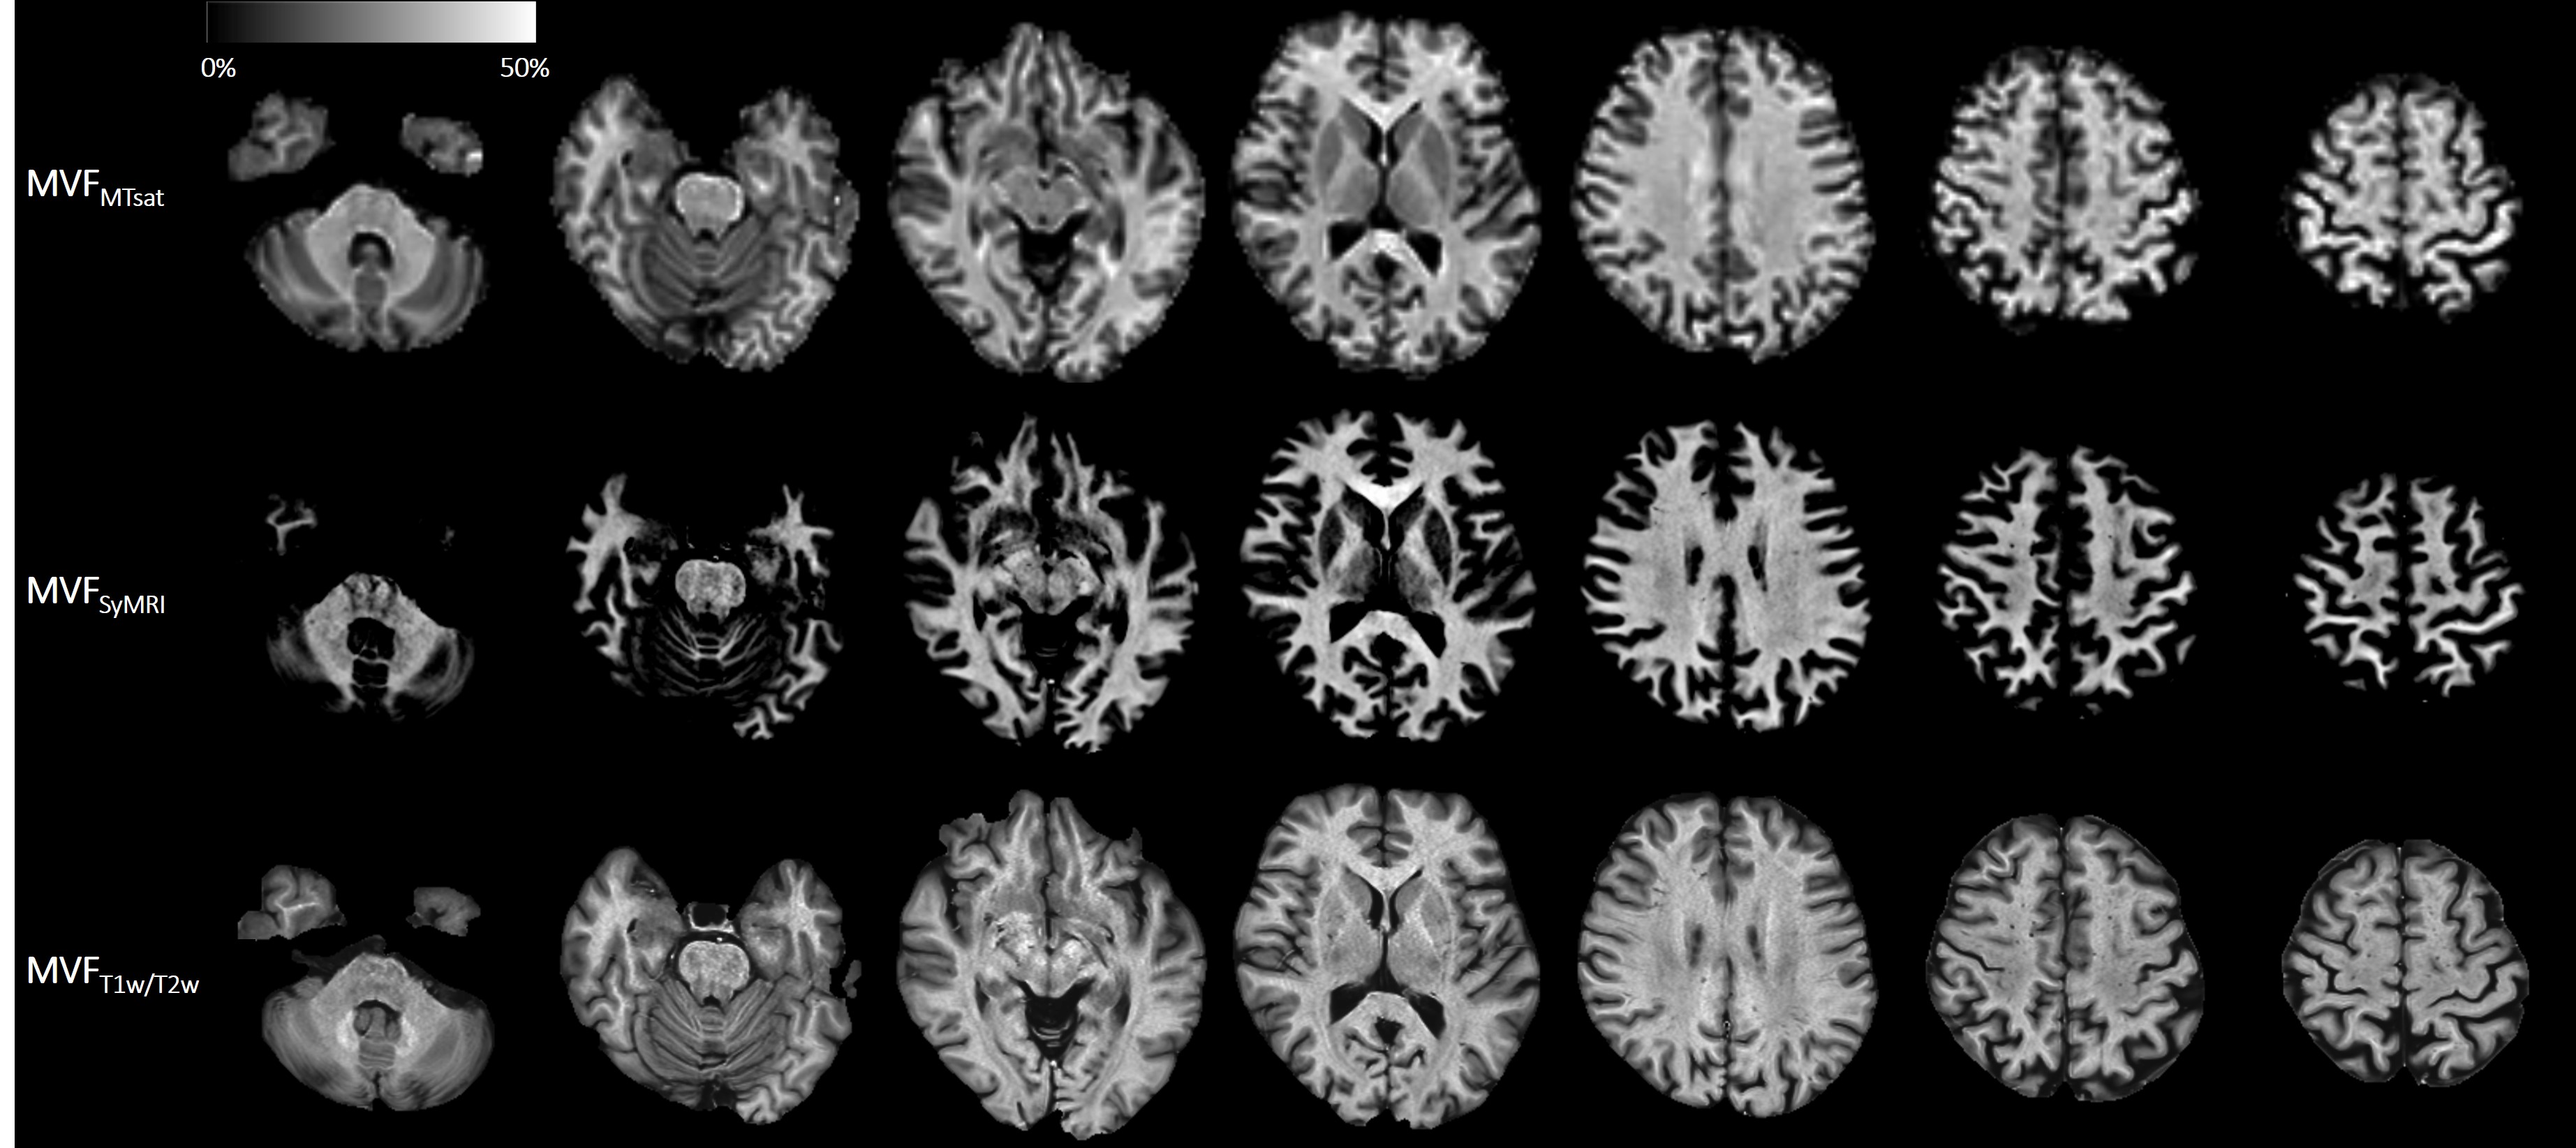
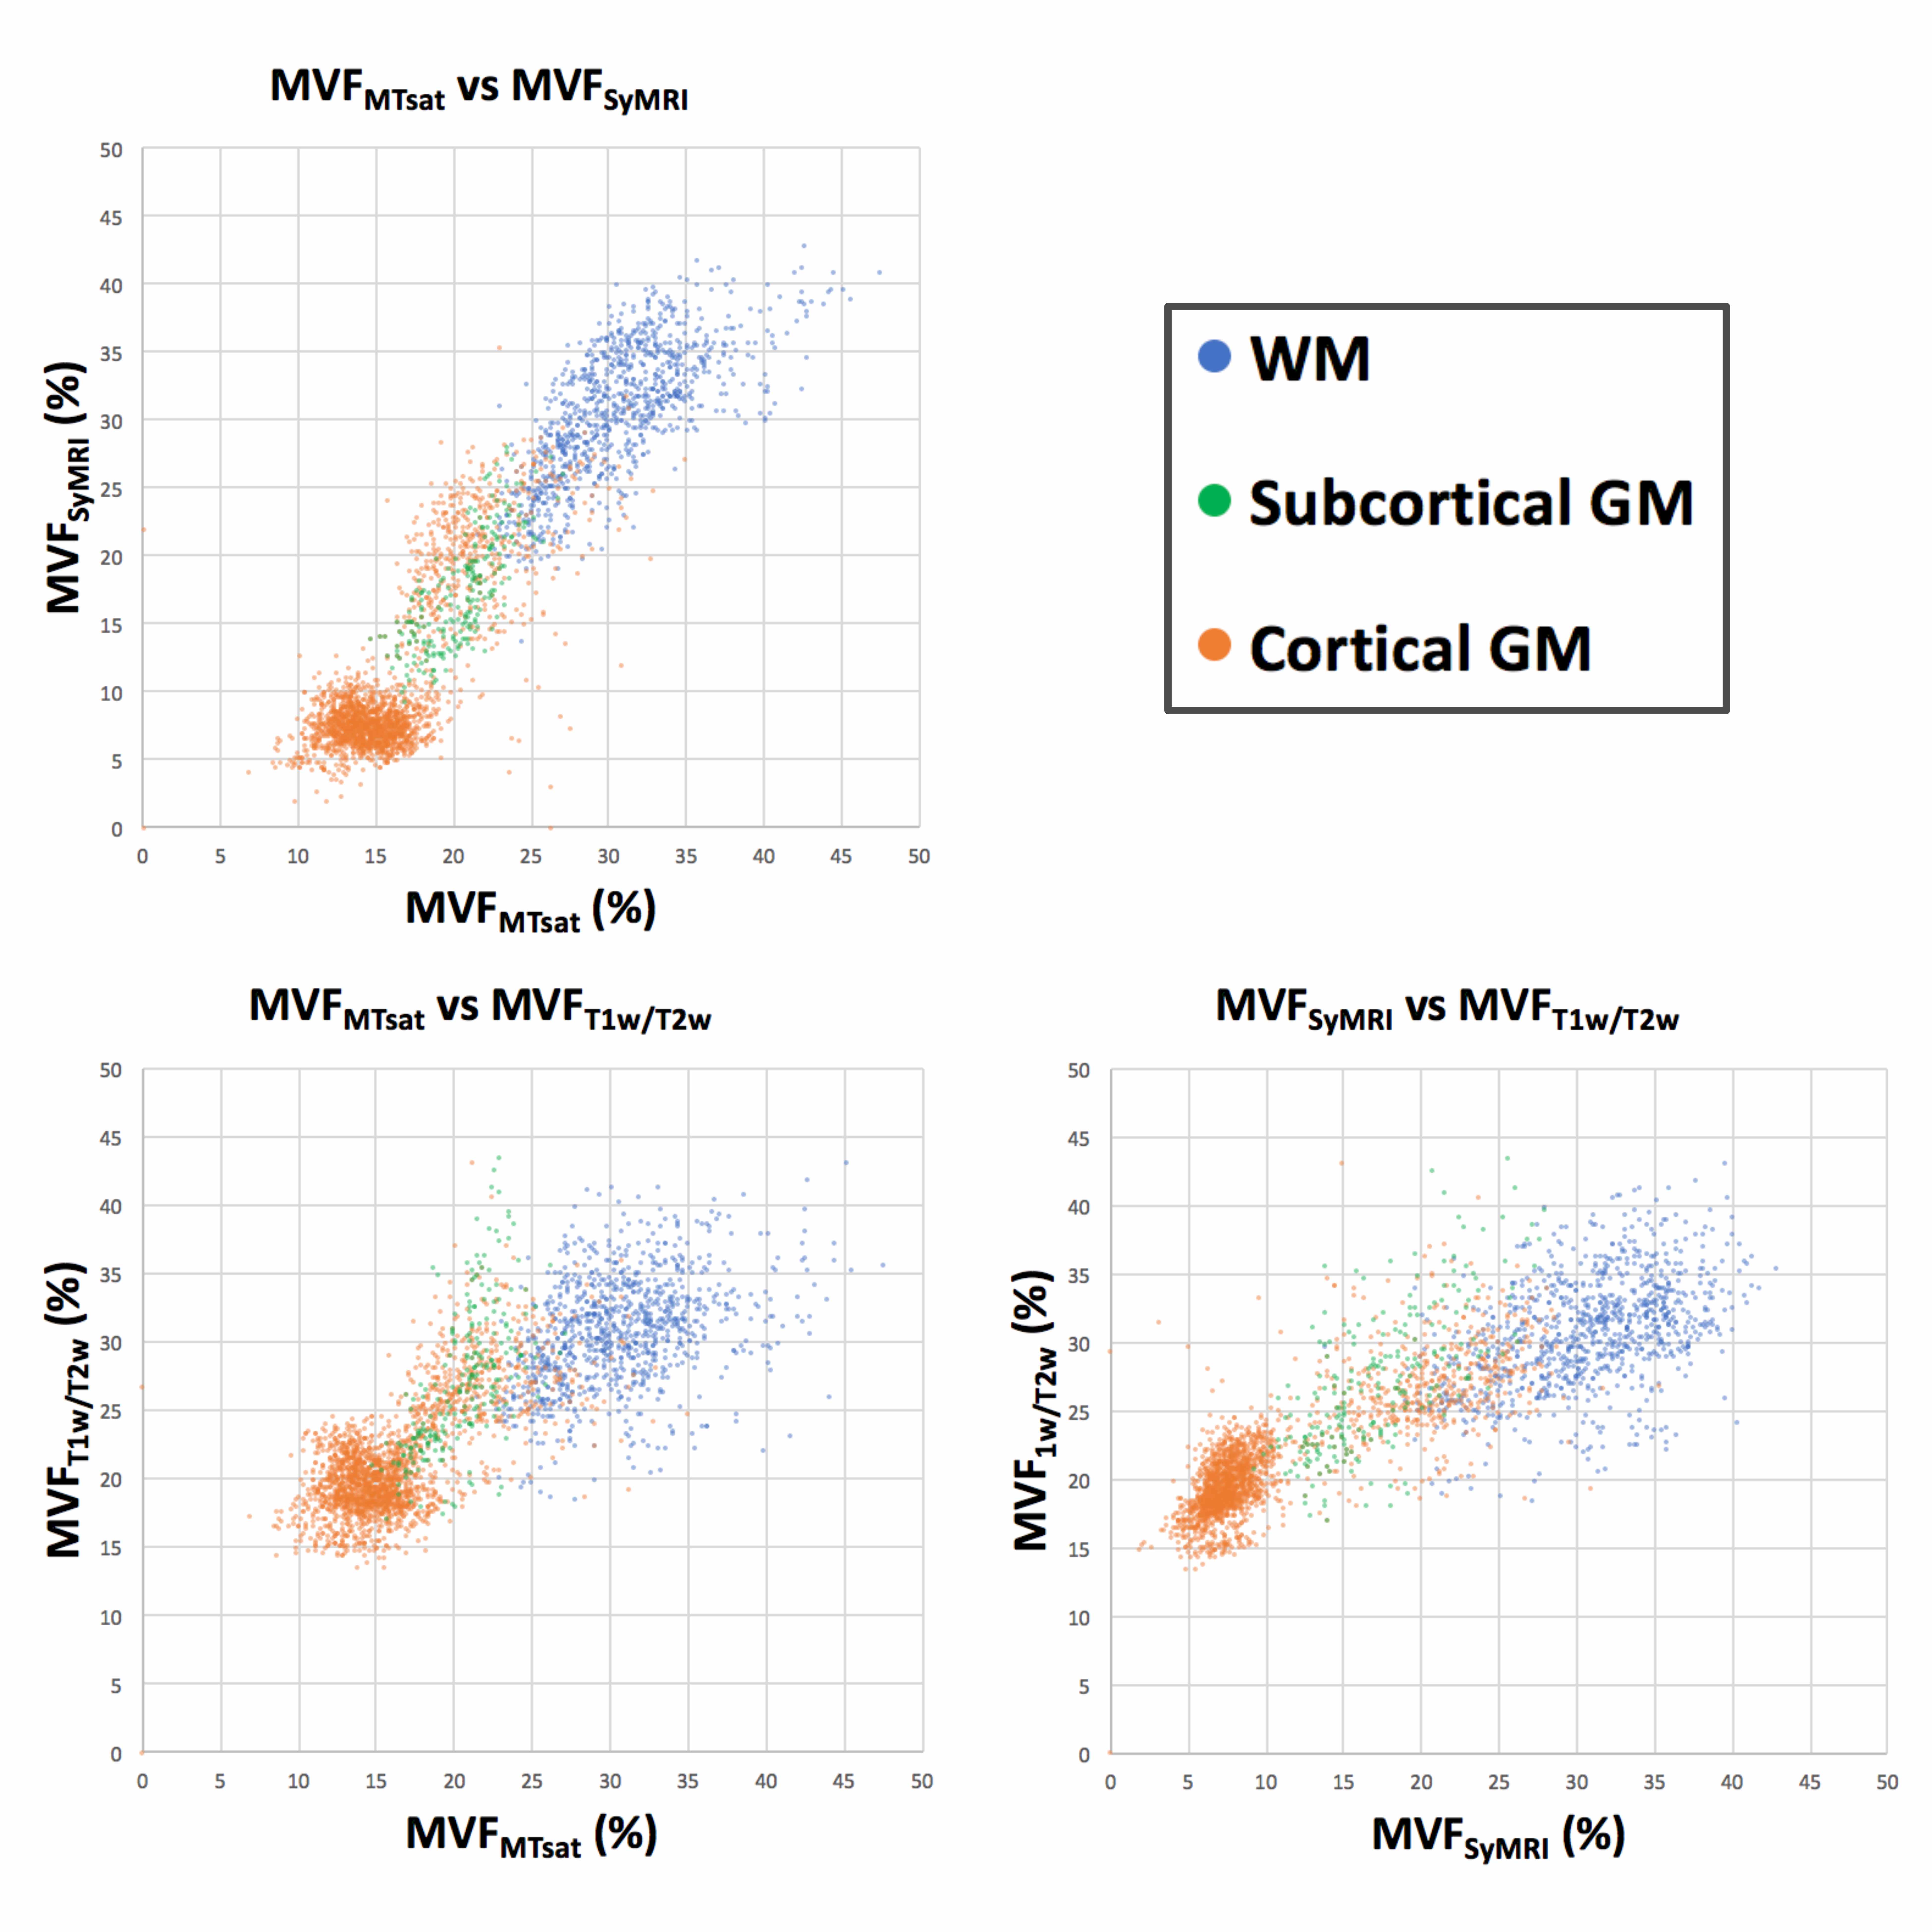
The calibration factors for MVFMTsat and MVFT1w/T2w were 8.40 and 14.5, respectively. The scatterplots of three MVF metrics are shown in Figure 2. Table 2 shows mean and SD of each MVF metric after calibration. The contrasts among WM, subcortical GM, and cortical GM were the highest for MVFSyMRI and the lowest for MVFT1w/T2w. The spearman ρ correlation coefficients among these MVF metrics are shown in Table 3. For WM, the correlation coefficient was strong and the highest between MVFMTsat and MVFSyMRI, and MVFT1w/T2w showed only weak correlation with MVFMTsat or MVFSyMRI. For subcortical and cortical GM, correlation coefficient was moderate to strong among these MVF metrics.Discussion
In this study, we investigated the concurrent validity of SyMRI myelin measurement method by comparing SyMRI with MTsat and T1w/T2w ratio in WM and GM. The mean MVF in WM was 30.70% and this value corresponds to the previously reported values (around 25-30%) of MVF in WM investigated by histology.6 Previous histological studies using Luxol Fast Blue stain showed optical densities of subcortical and cortical GM to be around 49-67% and 9.8-36% of that of WM, respectively.13, 14 In terms of WM to GM contrast, MVFSyMRI was the best fit to the results of these studies. Upon correlation study for WM, MVFSyMRI showed strong and better correlation with MVFMTsat than MVFT1w/T2w. This result shows the concurrent validity of MVFSyMRI by MVFMTsat for use in WM. Further, T1w/T2w ratio may not be a suitable candidate as a measure of myelin in WM. In subcortical and cortical GM, these three MVF metrics showed moderate to strong correlations to each other.Conclusions
MTsat and SyMRI are suitable but T1w/T2w ratio may not be suitable as a quantitative marker of myelin content in WM. Which is the best measure for estimating myelin content in GM is still inconclusive.Acknowledgements
This work was supported by ImPACT Program of Council for Science, Technology and Innovation (Cabinet Office, Government of Japan); JSPS KAKENHI grant number 16K19852; JSPS KAKENHI Grant Number JP16H06280, Grant-in-Aid for Scientific Research on Innovative Areas- Resource and technical support platforms for promoting research ’Advanced Bioimaging Support’; the Japan Radiological Society and Bayer Yakuhin (KJ-08); the Japanese Society for Magnetic Resonance in Medicine.References
1. Wu M, Kumar A, Yang S. Development and aging of superficial white matter myelin from young adulthood to old age: Mapping by vertex-based surface statistics (VBSS). Hum Brain Mapp 2016;37:1759-69
2. Ihara M, Polvikoski TM, Hall R, et al. Quantification of myelin loss in frontal lobe white matter in vascular dementia, Alzheimer's disease, and dementia with Lewy bodies. Acta Neuropathol 2010;119:579-89
3. Hagiwara A, Warntjes M, Hori M, et al. SyMRI of the Brain: Rapid Quantification of Relaxation Rates and Proton Density, With Synthetic MRI, Automatic Brain Segmentation, and Myelin Measurement. Invest Radiol 2017;52:647-57
4. Blystad I, Warntjes JB, Smedby O, et al. Synthetic MRI of the brain in a clinical setting. Acta Radiol 2012;53:1158-63
5. Warntjes M, Engstrom M, Tisell A, et al. Modeling the Presence of Myelin and Edema in the Brain Based on Multi-Parametric Quantitative MRI. Front Neurol 2016;7:16
6. Duval T, Stikov N, Cohen-Adad J. Modeling white matter microstructure. Funct Neurol 2016;31:217-28
7. Glasser MF, Van Essen DC. Mapping human cortical areas in vivo based on myelin content as revealed by T1- and T2-weighted MRI. J Neurosci 2011;31:11597-616
8. Shafee R, Buckner RL, Fischl B. Gray matter myelination of 1555 human brains using partial volume corrected MRI images. Neuroimage 2015;105:473-85
9. Ganzetti M, Wenderoth N, Mantini D. Whole brain myelin mapping using T1- and T2-weighted MR imaging data. Front Hum Neurosci 2014;8:671
10. Helms G, Dathe H, Kallenberg K, et al. High-resolution maps of magnetization transfer with inherent correction for RF inhomogeneity and T1 relaxation obtained from 3D FLASH MRI. Magn Reson Med 2008;60:1396-407
11. Mohammadi S, Carey D, Dick F, et al. Whole-Brain In-vivo Measurements of the Axonal G-Ratio in a Group of 37 Healthy Volunteers. Front Neurosci 2015;9:441
12. Campbell JS, Leppert IR, Narayanan S, et al. Promise and pitfalls of g-ratio estimation with MRI. Neuroimage 2017 [Epub ahead of print]
13. Warntjes JBM, Persson A, Berge J, et al. Myelin Detection Using Rapid Quantitative MR Imaging Correlated to Macroscopically Registered Luxol Fast Blue-Stained Brain Specimens. AJNR Am J Neuroradiol 2017;38:1096-102
14. Khodanovich MY, Sorokina IV, Glazacheva VY, et al. Histological validation of fast macromolecular proton fraction mapping as a quantitative myelin imaging method in the cuprizone demyelination model. Sci Rep 2017;7:46686
Figures