3184
NODDI-DTI as proxy for Axonal Volume Fraction: Is g-ratio-weighted imaging feasible using single-shell DTI data?1Spinal Cord Injury Center, Balgrist University Hospital, University of Zurich, Zurich, Switzerland, 2Wellcome Trust Centre for Neuroimaging, UCL Institute of Neurology, London, United Kingdom, 3Department of Neurophysics, Max Planck Institute for Human Cognitive and Brain Sciences, Leipzig, Germany
Synopsis
G-ratio-weighted imaging is an active field of research with the goal of better characterizing white matter in both health and disease. However, clinical adoption is significantly hampered by the fact that most g-ratio protocols rely on time-intensive multi-shell diffusion data which is typically not available in clinical settings. In this study, we adopted the recently introduced NODDI-DTI in combination with magnetization transfer saturation to calculate g-ratio maps based on a single diffusion shell in healthy subjects. The so-acquired g-ratio maps greatly resembled maps from the literature and had high scan-rescan repeatability, which has great implications for clinical g-ratio-weighted imaging.
Introduction and theory
G-ratio is an intrinsic property of white matter, representing the ratio between the inner and outer diameter of the myelinated axons. In recent years, in-vivo g-ratio-weighted imaging has received great attention because of its ability to express relative myelination and distinguish demyelination from axonal loss. G-ratio can be estimated using the formula1:
g=sqrt(1/(1+MVF/AVF)) (Formula 1)
where MVF and AVF represent myelin and axonal volume fraction, respectively, which can be measured in-vivo using MRI techniques. However, in most implementations (such as NODDI), estimation of AVF relies on multi-shell diffusion data, which is rarely acquired in clinical settings and also prevents retrospective use of single-shell DTI data.
Recently, Edwards et al. derived relations connecting NODDI and DTI parameters under the assumption of no free water compartment in the diffusion model2. This NODDI-DTI model has been shown to provide reasonable estimates of intra-cellular component (νic) on the basis of a single-shell DTI data using the formula2:
νic=1-sqrt(3/2d·(MD+b/6(∑i,j(1+2δi,j)λiλj/15))-1/2) (Formula 2)
where λ and MD denote the DTI eigenvalues and mean diffusivity, respectively, while b is the b-value and d is fixed parameter (1.7·10-3 mm2/s), and δ is the Kronecker delta. Using νic as proxy for AVF in combination with MT saturation (MTsat) as proxy for MVF, the formula for g-ratio becomes1
g=sqrt(1/(1+α·MTsat/(1-α·MTsat)/νic)) (Formula 3)
where α is a scaling factor.
In this study, we calculated g-ratio maps by estimating νic using NODDI-DTI instead of NODDI. Relying on single-shell data, the feasibility of this approach would pave the way for clinical application of g-ratio-weighted imaging.
Methods
27 healthy volunteers (all males, age: 37.9±12.54 yrs) were scanned on a 3T Siemens SkyraFit system. Subjects were scanned twice with an interval of 3 months. A multi-parametric mapping protocol consisting of three 3D multi-echo gradient-echo FLASH sequences with predominant PD-, MT-, and T1-weighting was applied. Acquisition parameters were (number of echoes/TR/flip angle): PDw (8/25ms/4°), MTw (6/37ms/9°), T1w (8/25ms/23°). Other parameters: resolution=1x1x1mm3, FOV=176x224x256 mm3, TA=18:00 min. MTsat maps were generated using the VBQ3.
DTI data were acquired using a single-shot spin-echo EPI sequence with 60 diffusion-weighted (b=1200 s/mm2) and 7 T2w (b=0 s/mm2) images covering the whole brain with 56 slices of 2.5 mm. Acquisition parameters were: resolution=2.5x2.5 mm2, FOV=220x220 mm2, TE/TR=80/7600 ms, TA=08:54 min. The dataset was corrected for motion-, eddy-current-, and susceptibility-artifacts using FSL’s eddy. DTI eigenvalues were obtained using the ACID toolbox4.
G-ratio maps were computed according to Formula(3) after co-registering the DTI images to the MTw image using SPM’s coreg. The MTsat maps were normalized using DARTEL and the resulting transformation was applied on the g-ratio maps. α was determined similar to Ellerbrock et al.5, by scaling the group-average g-ratio map in the splenium to match the histologically determined value of 0.7. Note that the same α was used for both time points.
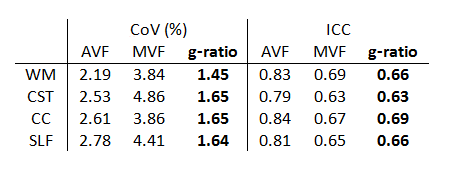
Maps of AVF, MVF, and g-ratio were created and averaged across subjects in the whole white matter and in three selected WM tracts including corticospinal tract (CST), corpus callosum (CC) and superior longitudinal fasciculus (SLF). Scan-rescan repeatability was assessed using coefficient of variation (CoV) and intra-class coefficient (ICC).
Results
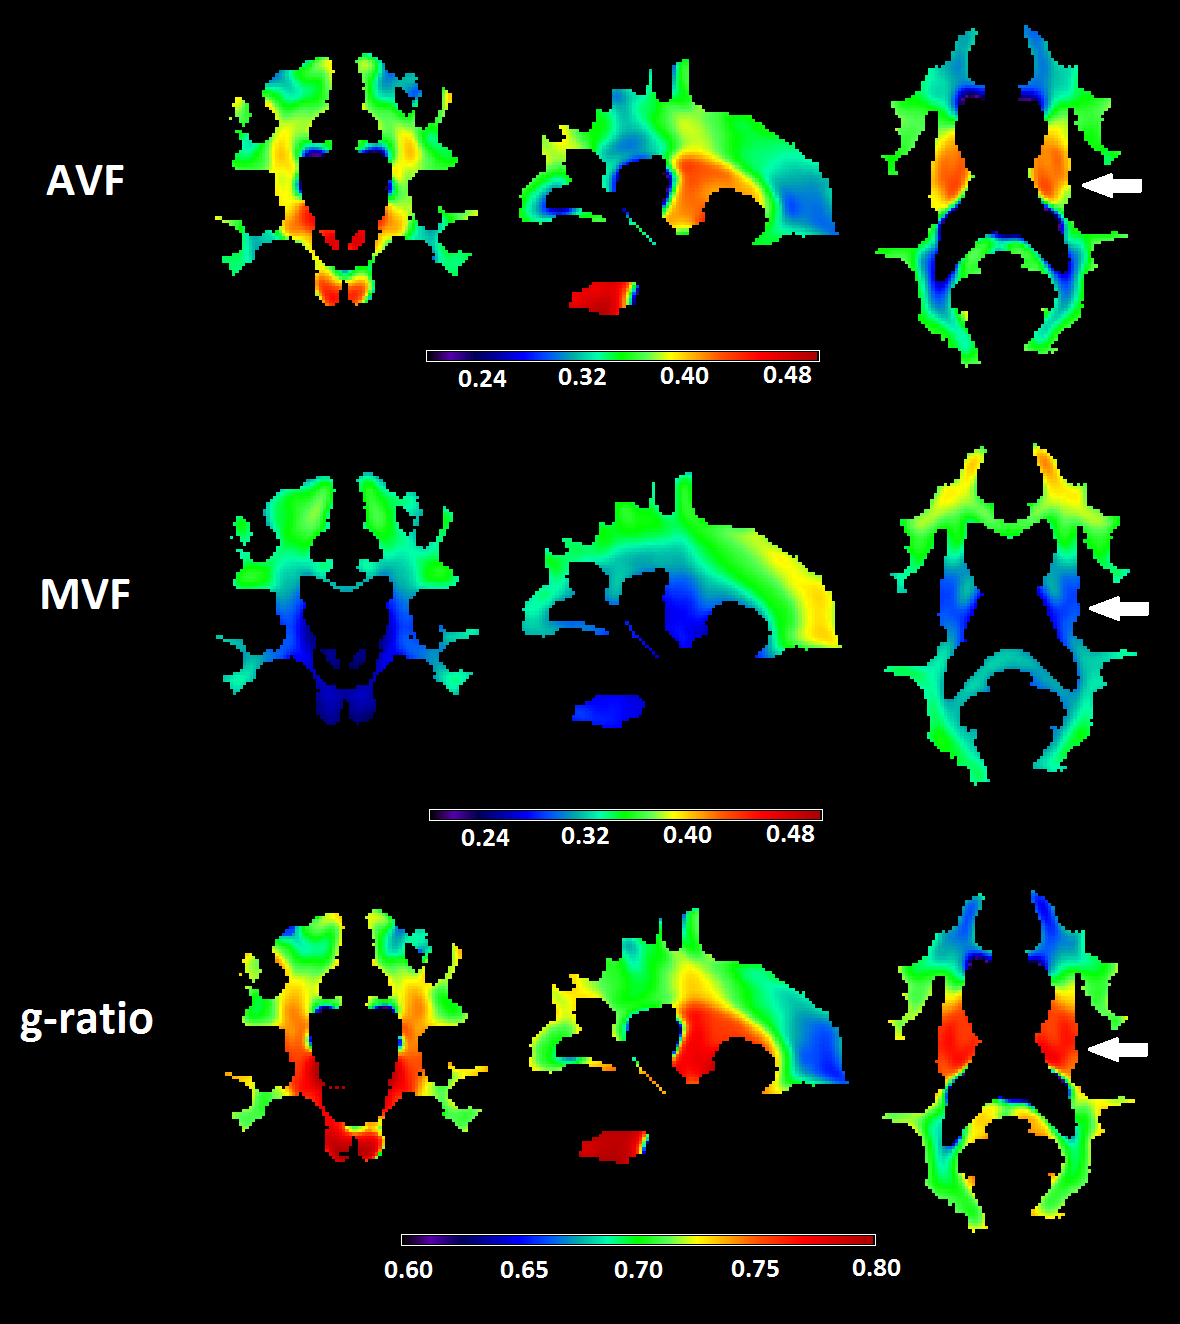
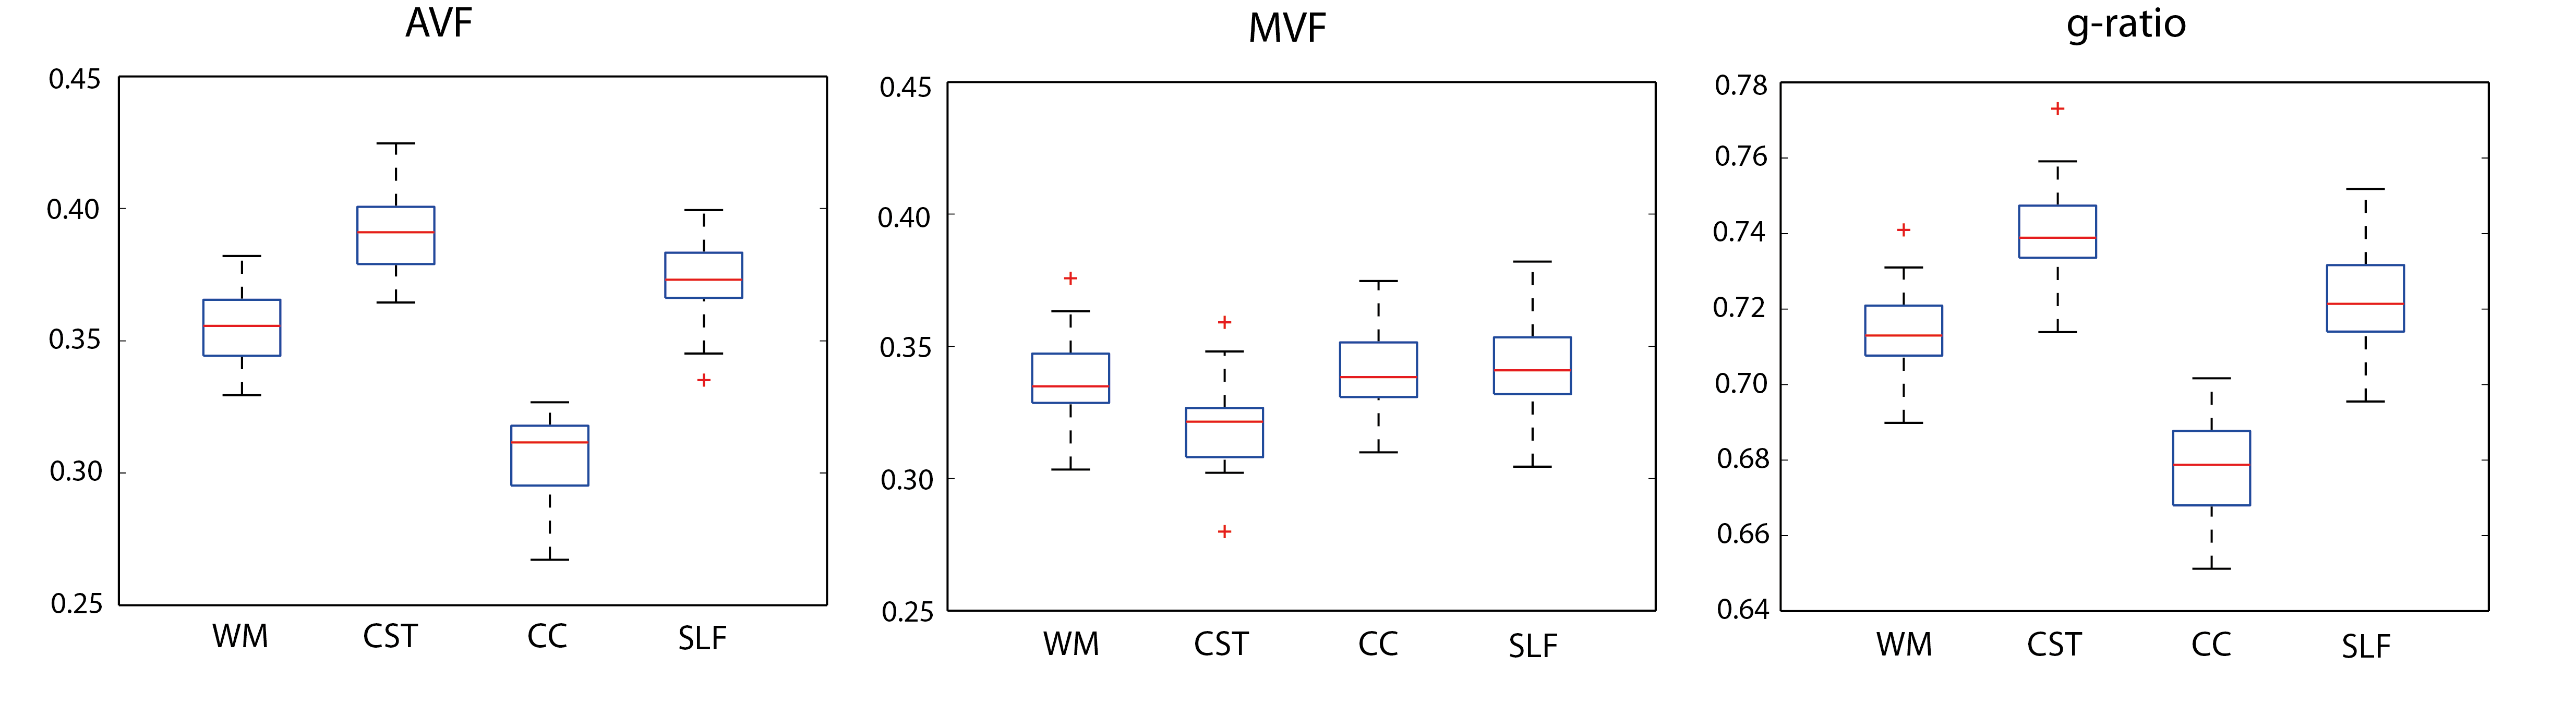
The scaling factor was found to be α=0.0818. AVF values ranged between 0.25-0.45 across the WM (Fig.1) and were overall very similar to those obtained by NODDI1. The CC and SLF had above-average, while CC had lower-average AVF value (Fig.2). The variation in MVF was considerably lower; investigated tracts had similar values except for CC which had lower value. G-ratio was relatively constant around 0.7 across the WM (Fig.1). Deviations were found in the CST (higher value) and in the CC (lower value) (Fig.2). In all WM tracts, scan-rescan repeatability was good for MVF (CoV<5%, ICC>0.6) and was excellent for AVF (CoV<3%, ICC>0.75) (Table 1). G-ratio had high repeatability with CoV between 1-2% and ICC between 0.6-0.7.Discussion and conclusion
In this paper, we performed g-ratio-weighted imaging on single-shell diffusion data using NODDI-DTI as proxy for AVF. The so-acquired AVF and g-ratio maps greatly resembled known findings which were obtained using a more time-intensive multi-shell protocol. In particular, CST was found to have higher AVF and g-ratio. The scan-rescan repeatability of AVF, MVF and g-ratio were good to excellent in all investigated tracts. These results suggest that NODDI-DTI in combination with MTsat can produce anatomically valid and reliable g-ratio maps. As most clinical diffusion data are based on a single shell, this approach has great implications for clinical applications of g-ratio-weighted imaging. However, further testing and validation is required in patients where the assumptions associated with NODDI-DTI (no free water compartment, fixed diffusivity, etc.) can be substantially violated.Acknowledgements
This project has received funding from the International Foundation for Research in Paraplegia (Contract No.: P 158).References
(1) Stikov N, Campbell JS, Stroh T, Lavelée M, Frey S, Novek J, Nuara S, Ho MK, Bedell BJ, Dougherty RF, Leppert IR, Boudreau M, Narayanan S, Duval T, Cohen-Adad J, Picard PA, Gasecka A, Côté D, Pike GB. Quantitative analysis of the myelin g-ratio from electron microscopy images of the macaque corpus callosum. Data Brief. 2015 Jun 17;4:368-73.
(2) Edwards L, Pine K, Weiskopf N, Mohammadi S. NODDI-DTI: extracting neurite orientation and dispersion parameters from a diffusion tensor. bioRxiv 077099; 2017 Jan.
(3) Draganski B, Ashburner J, Hutton C, Kherif F, Frackowiak RS, Helms G, Weiskopf N. Regional specificity of MRI contrast parameter changes in normal ageing revealed by voxel-based quantification (VBQ). Neuroimage. 2011 Apr 15;55(4):1423-34.
(4) Mohammadi S, Freund P, Feiweier T, Curt A, Weiskopf N. The impact of post-processing on spinal cord diffusion tensor imaging. Neuroimage. 2013 Apr 15;70:377-85.
(5) Ellerbrock I, Mohammadi S. Four in vivo g-ratio-weighted imaging methods: Comparability and repeatability at the group level. Hum Brain Mapp. 2017 Nov 1.
(6) Mohammadi S, Carey D, Dick F, Diedrichsen J, Sereno MI, Reisert M, Callaghan MF, Weiskopf N. Whole-Brain In-vivo Measurements of the Axonal G-Ratio in a Group of 37 Healthy Volunteers. Front Neurosci. 2015 Nov.; 9: 441
(7) Cercignani M, Giulietti G, Dowell NG, Gabel M, Broad R, Leigh PN, Harrison NA, Bozzali M. Characterizing axonal myelination within the healthy population: a tract-by-tract mapping of effects of age and gender on the fiber g-ratio. Neurobiology of Aging 49 (2017) 109-118
(8) Duval T, Smith V, Stikov N, Klawiter EC, Cohen-Adad J. Scan-rescan of axcaliber, macromolecular tissue volume, and g-ratio in the spinal cord. Magn Reson Med. 2017 Oct 10.
Figures