3182
Comparing MEGA editing techniques for in-vivo measurement of 2-hydroxyglutarate1University College London, London, United Kingdom, 2Queen Square MS Centre, Department of Neuroinflammation, UCL Institute of Neurology, Faculty of Brain Sciences, University College London, London, United Kingdom
Synopsis
MEGA-semiLASER is compared to a previously proposed MRS sequence for 2HG detection, MEGA-PRESS. The sequences are assessed using simulations of SNR with TE and the chemical shift displacement error (CSDE). Both sequences are shown to maximise 2HG SNR at TE of approximately 100ms. MEGA-semiLASER displays marginally higher SNR whilst reducing the CSDE of MEGA-PRESS. MEGA-semiLASER should offer a comparable reduction in CSDE to another proposed sequence, MEGA-LASER, whilst requiring fewer refocusing pulses and thus a lower SAR.
Purpose
The measurement of the oncometabolite 2-hydroxyglutarate (2HG) has garnered significant interest in recent years because it can provide information that offers major diagnostic and prognostic value in gliomas. 2HG is overproduced in gliomas with mutations in the isocitrate dehydrogenase (IDH) genes1 meaning that detection of 2HG can be used to non-invasively probe IDH mutation status in alternative to invasive brain biopsy. A number of sequences have been suggested for this purpose2-6. Among these, two Mescher-Garwood7 (MEGA) difference editing techniques offer the potential to be highly specific by measuring the H2 resonance of 2HG at 4.02 ppm: MEGA-PRESS2,7 and MEGA-LASER3
However, MEGA-PRESS suffers chemical shift displacement error (CSDE) which compromises localisation and accurate quantification; whilst MEGA-LASER effectively reduces CSDE, it requires additional refocusing pulses, increasing specific absorption rate (SAR). MEGA-semiLASER8 is of interest because whilst reducing CSDE compared to MEGA-PRESS, it requires fewer rf pulses compared to MEGA-LASER. Hence we investigate MEGA-semiLASER compared to MEGA-PRESS to assess: a) the optimal TE maximising 2HG signal, and b) CSDE for 2HG.
Methods
The MRS simulation framework was built using the GAMMA C++ Library9. Sequence parameters were chosen to match published protocols for 2HG measurement at 3T2,3. MEGA-PRESS was simulated using MAO refocusing pulses (BW = 1.15 kHz, B1max = 1000 Hz, duration = 5.2 ms). MEGA-semiLASER was simulated using GOIA-W(16,4)10 (BW = 20 kHz, B1max = 817 Hz, duration = 3.5 ms) refocusing pulses. A central frequency of 2.7 ppm was used for all rf pulses. For both sequences, gaussian editing pulses had 21.4 ms duration, 44 Hz bandwidth and were centred either on the 1.9 ppm resonance of 2HG (ON) or at 7.5 ppm (OFF). Ideal 90o excitation pulses were used, thus simulations were performed only across a 2D space. Simulated spectra were broadened with a line width of 6Hz to match typical in vivo resolution.
SNR dependence on TE
DIFF = OFF - ON spectra were simulated for 25 TE values from 65 to 150 ms over a nominal voxel of interest (VOI) of 25mm x 25mm, with 10 steps in each direction and the resulting spectra summed across the voxel. Only the signal from within the selected voxel was considered under the assumption of ideal outer volume suppression. The H2 resonance of 2HG at 4.02 ppm was quantified by computing its integral from 3.85 to 4.15 ppm to find the TE resulting in maximal SNR.
CSDE assessment
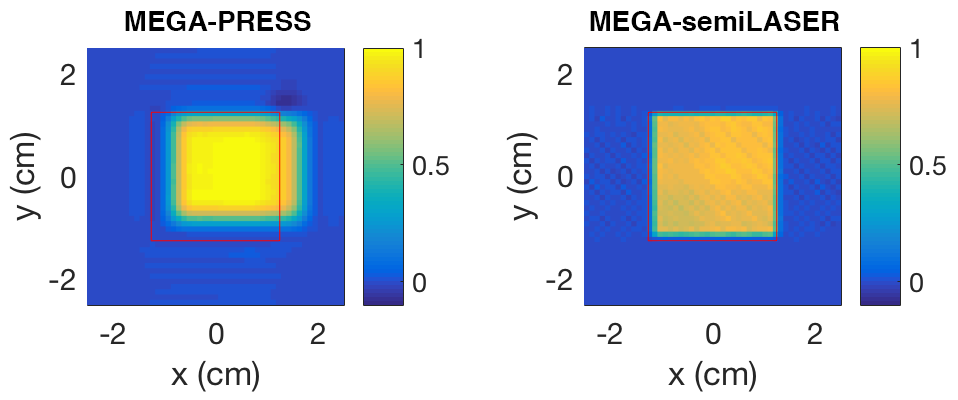
To visualise CSDE for each sequence, the 2HG system was simulated at the optimised TE across a region twice the size of the VOI with 50 subdivisions in each direction. The integral under the 4.02 ppm resonance was evaluated as above at each sub-voxel position to create a spatial map of the signal intensity. The integrated signal over the VOI was also calculated.
Results
SNR dependence on TE
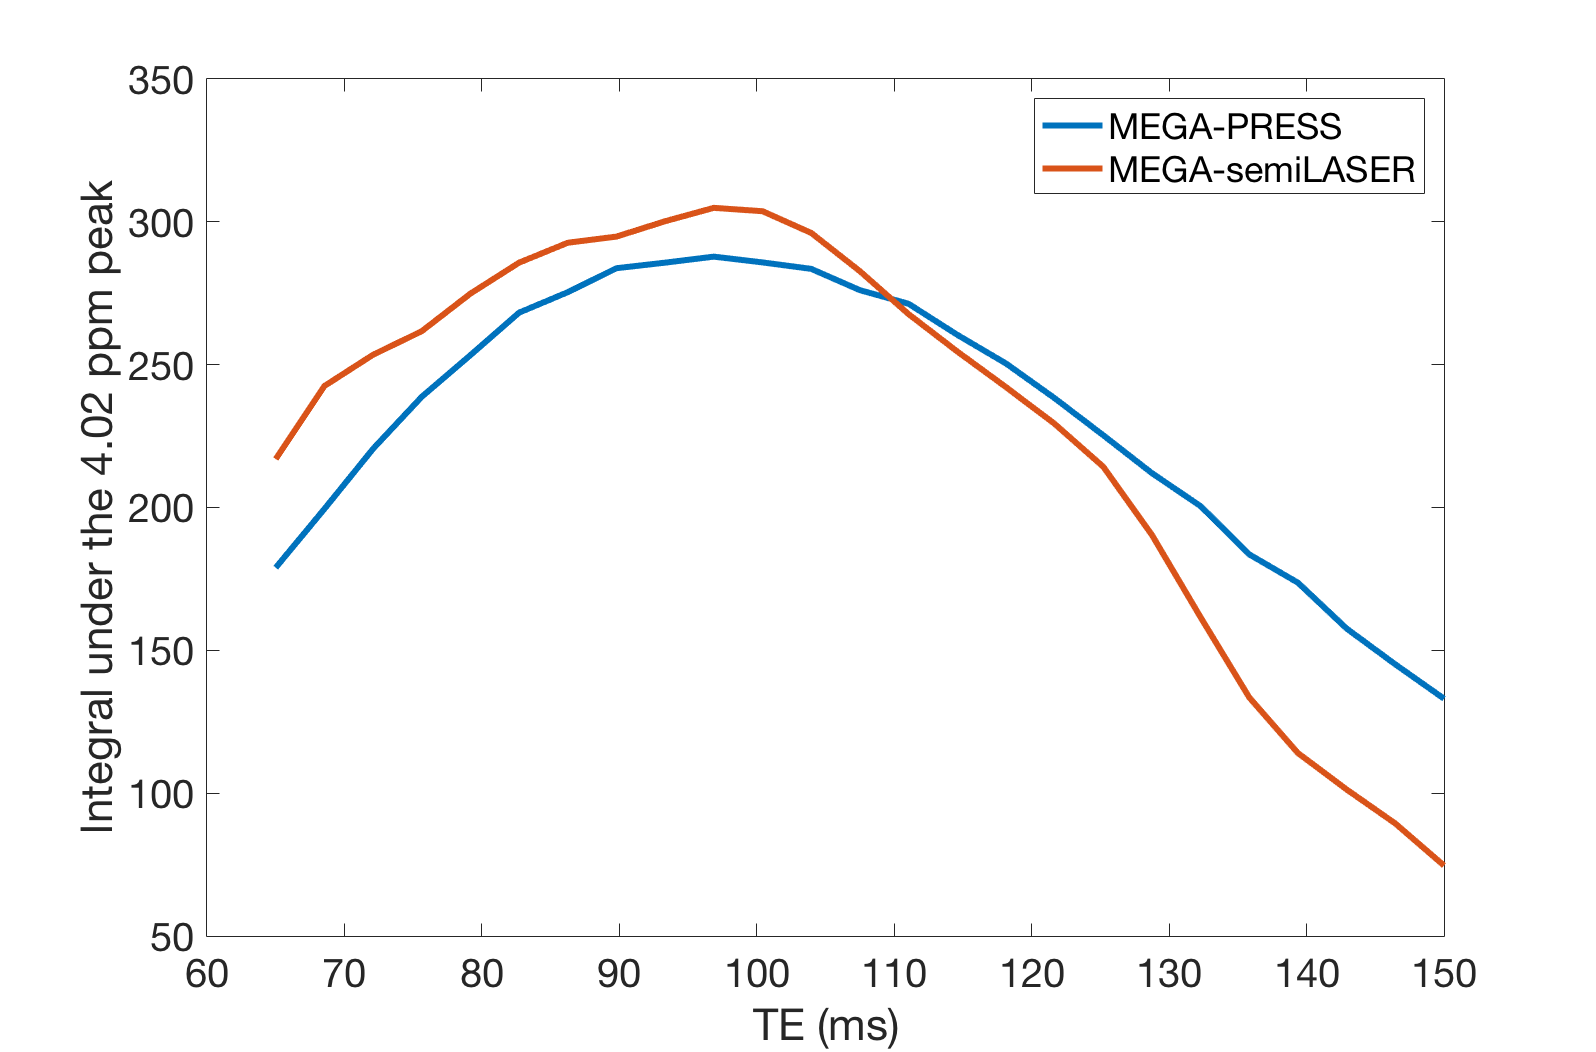
The TE dependence of the 2HG 4.02 ppm resonance is shown in Fig 1. Highest SNR was observed for both sequences for at TE = 97ms. A TE of 100 ms was used in subsequent simulations, which agrees with the optimum to within the TE step size. MEGA-semiLASER gives the highest SNR at TE = 100 ms with a reduction of 6% for MEGA-PRESS.
CSDE
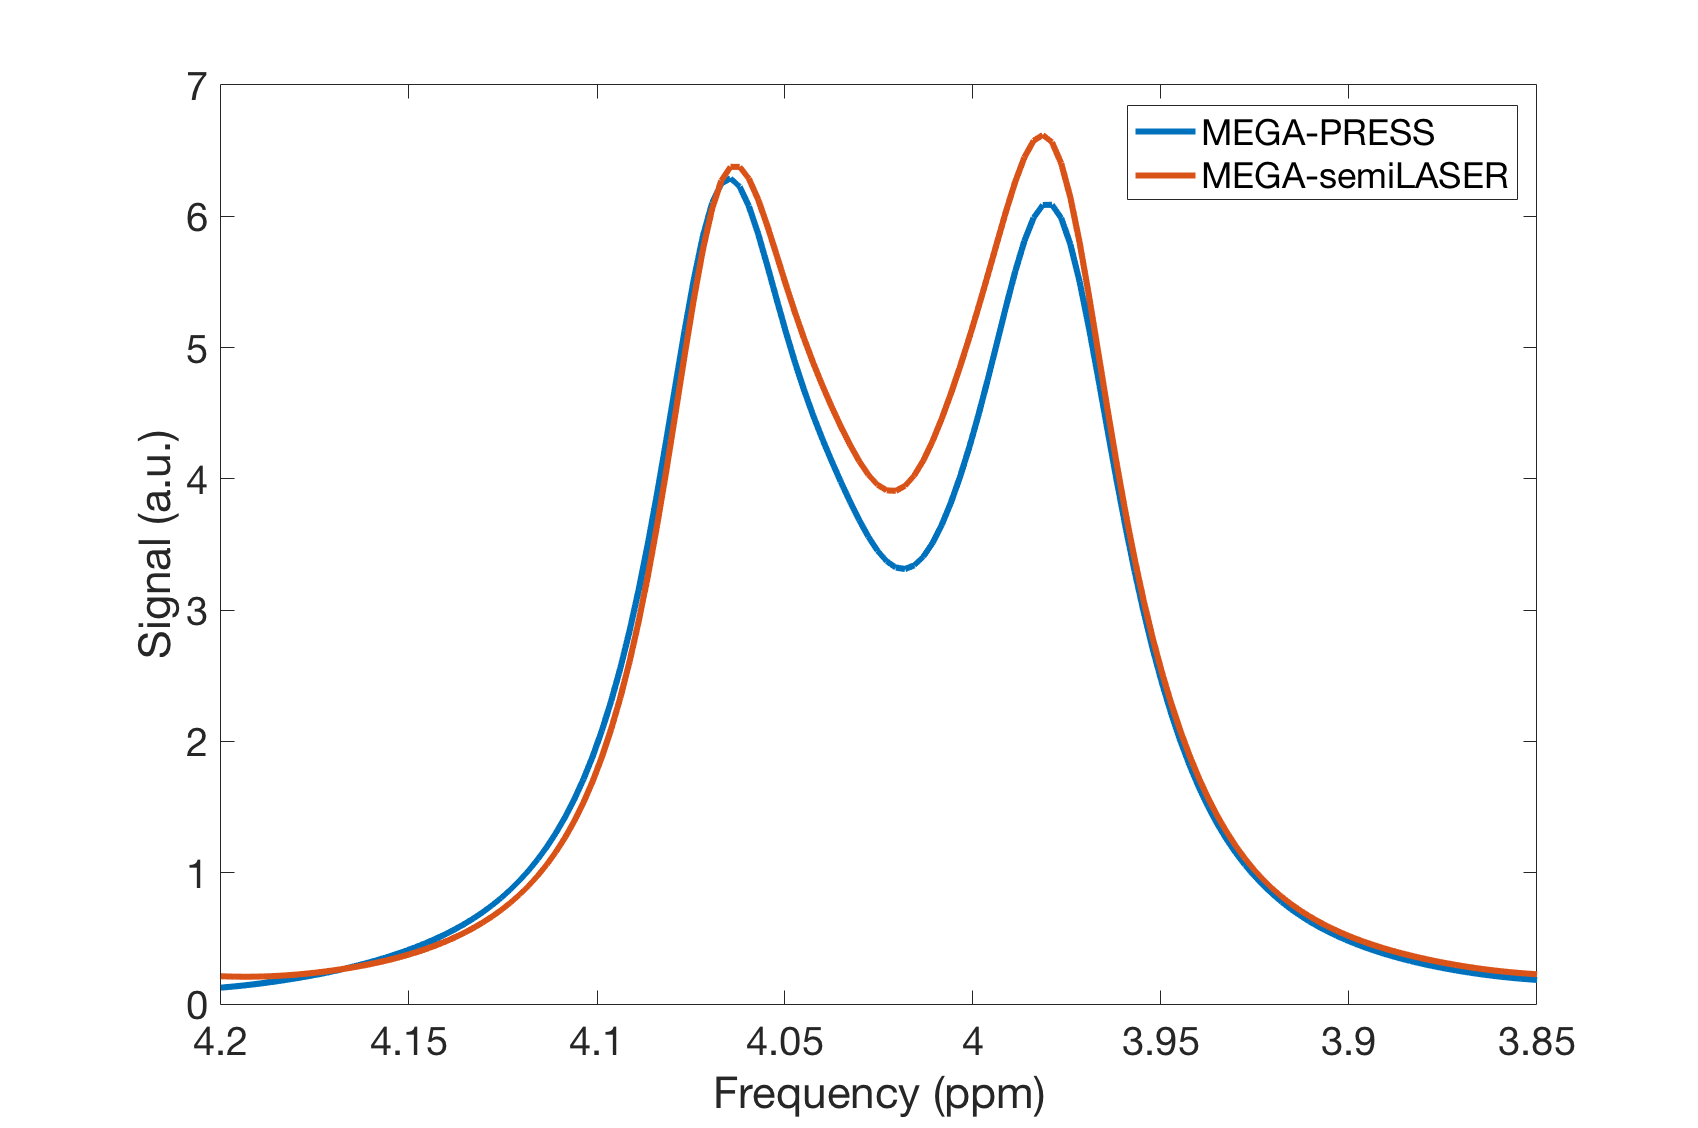
Fig. 2 clearly shows a large CSDE due to the low-bandwidth refocusing pulses in MEGA-PRESS. A shift in x of 4 mm and 3 mm in y is visible. MEGA-semiLASER shows very little displacement. The DIFF spectra for the H2 2HG resonance integrated over the VOI are shown in Fig. 3.
Discussion
TE=100ms was shown to be optimal for 2HG detection with MEGA-semiLASER. This is comparable to the optimal TE for MEGA-PRESS as shown here and in previous work.2 This is slightly longer than the published optimal TE=75ms for MEGA-LASER3. Similar overall H2 resonance SNR over the VOI was also shown for MEGA-PRESS and MEGA-semiLASER. As expected, and thanks to the higher bandwidth refocusing pulses MEGA-semiLASER effectively reduces the H2 resonance CSDE to negligible levels. This CSDE reduction is similar to what has been shown for GABA editing with MEGA-LASER11; at the same time MEGA-semiLASER affords a 33% SAR reduction vs MEGA-LASER for the same rf pulses.Conclusion
Our simulations show that MEGA-semiLASER offers similar signal yield and highly reduced CSDE compared to MEGA-PRESS for specific detection of 2HG; it could therefore be lower SAR alternative to MEGA-LASER, hence particularly useful at ultra high field. Future work includes implementation of MEGA-LASER as well as validation of the simulations in phantom and in vivo.Acknowledgements
This work is supported by the EPSRC-funded UCL Centre for Doctoral Training in Medical Imaging (EP/L016478/1) and the Department of Health’s NIHR-funded Biomedical Research Centre at UCLH This work is supported by the EPSRC-funded UCL Centre for Doctoral Training in Medical Imaging (EP/L016478/1) and the Department of Health’s NIHR-funded Biomedical Research Centre at UCLHReferences
- D.W.Parsons et al., An Integrated Genomic Analysis of Human Glioblastoma Multiforme. Science, 2008;321(5897):1807–1812.
- C. Choi et al., 2-hydroxyglutarate detection by magnetic resonance spectroscopy in IDH-mutated glioma patients. Nature medicine. 2012;18(4):624-629.
- O.C. Andronesi et al., Detection of 2-Hydroxyglutarate in IDH-mutated Glioma Patients by Spectral-editing and 2D Correlation Magnetic Resonance Spectroscopy. Science translational medicine. 2012;4(116):116ra4.
- A. Berrington et al., Improved localisation for 2-hydroxyglutarate detection at 3T using long-TE semi-LASER. Tomography : a journal for imaging research. 2016;2(2):94-105.
- Z. An et al. Detection of 2-hydroxyglutarate in brain tumors by triple-refocusing MR spectroscopy at 3T in vivo. Magn Reson Med. 2017;78(1):40-48
- G. Verma et al. Non-invasive detection of 2-hydroxyglutarate in IDH-mutated gliomas using two-dimensional localized correlation spectroscopy (2D L-COSY) at 7 Tesla. J Transl Med. 2016 Sep 22;14(1):274
- Mescher, M et al. Simultaneous in vivo spectral editing and water suppression. NMR Biomed. 1998;11: 266–272.
- Andreychenko, A et al. Efficient spectral editing at 7 T: GABA detection with MEGA-sLASER. Magnetic Resonance Medicine. 2012;68: 1018–1025.
- S.A. Smith et al.. Computer Simulations in Magnetic Resonance. An Object Oriented Programming Approach, J. Magn. Reson. 1994;106a.
- O.C. Andronesi et al. Spectroscopic imaging with improved gradient modulated constant adiabaticity pulses on high-field clinical scanners. J. Magn. Reson. 2010;203(2):283–293.
- Bogner W et al. 3D GABA imaging with real-time motion correction, shim update and reacquisition of adiabatic spiral MRSI. NeuroImage. 2014;103:290-302.
Figures