3181
Multi-echo OxFlow for quantification of the cerebral metabolic rate of oxygen at 1.5T, 3T, and 7T1Radiology, University of Pennsylvania, Philadelphia, PA, United States
Synopsis
Fick’s principle can be used to quantify the cerebral metabolic rate of oxygen (CMRO2) as the product of oxygen extraction and blood flow. An interleaved dual-slice multi-echo GRE and phase contrast sequence, termed OxFlow, has previously been used for simultaneous measurement of SvO2 and blood flow. Here, we developed and evaluated an extended multi-echo OxFlow sequence designed for operation at multiple field strengths. The rate of phase accumulation, rather than the inter-echo phase difference, is used to compute SvO2. Results were obtained in 5 healthy subjects at 1.5T, 3T, and 7T, with agreement of the physiologic parameters between field strengths.
Introduction
The cerebral metabolic rate of oxygen (CMRO2) is an important physiologic parameter, calculated via Fick’s principle as the product of the oxygen carrying capacity of arterial blood (CaO2), total cerebral blood flow (tCBF), and oxygen extraction fraction equal to the difference between arterial and venous oxygen saturations (SaO2 and SvO2, respectively). One can compute whole-brain CMRO2 with MRI by measuring tCBF in the internal carotid and vertebral arteries and SvO2 in a draining vein, such as the superior sagittal sinus (SSS). OxFlow1 combines susceptometry-based oximetry (to compute SvO2)2 and phase contrast (to measure tCBF)3 yielding fast quantification of whole-brain CMRO2. Previous iterations of OxFlow were optimized for a specific field strength (e.g. 1.5T4 or 3T1). Here, we extend OxFlow for use at 7T and demonstrate that the same sequence may be used at 1.5T and 3T. In addition to increased rate of phase accumulation, susceptibility-based oximetry is more difficult at ultrahigh field because blood R2* scales supralinearly with B0.5 To address this problem, the inter-echo spacing was reduced and a magnitude signal-weighted determination of the rate of phase accrual was used to compute SvO2.Methods
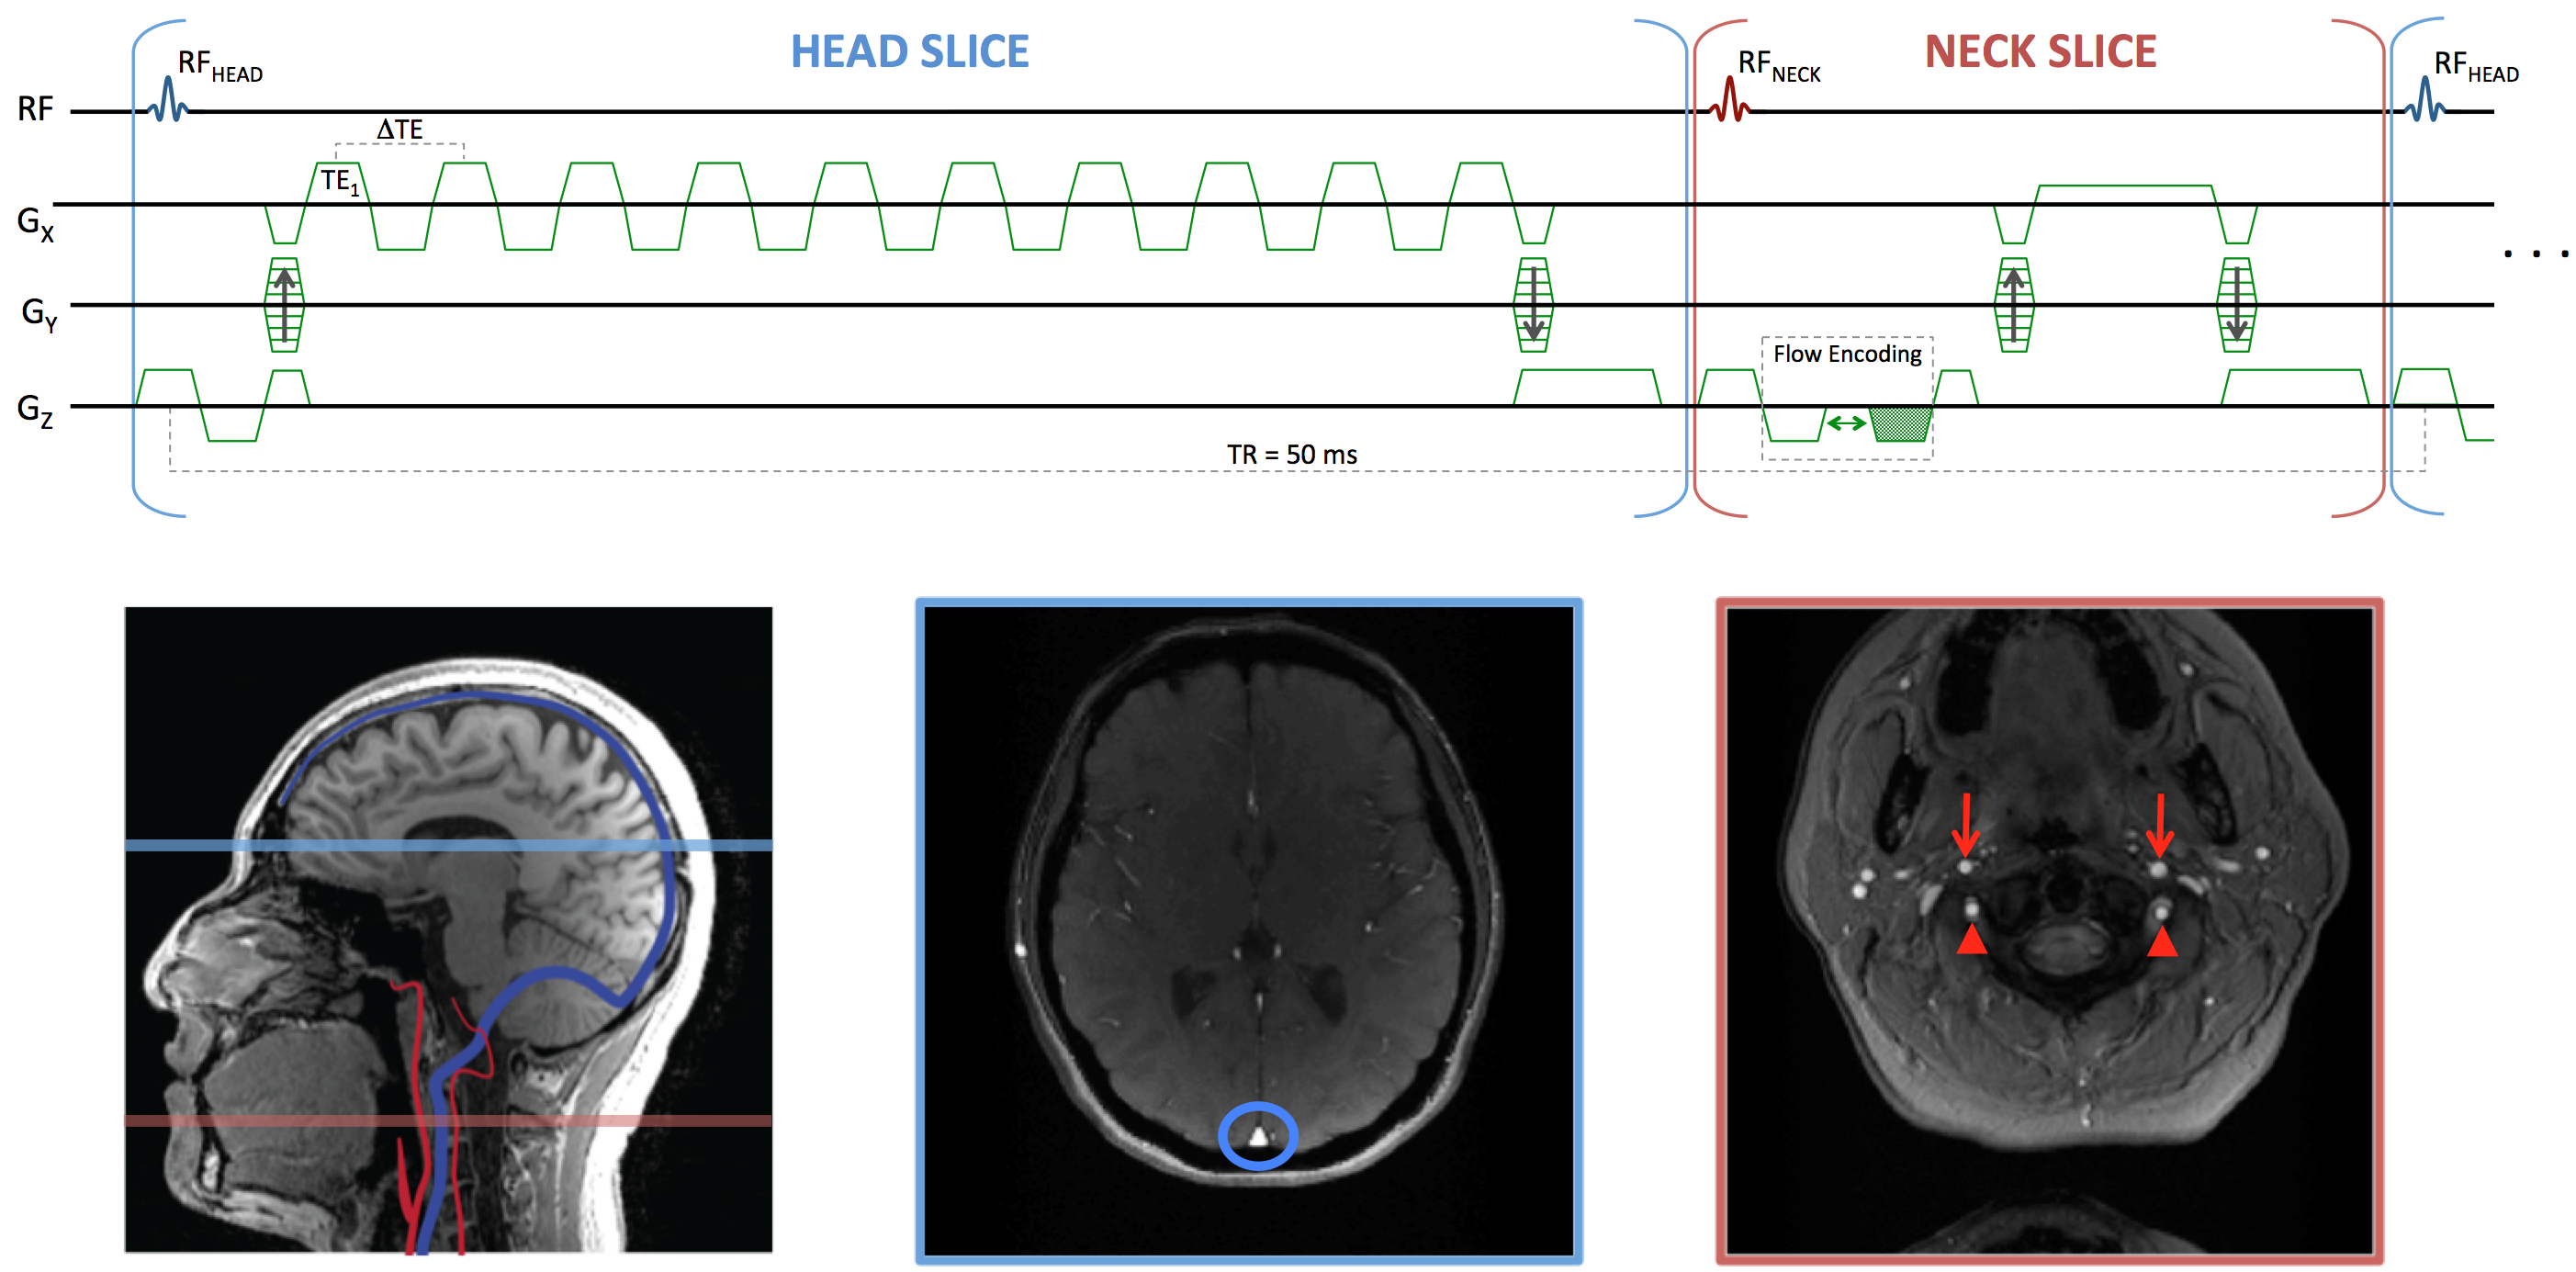
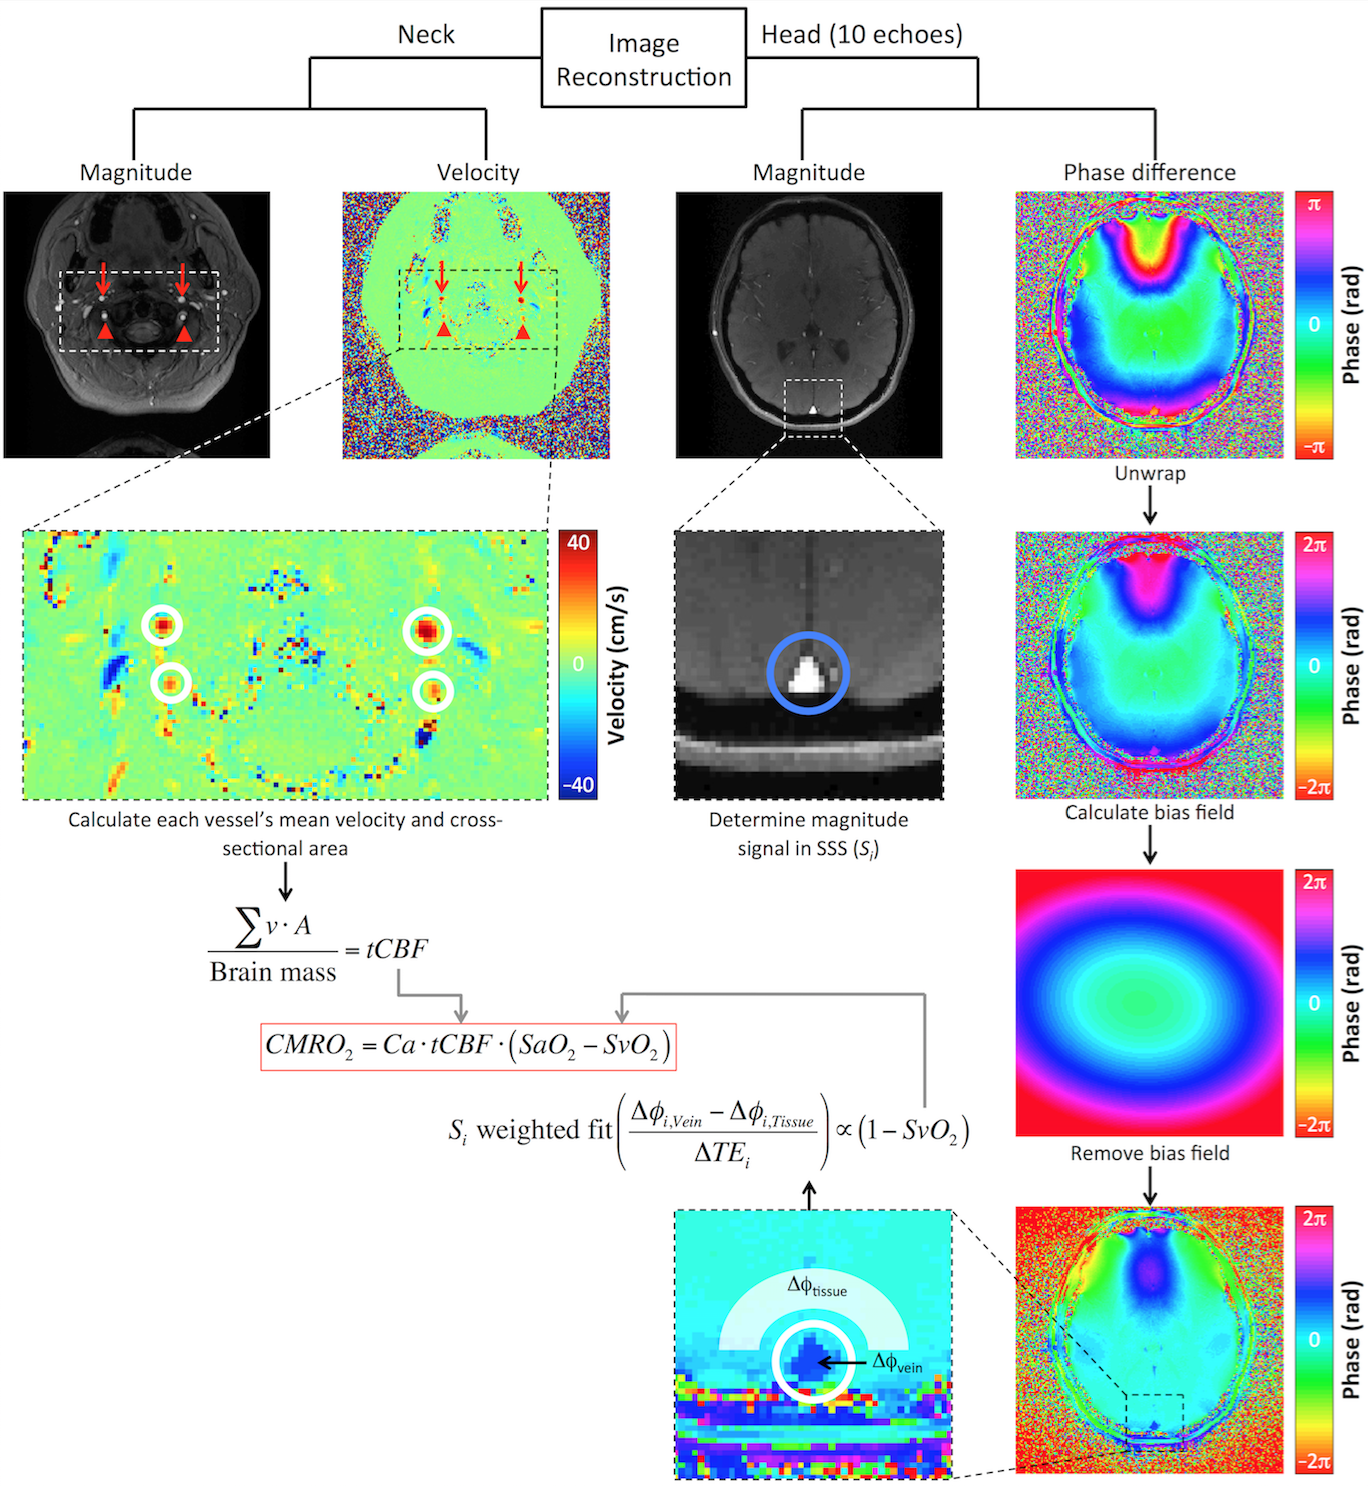
A multi-echo OxFlow sequence was developed in SequenceTree6 and exported for use at 1.5T, 3T, and 7T (Siemens Avanto, Prisma, and Terra, respectively). The pulse sequence diagram is shown in Figure 1. The interleaved dual-slice strategy allows for simultaneous quantification of tCBF and SvO2 in the neck and head slices, respectively. SvO2 is quantified by susceptometry-based oximetry as:
$$SvO_2=\left(1+\frac{\Delta\chi_{oxy}}{\Delta\chi_{do}}-\frac{2\left(\frac{\Delta\phi}{\Delta TE}\right)}{\gamma\cdot Hct\cdot\Delta\chi_{do}\cdot B_0\cdot\left(cos^2\theta-\frac{1}{3}\right)}\right)$$
where Δχdo=4π×0.273 ppm is the susceptibility difference between fully oxygenated and deoxygenated erythrocytes, Δχoxy=4π×0.008 ppm is the susceptibility difference between oxygenated erythrocytes and water, Δφ is the difference of inter-echo phase accrual between the vessel and background tissue, and θ is the SSS's angle with respect to B0. To make OxFlow flexible for use at any field strength, the inter-echo spacing was reduced, and the number of echoes was increased. The rate of phase accrual, calculated as the magnitude-weighted fit of Δφ and ΔTE, was used instead of only one inter-echo phase difference, potentially enhancing the precision of SvO2 at any field strength. Image analysis procedures are summarized in Figure 2.
Pulse sequence parameters for the neck slice (phase contrast) included: FOV=176×176 mm2, slice thickness=5 mm, matrix=208×208, flip angle=25°, TR/TE=50/7.22 ms, bandwidth=320 Hz/pixel, VENC=60 cm/s; and for the head slice (multi-echo GRE) were: FOV=208×208 mm2, slice thickness=5 mm, matrix=208×208, flip angle=25°, TR/TE1/ΔTE=50/3.6/2.83 ms, 10 echoes of equal polarity with TEmax=29.07 ms, bandwidth=960 Hz/pixel. Number of acquisitions=2, total scan time=48 s.
Five healthy subjects (age 34.8±5.9 years, 3 male) were scanned at 1.5T, 3T, and 7T. At 1.5T and 3T, body coil transmit with head and neck receive coils were used. At 7T a transmit/receive head coil was used. For each subject, all data were collected within 3.4±1.5 days at approximately the same time of day (2.6±1.0 hours apart). To compute brain mass, a T1-weighted MP-RAGE dataset was acquired at either 1.5T (n=2) or 3T (n=3). Hematocrit was assumed to be 0.4 for females and 0.45 for males. A time of flight acquisition was used to determine the angle of the SSS. Repeated measures ANOVAs were used to test for differences of the quantified measures among field strengths.
Results
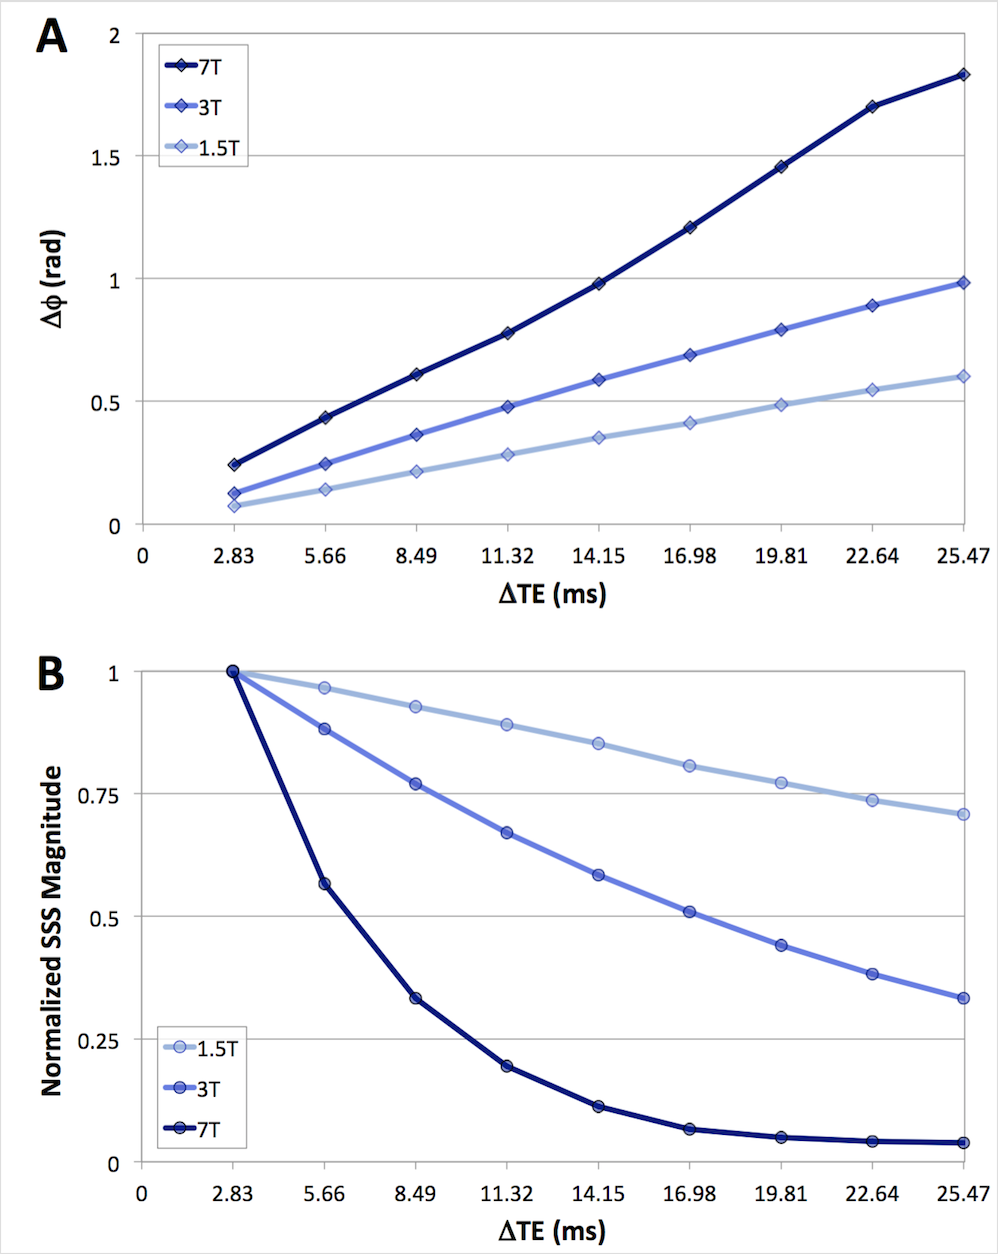
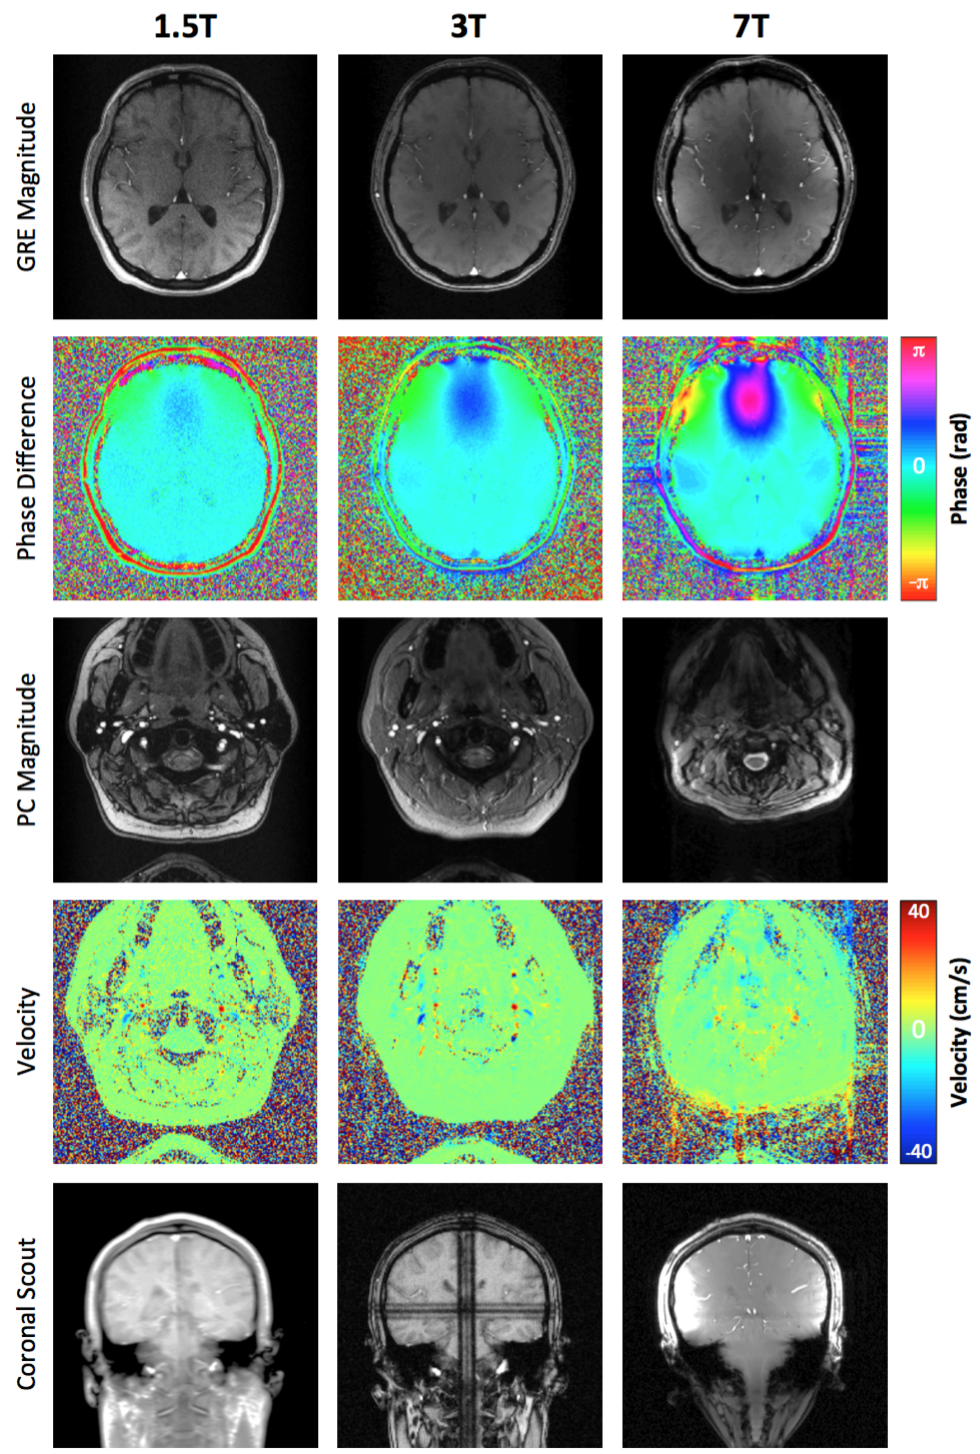
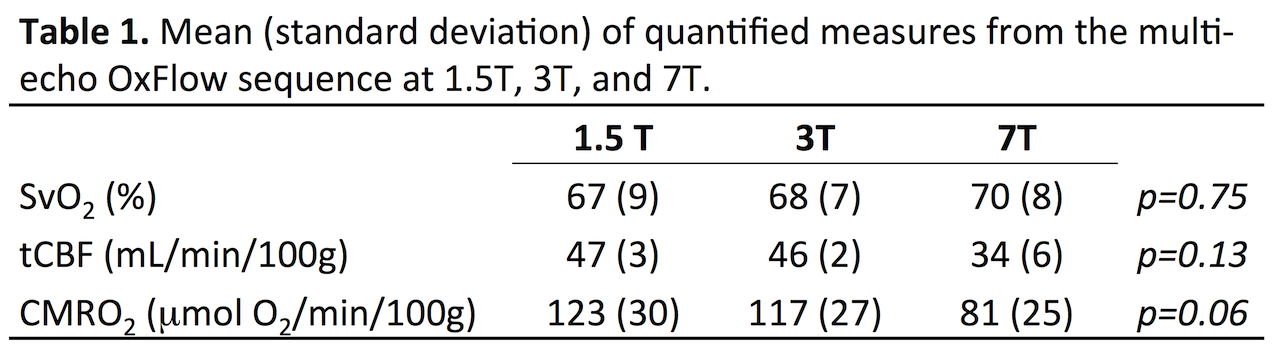
Figure 3 shows data from a representative subject at 1.5T, 3T, and 7T displaying the difference of inter-echo phase accrual between the SSS and surrounding parenchyma throughout the multi-echo GRE acquisition (A), and the normalized magnitude signal in the SSS (B) used for weighting the Δφ/ΔTE fit. Figure 4 shows example images for 1.5T, 3T, and 7T acquisitions along with a coronal scout image. Table 1 summarizes the results. tCBF and thus CMRO2 tended to be lower at 7T, however no significant differences were observed between the physiologic parameters measured at 1.5T, 3T, and 7T in this limited sample.Discussion & Conclusion
Multi-echo OxFlow provides tCBF and SSS SvO2 for fast and robust quantification of whole-brain CMRO2 at 1.5T and 3T. Although not significantly different in this limited sample size, the accuracy of tCBF measured at 7T was potentially impacted by induced magnetic field gradients or magnetic field inhomogeneity (effects can be seen in the coronal scout in Figure 4, row 5). These effects may impact both the measured phase contrast and cross-sectional area (as seen in Figure 4, rows 3-4). However, SvO2 measured at 7T was in good agreement with that at 1.5T and 3T. Overall, the use of the rate of phase accrual over many echoes instead of a single inter-echo phase difference may improve quantification of SvO2 at high field strength. Methods to better quantify tCBF at 7T are being evaluated.Acknowledgements
This work was supported by NIH Grant T32HL007954, R21EB022687, and R01HL122754.References
1. Jain V, Langham MC, Wehrli FW. MRI estimation of global brain oxygen consumption rate. J Cereb Blood Flow Metab. 2010;20:1598-1607.
2. Fernandez-Seara MA, Techawiboonwong A, Detre JA, Wehrli FW. MR susceptometry for measuring global brain oxygen extraction. Magn Reson Med. 2006;55:967-973.
3. Bryant DJ, Payne JA, Firmin DN, Longmore DB. Measurement of flow with NMR imaging using a gradient pulse and phase difference technique. J Comput Assist Tomogr 1984;8(4):588-593.
4. Jain V, Buckley EM, Licht DJ, Lynch JM, Schwab PJ, Naim MY, Lavin NA, Nicolson SC, Montenegro LM, Yodh AG and others. Cerebral oxygen metabolism in neonates with congenital heart disease quantified by MRI and optics. J Cereb Blood Flow Metab 2014;34(3):380-388.
5. Blockley NP, Jiang L, Gardener AG, Ludman CN, Francis ST, Gowland PA. Field strength dependence of R1 and R2* relaxivities of human whole blood to ProHance, Vasovist, and deoxyhemoglobin. Magn Reson Med 2008;60:1313-1320.
6. Magland JF, Li C, Langham MC, Wehrli FW. Pulse sequence programming in a dynamic visual environment: SequenceTree. Magn Reson Med 2016;75(1):257-265.
Figures