3179
$$$T_1$$$ dependency of magnetization transfer effect in human brain1Institute of Biomedical Sciences, Tokushima University Graduate School, Tokushima, Japan, 2Department of Radiology, Uji Tokushukai Hospital, Uji, Japan, 3School of Health Sciences, Tokushima University, Tokushima, Japan, 4Graduate school of Health Science, Tokushima University, Tokushima, Japan, 5Global MR Applications and Workflow, GE Healthcare Japan, Hino, Japan
Synopsis
The purpose of this study is to develop a T1 mapping method derived from the variable flip angle with an MT pulse. T1 mapping of the brain with an MT pulse was performed in five healthy subjects. The mean T1_MT values were significantly decrease than the T1 in all regions (P < 0.05). The difference of T1 and T1_MT in deep gray matter (included caudate nucleus and putamen) were more decreased than those in white matter. In conclusion, determination of T1 with MT pulse makes it possible to obtain more detailed information of the macromolecular pool and the free water pool.
Introduction
The magnetization transfer (MT) effect is cross relaxation and/or spin exchange between mobile protons, i.e., bulk water and a proton. The magnetization transfer ratio (MTR) has been used as an index to express the degree of signal attenuation by the MT effect1. MTR is calculated using the ratio of water signal intensities between an MT pulse and without. However, characterization of tissue with the MTR could not be evaluated simply because the MTR value changes due to variations in pulse sequence, imaging parameter and saturation pulse; the MTR is recognized as a semi-quantitative method. Some quantitative MT (qMT) imaging reports have been published. The measurement method of both T1 and MT derived from selective inversion recovery (SIR) sequence was developed2; only inversion times are varied while maintaining a constant delay between repetition time (TR). Consequently, T1 is calculated using mono-exponential fitting, and qMT parameters are calculated by bi-exponential fitting. Using this method, brain tumors of a rat model in vivo had significantly different T1 relaxation and MT parameters, i.e., the macromolecular pool to the free water pool ratio3. On the other hand, the pulse sequence having a multi-refocusing flip angle (FA), e.g., fast spin-echo method, tends to cause high- specific absorption rate (SAR). Now, we are focused on T1 mapping with a variable FA (VFA) derived from a gradient-echo sequence.Purpose
To assess the relationship between T1 and MT effect in the human brain, we developed a T1 mapping method derived from a VFA with MT pulse.Materials and Methods
On a 3.0 T magnetic resonance system (Discovery 750, GE Healthcare), T1 mapping of the brain with MT pulse was performed in healthy volunteers (five men; ages, 21-26 years; mean age, 23.8 years). An MR dataset was acquired with spoiled gradient-echo (SPGR) sequence with MT pulse and without (offset frequency, 800 Hz). The imaging parameters were 4.9 ms echo time, 500 ms TR, three FA (20, 40, and 80 degrees), 244.1 Hz/pixel bandwidth, 6 mm slice thickness, 192 × 256 matrix, and 25.6 cm field of view. Moreover, B1 inhomogeneity correction was applied to each dataset. B1 correction was derived from the double angle method. This method uses the MR images of two FA using a gradient echo (GRE) sequence. The dataset for B1 correction were acquired with 2000 ms TR, 5.8 ms TE, 40 degrees FA α, and 80 degrees FA 2α. The B1 correction is given by
$$B_1^{flip\,angle}=\arccos\left(\frac{S_{2\alpha}}{2S_{\alpha}}\right)$$,
where Sα and S2α are the signal intensities of α and 2α FA data, respectively. Then, calculated B1 was applied to pixel by pixel of MR imaging data. After B1 correction was performed, T1 or T1_MT were derived from VFA datasets with MT pulse and without as follows:
$$S_{SPGR}=M_{0}\sin\alpha\left(\frac{1-\exp\left(-\frac{TR}{T_{1}}\right)}{1-\exp\left(-\frac{TR}{T_{1}}\right)\cos\alpha}\right)$$
$$\therefore \left[M_{0},T_{1} \right]=arg\min_{M_{0},T_{1} }\left(\sum_{i=1}^{N_{SPGR}}\left(s_{SPGR,i}-S_{SPGR,i}\left(\alpha_{i}\right)\right)^{2}\right)$$
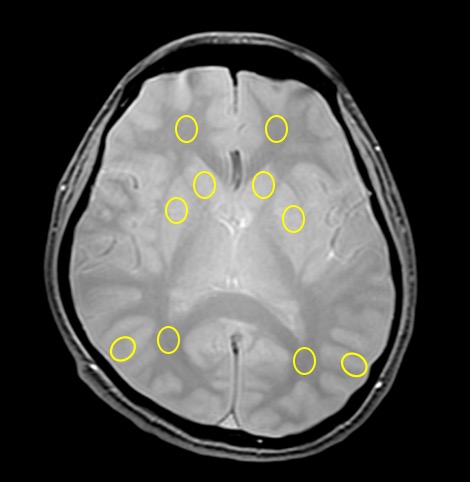
where $$$S_{SPGR,i}$$$ is the MR signal of each FA after B1 correction, $$$s_{SPGR,i}$$$ is the theoretical signal value. Then, using varying α values, a nonlinear curve fitting procedure could yield an estimation of parameters (M0 and T1 or T1_MT) according to the relationship between MR signal and TE. Then, T1, T1_MT and MTR maps were calculated from each dataset. After setting regions of interest (ROIs) on white matter, gray matter, caudate nucleus, and putamen for each subject (Fig.1), we measured the mean T1 values and its standard deviation (SD). Measurements of T1 and T1_MT were compared for each region.
Results and Discussion
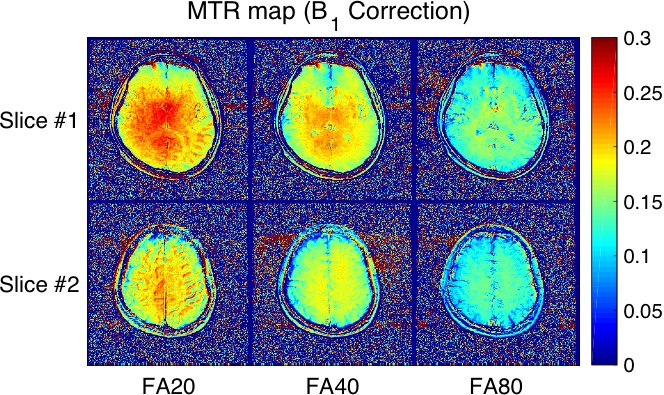
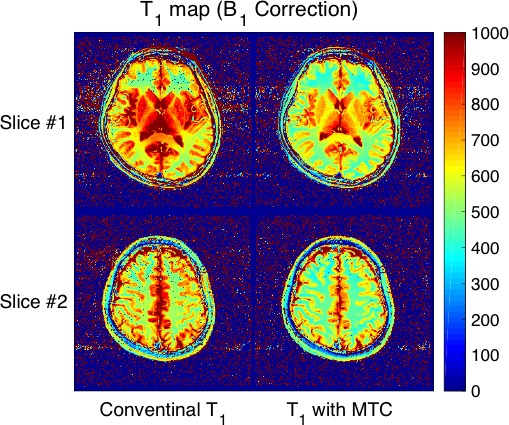
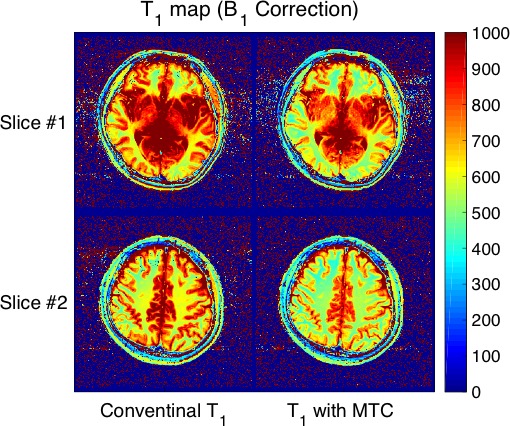
Table 1 summarizes the measurement of each T1 value in white matter, gray matter, caudate nucleus, and putamen in healthy subjects. Figure 2 shows MTR maps of each flip angle of a representative subject. Figure 3 and 4 show T1 maps derived from the VFA method with MT pulse and without for each represented subject. The mean T1_MT values were significantly decreased compared to the T1 in all regions (P < 0.05). Difference in T1 and T1_MT of deep gray matter (included caudate nucleus and putamen) shows higher than that of white matter. On the other hand, the MTR map showed the appearance of an inhomogeneous high-signal field around the center of the brain even though B1 correction was applied (white allows in Fig. 2). The MT pulse with mono-frequency may cause B1 inhomogeneity; an MTR map may need a correction method using various B1 offset frequencies. Thus, the VFA method with MT pulse enabled to us to obtain a quantitatively uniform image with a mono-frequency MT pulse.Conclusion
Determination of T1 with MT pulse makes it possible to obtain more detailed information for the macromolecular pool and the free water pool, e.g., myelin water fraction.Acknowledgements
No acknowledgement found.References
- Wolff SD, Balaban RS. Magnetization transfer contrast (MTC) and tissue water proton relaxation in vivo. Magn Reson Med. 1989;10(1):135-44.
- Li K, Zu Z, Xu J, Janve VA, Gore JC, Does MD, Gochberg DF. Optimized inversion recovery sequences for quantitative T1 and magnetization transfer imaging. Magn Reson Med. 2010;64(2):491-500.
- Xu J, Li K, Zu Z, Li X, Gochberg DF, Gore JC. Quantitative magnetization transfer imaging of rodent glioma using selective inversion recovery. NMR Biomed. 2014;27(3):253-60.
Figures