3178
Improved susceptibility-weighted imaging of the thalamic nuclei at 7T with enhanced contrast and venous vessel exclusion1Laboratory for Functional and Metabolic Imaging (LIFMET), École Polytechnique Fédérale de Lausanne, Lausanne, Switzerland, 2Medical Image Analysis Laboratory (MIAL), Center for Biomedical Imaging (CIBM), Lausanne, Switzerland, 3Department of Radiology, Centre Hospitalier Universitaire Vaudois (CHUV) and University of Lausanne (UNIL), Lausanne, Switzerland, 4Department of Clinical Neurosciences, Neurosurgery Service and Gamma Knife Center, Centre Hospitalier Universitaire Vaudois (CHUV), Lausanne, Switzerland, 5Signal Processing Laboratory, École Polytechnique Fédérale de Lausanne, Lausanne, Switzerland, 6Faculty of Biology and Medicine, University of Lausanne (UNIL), Lausanne, Switzerland, 7Donders Center for Cognitive Neuroimaging, Radboud University, Nijmegen, Netherlands, 8Department of Radiology, University of Geneva, Geneva, Switzerland
Synopsis
The thalamus plays a key role in neuronal signal transmission and modulation. While most of the current non-invasive imaging techniques fail to achieve substantial contrast between the thalamic nuclei, susceptibility-weighted imaging (SWI) has recently shown promising capabilities for their visualization at 7T, despite having been originally designed primarily for venous vessel imaging.
The aim of the present work was to optimize the SWI technique specifically for improved thalamic nuclei visualization, by jointly modifying the SWI combination and suppressing venous vessels. These modifications yielded substantially improved contrast and delineation of various thalamic nuclei, in good agreement with histological atlas information.
Introduction
The thalamus plays a fundamental role in neuronal signal transmission and modulation between subcortical areas and the cortex. Its constituting nuclei are individually specialized in different functions (e.g. visual, motor), and can be targeted by surgical interventions in certain neurological disorders. Unfortunately, current non-invasive imaging techniques cannot achieve substantial contrast between the thalamic nuclei, offering little value to their in-vivo study, or surgical planning. Recently, susceptibility-weighted imaging (SWI)1 has shown promising capabilities for thalamic nuclei visualization at ultra-high magnetic field,2 despite having been originally designed mainly for venous vessel imaging.1 The aim of the present work was to adapt and optimize the standard SWI technique specifically for improved thalamic nuclei visualization, namely by modifying the SWI phase-magnitude combination, and suppressing the confounding presence of venous vessels.Methods
Data acquisition: five healthy volunteers (72±9yo, 3male/2female) were scanned on a 7T-MRI system (Siemens) with a 32channel-receive head coil (Nova Medical). Each subject underwent an SWI acquisition (flow-compensated 3D-GRE, TR/TE=28/20ms, 0.375×0.375×1mm resolution, 2×-undersampling and 6/8-partial Fourier in the first phase-encoding direction), and a T1-weighted acquisition for registration and comparison purposes (MP2RAGE,3 TR/TI1/TI2/TE=6000/800/2700/2.05ms, 0.6mm isotropic resolution).
Data preprocessing: the raw GRE data from the SWI acquisition were exported for offline reconstruction in Matlab, allowing for more freedom in the phase data processing. The reconstruction employed the ESPIRiT approach,4 combined with block coil compression5 to obtain a virtual “body coil-like” image. This image was integrated with the ESPIRiT coil sensitivities to provide a singularity-free phase reference,6 and the final complex image was then reconstructed using SENSE.4 The phase data underwent Laplacian-based spatial unwrapping7 and background field removal using the Laplacian boundary value approach.8
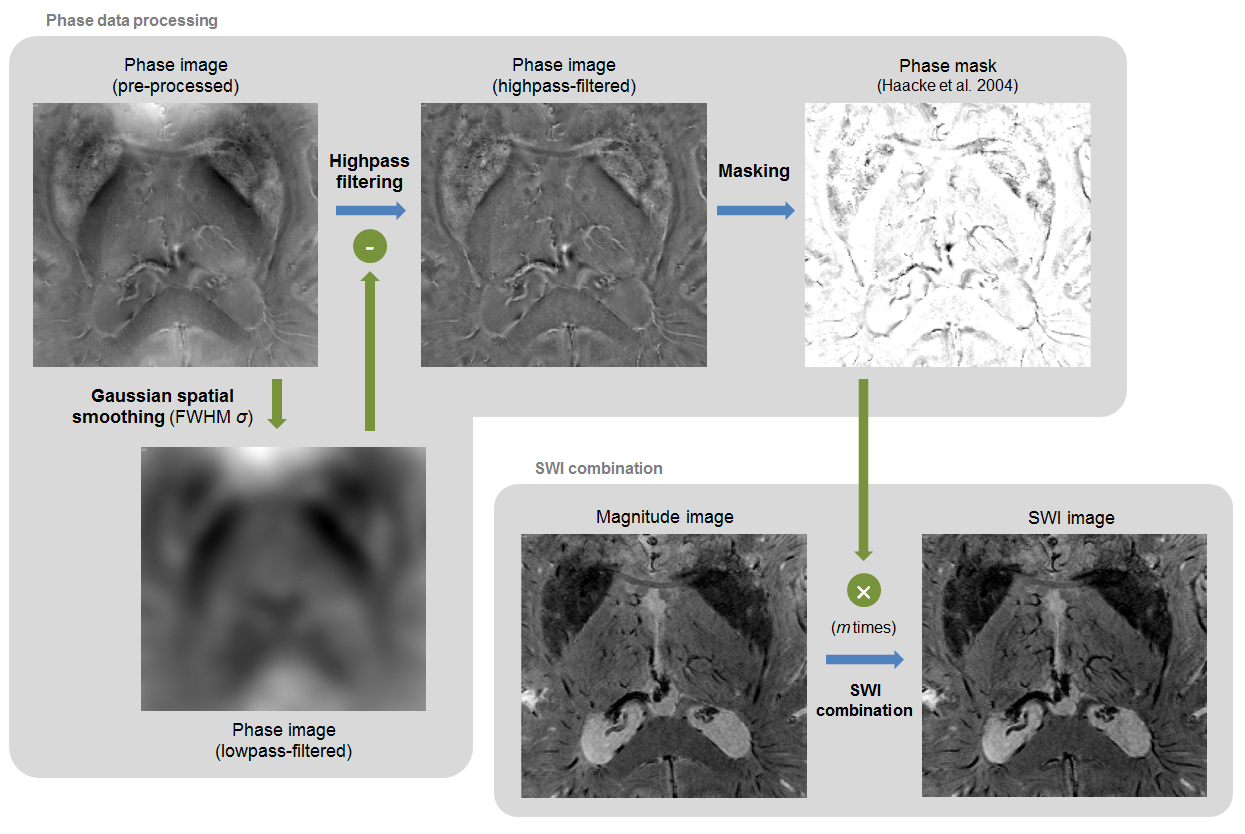
Improved SWI contrast: a series of novel SWI contrasts was obtained following the originally-proposed combination1 with two differences (Fig.1): (1) the highpass filtering of the phase image was performed by subtracting from the phase image a Gaussian-smoothed version, at a full-width-at-half-maximum (FWHM) σ, which was varied from 3 to 10mm; (2) the phase mask was multiplied into the magnitude image m times, with m varied between 0 and 15. Each combination of σ and m resulted in a different SWI image.
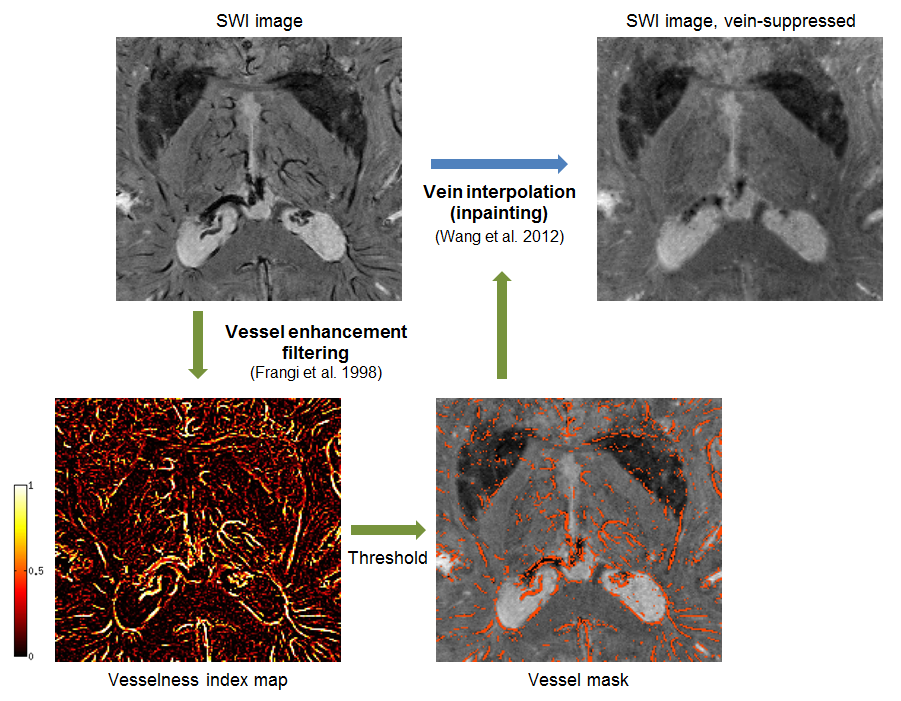
Vein suppression: veins were segmented directly on the SWI data (standard contrast) using multiscale vessel enhancement filtering9 (Fig.2). The voxels belonging to identified veins were marked as “corrupted”, and replaced by interpolation using neighboring voxel information (inpainting) with the discrete cosine transform.10 Subsequently, each different SWI contrast was affine-transformed to MNI space for comparison with the Schaltenbrand atlas.11
Results
Consistent with its original purpose,1 the standard SWI contrast provided an excellent basis for image-based vein segmentation (Fig.2). The vessel enhancement filter was found to perform best when applied in 2D, individually for each axial slice, likely due to the high anisotropy of the SWI data. Filter parameters9 β=0.5, c=3.8, covering filter scales of 0.4–1.2mm, provided optimal results.
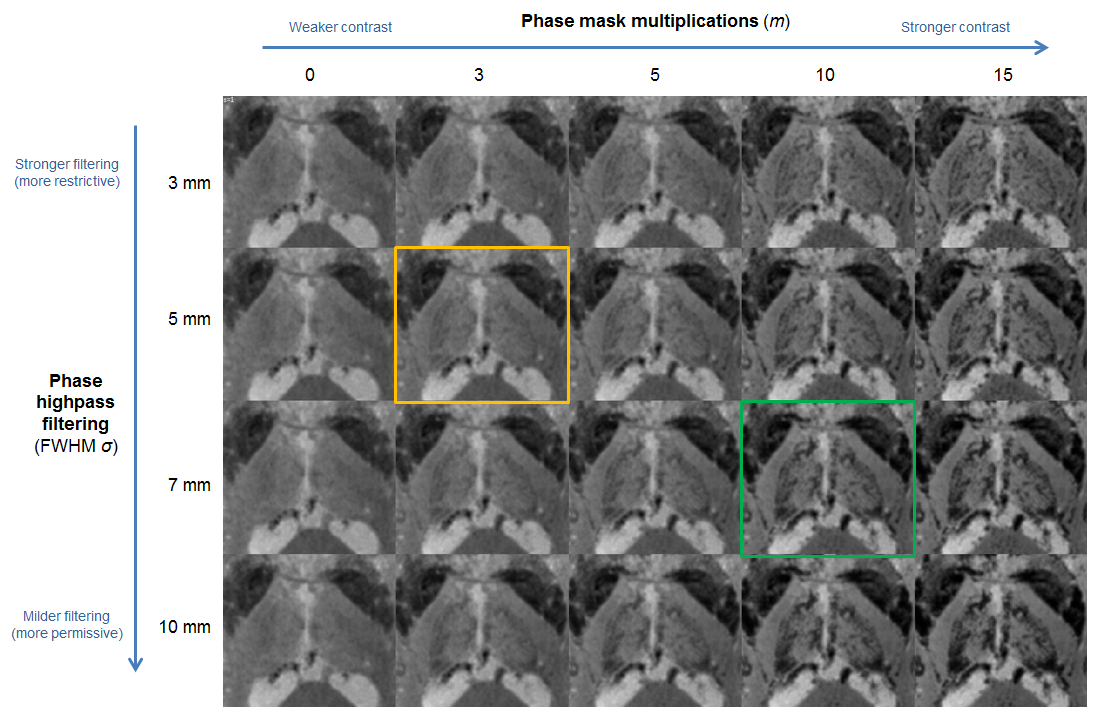
The phase highpass filtering parameter (σ) and phase multiplication factor (m) both had a substantial impact on the SWI contrast, particularly within the thalamus (Fig.3). Applying a less restrictive highpass filter (larger σ) allowed more phase information to be included in the combination, at a compromise of potentially also adding “less local” contrast, including residual background field variations. Increasing the multiplication factor invariably led to a stronger impact of the phase mask, eventually leading to signal saturation in regions like the pulvinar. An intermediate combination of σ=7mm, m=10 (Fig.3, green) was found by visual inspection to provide a favorable compromise, and was therefore selected for further analysis.
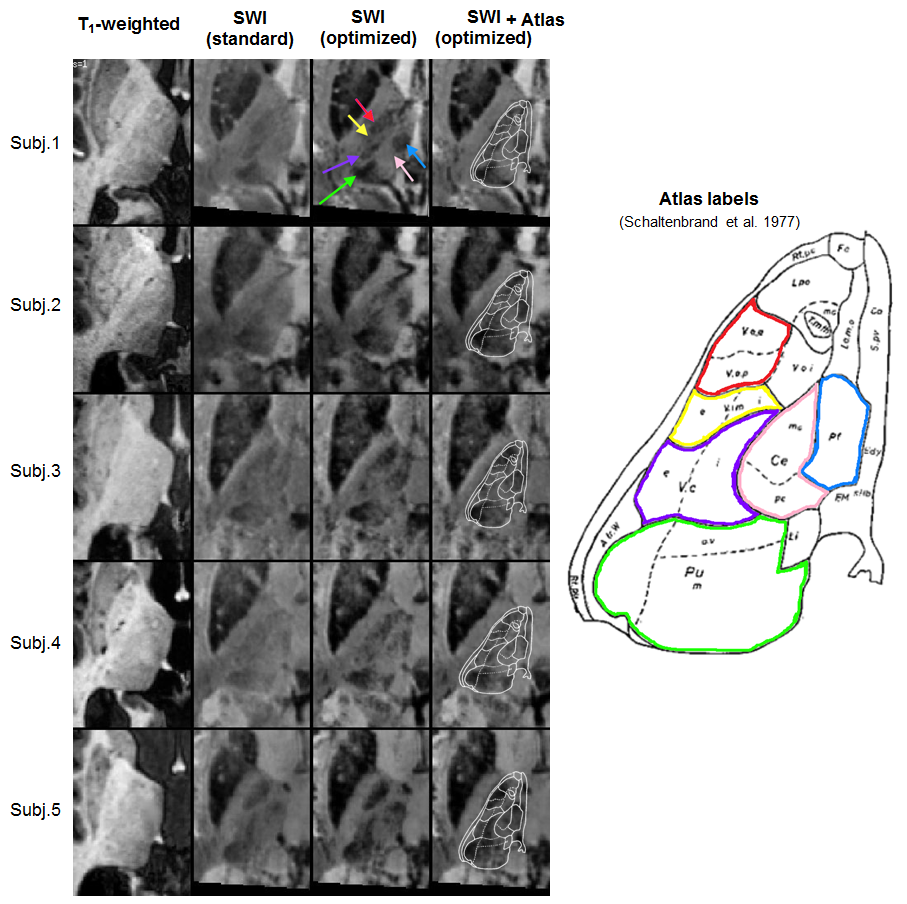
Across subjects, standard SWI tended to offer superior intra-thalamic contrast compared to T1-weighted data (Fig.4), in agreement with previous studies.2 Nevertheless, the optimized contrast (σ=7mm, m=10) consistently surpassed the standard version, with stronger variations in intensity and more clearly delineated borders for several nuclei. Based on the anatomical atlas (Fig.4, right), the hypo-intense features closely matched the pulvinar (Pu‒green label), ventro-caudalus (Vc‒purple), ventro-odalis (Vop/Voa‒red) and parafascicular (Pf‒blue) nucleus. Indirectly, these clearer hypo-intense regions also allowed more accurate delineation of other nuclei such as the centromedian (Ce‒pink), and the ventral intermediate (Vim‒yellow) nucleus, an important surgical target for treatment of tremor. Future work will extend these comparisons to alternative modalities like quantitative susceptibility mapping (QSM) and QSM-weighted imaging.12
Conclusion
The SWI contrast can be optimized for thalamic nuclei visualization in an effective and fairly straightforward approach, by modifying the SWI phase-magnitude combination and suppressing venous vessels. Together, these modifications offer substantially improved contrast and delineation of thalamic nuclei, and may bring important benefits to SWI as an imaging tool for basic neuroscience and clinical applications alike.Acknowledgements
This work was supported by Centre d'Imagerie BioMédicale (CIBM) of the UNIL, UNIGE, HUG, CHUV, EPFL and the Leenaards and Jeantet Foundations, as well as the Swiss National Foundation through Grants 205321–132821, 205321–153564, and 205321–157040.References
(1) Haacke et al., Susceptibility Weighted Imaging (SWI), Magn. Reson. Med. 2004
(2) Abosch et al., An Assessment of Current Brain Targets for Deep Brain Stimulation Surgery With Susceptibility-Weighted Imaging at 7 Tesla, Neurosurgery 2010
(3) Marques et al., MP2RAGE, a self bias-field corrected sequence for improved segmentation and T1-mapping at high field, NeuroImage 2010
(4) Uecker et al., ESPIRiT - an eigenvalue approach to autocalibrating parallel MRI: where SENSE meets GRAPPA, Magn. Reson. Med. 2014
(5) Bilgic et al., Block Coil Compression for Virtual Body Coil without Phase Singularities, Fourth Int. Workshop on MRI Phase Contrast & QSM, 2016
(6) Bilgic et al., Automated tissue phase and QSM estimation from multichannel data, Proc. Intl. Soc. Mag. Reson. Med. 24, 2016
(7) Schofield et al., Fast phase unwrapping algorithm for interferometric applications, Opt. Lett. 2003
(8) Zhou et al., Background field removal by solving the Laplacian boundary value problem, NMR in Biom 2014
(9) Frangi et al., Multiscale vessel enhancement filtering, Medical Image Computing and Computer-Assisted Intervention (Miccai) 1998
(10) Wang et al., A three-dimensional gap filling method for large geophysical datasets: Application to global satellite soil moisture observations, Environmental Modelling & Software 2012
(11) Schaltenbrand et al., Atlas For Stereotaxy of The Human Brain, Thieme 1977
(12) Gho et al., Susceptibility Map-Weighted Imaging (SMWI) for Neuroimaging, Magn. Reson. Med. 2014
Figures