3175
Feasibility and Evaluation of Multi-Delay Quantitative 3D GRASE pCASL MRI in Children at 3 Tesla1Radiology, Nationwide Children's Hospital, Columbus, OH, United States, 2Translational MRI, LLC, Los Angeles, CA, United States, 3Stevens Neuroimaging and Informatics Institute, Laboratory of FMRI Technology, University of Southern California, Los Angeles, CA, United States
Synopsis
Single post-labeling-delay (PLD) pCASL are commonly used to measure cerebral blood flow (CBF). A PLD of 1500-2000ms is commonly used in children and adults. Multi-delay pCASL has been developed as an alternative approach to better account for prolonged arterial transit times (ATT) and to improve the accuracy of CBF perfusion quantification. In this study, we evaluate the feasibility of multi-delay pCASL in children. We compare two algorithms (weighted-delay linear mapping vs. nonlinear iterative curve fitting) for estimating ATT and CBF. We further compare estimations of weighted-delay CBF derived from multi-delay pCASL data with those traditionally calculated from a single PLD measurement.
INTRODUCTION
Single post-labeling-delay (PLD) pCASL MRI with background-suppressed 3D acquisitions are commonly used for clinical measurements of cerebral blood flow (CBF) [1]. A PLD of 1500-2000ms is typically used. Recently, multi-delay pCASL with several PLDs has been developed to account for prolonged arterial transit times (ATTs) to improve CBF quantification accuracy in stroke and cerebrovascular disorders [3-5]. Usage of multi-delay pCASL is increasing [6-9]. However, multi-delay pCASL data in pediatric patients remain limited, where ATT and CBF can vary significantly with age. In this pilot study, we evaluate multi-delay pCASL in a small group of newborns and adolescents. We compare two algorithms (a "weighted-delay" (WD) linear mapping method versus conventional nonlinear curve-fitting) for estimating ATT and CBF. We additionally assess intra-subject estimations of CBF derived from multi-delay pCASL data using a "weighted-delay" PLD with those traditionally calculated from a single PLD measurement.METHODS
Studies were performed on a 3T Siemens PRISMA using 20- and 64-ch head coil arrays. We evaluated multi-delay pCASL in 11 (7F, 4M) patients (age: 7.8y, range: 1wk-17.9y) who underwent routine brain MRI exams for clinically indicated reasons. Parameters for the multi-delay pCASL 3D GRASE sequence were: 5 PLDs with 500ms intervals starting at 300-500ms, 2.5mm in-plane resolution, 3-4mm axial slices, TR/TE = 4100/36ms, tagging label duration 1500ms, bandwidth/pixel 2480Hz, labeling distance of 75-90mm above carotid bifurcation. Typical scan time for whole-brain coverage was 5-6min with 2-3 averages for each PLD. Post-processing was performed offline using a Java-based program (Translational MRI, LLC [10]). Images were corrected for motion and physiological noise using principal component analysis. Pairwise subtraction between label and control images was performed followed by averaging to generate the mean difference (ΔM) image for each PLD. Two algorithms were subsequently employed for quantitative estimation of ATT and CBF. The first was an approach where a WD was computed as [ΣPLD(k)ΔM(k)]/ΣΔM(k) for k=1:total number of PLDs (i.e., 5). A WD-based CBF was then computed along with an extrapolation of ATT. Further details available in Ref. 3-5. The second method was a traditional nonlinear iterative least-squares curve fitting approach based on a single-compartment perfusion model [1]. These two algorithms are heretofore referred to as “weighted-delay” and “curve-fitting”. For each subject, we computed linear correlation coefficients between ATT and CBF estimated from weighted-delay and curve-fitting approaches. We also computed linear correlation coefficients between a weighted-delay mean CBF derived from all PLD measurements versus individual CBFs calculated using only data from a single measured PLD. Statistical analyses were performed.RESULTS
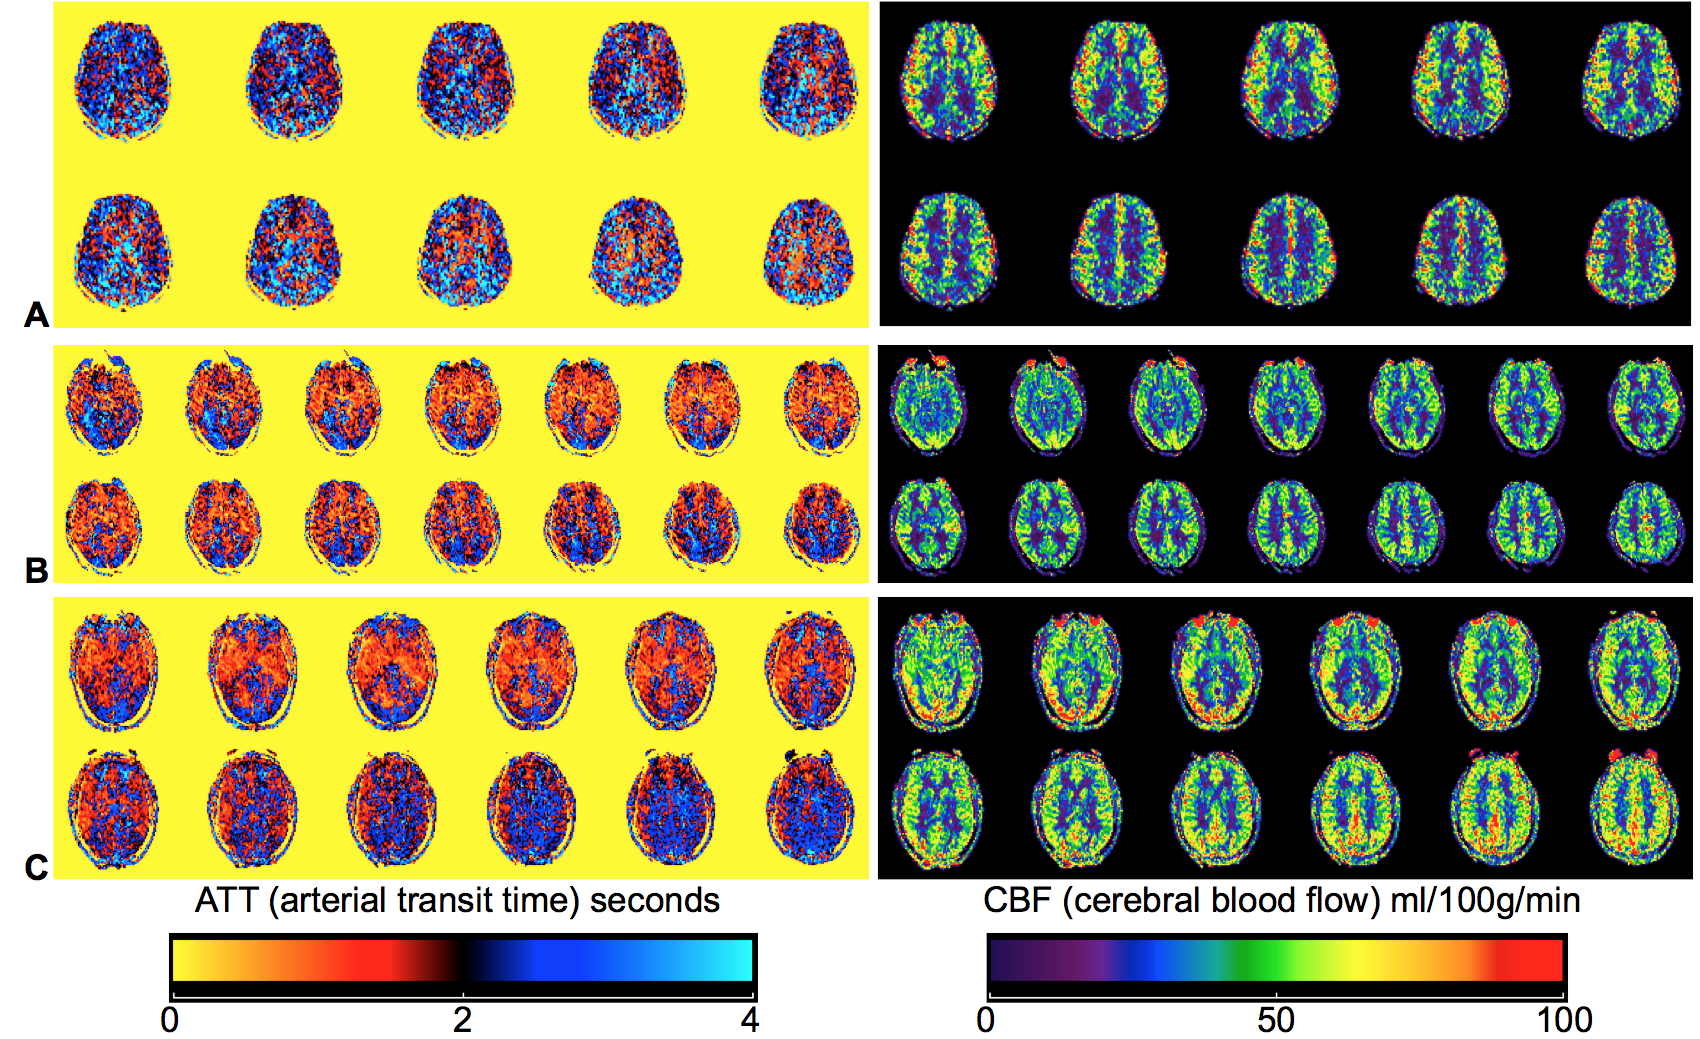
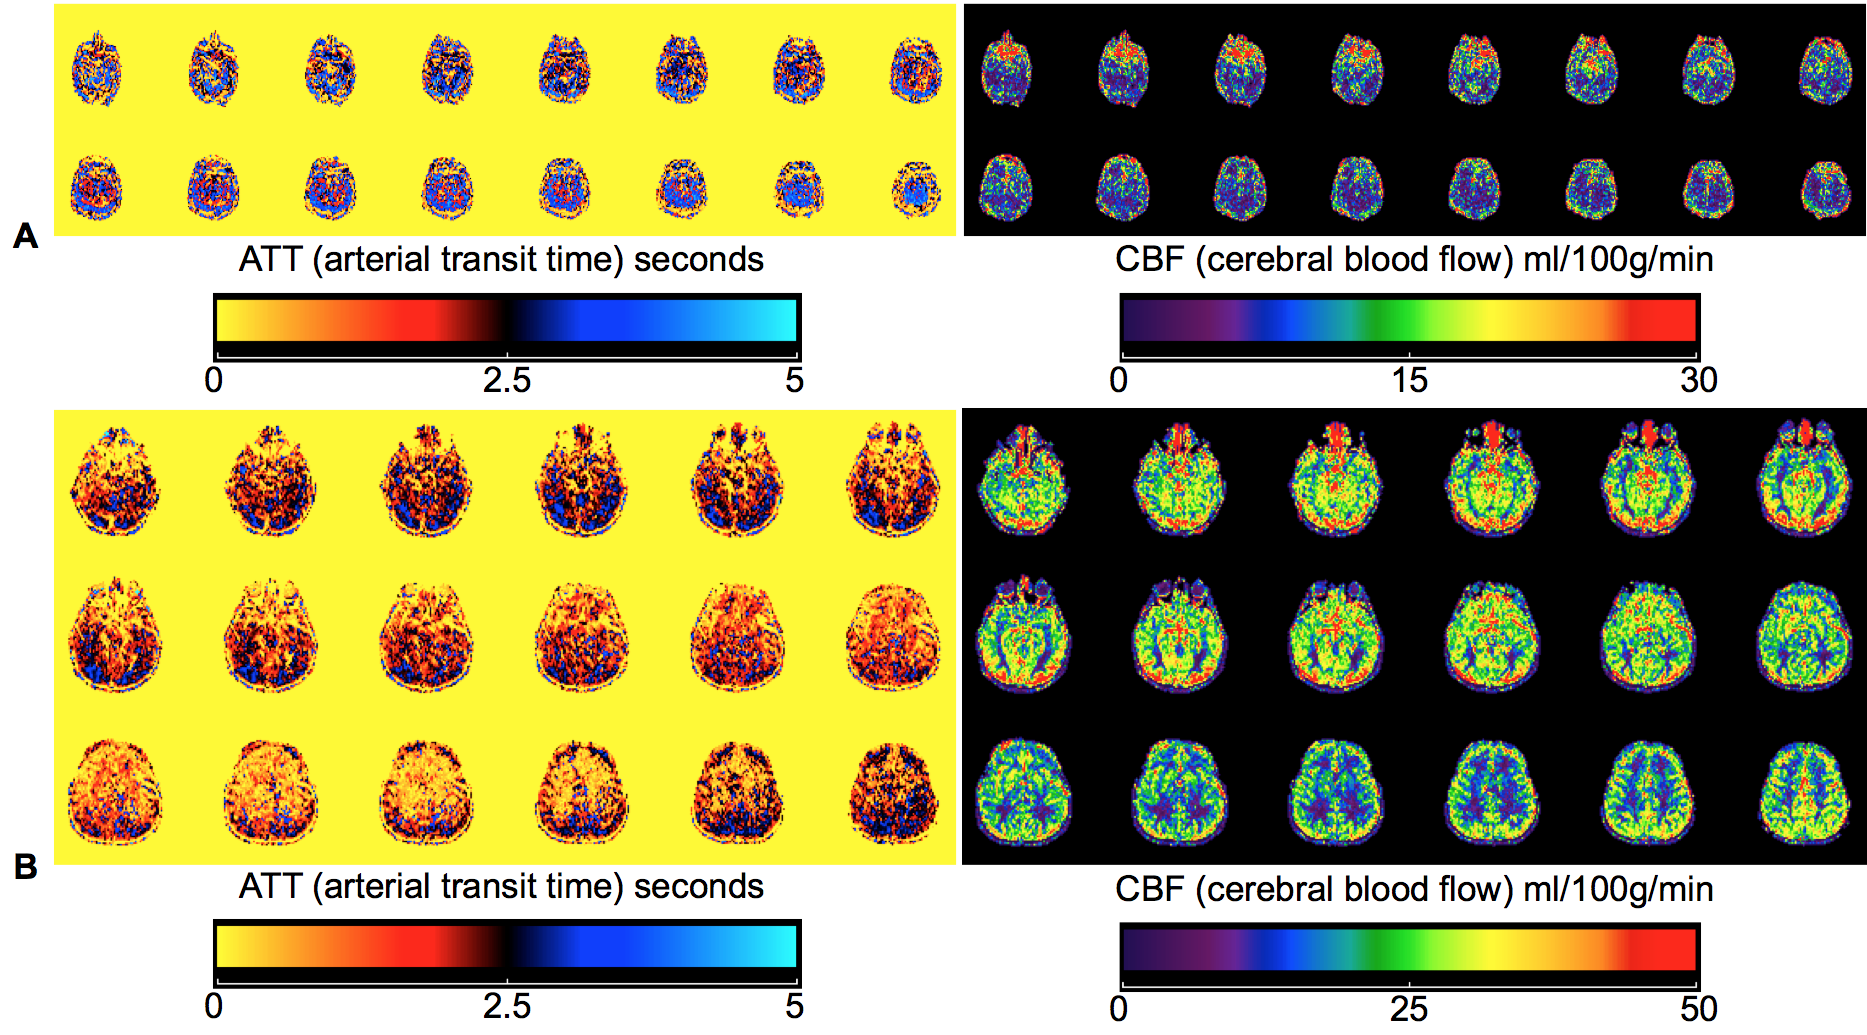
Typical calculation times for ATT and CBF for weighted-delay and curve fitting algorithms were 6s and 9s, respectively. Figures 1 and 2 show ATT and CBF parameter maps in several
patients. Note variability in both parameters with age, namely a trend towards shorter ATT and greater CBF with age. Figure 3
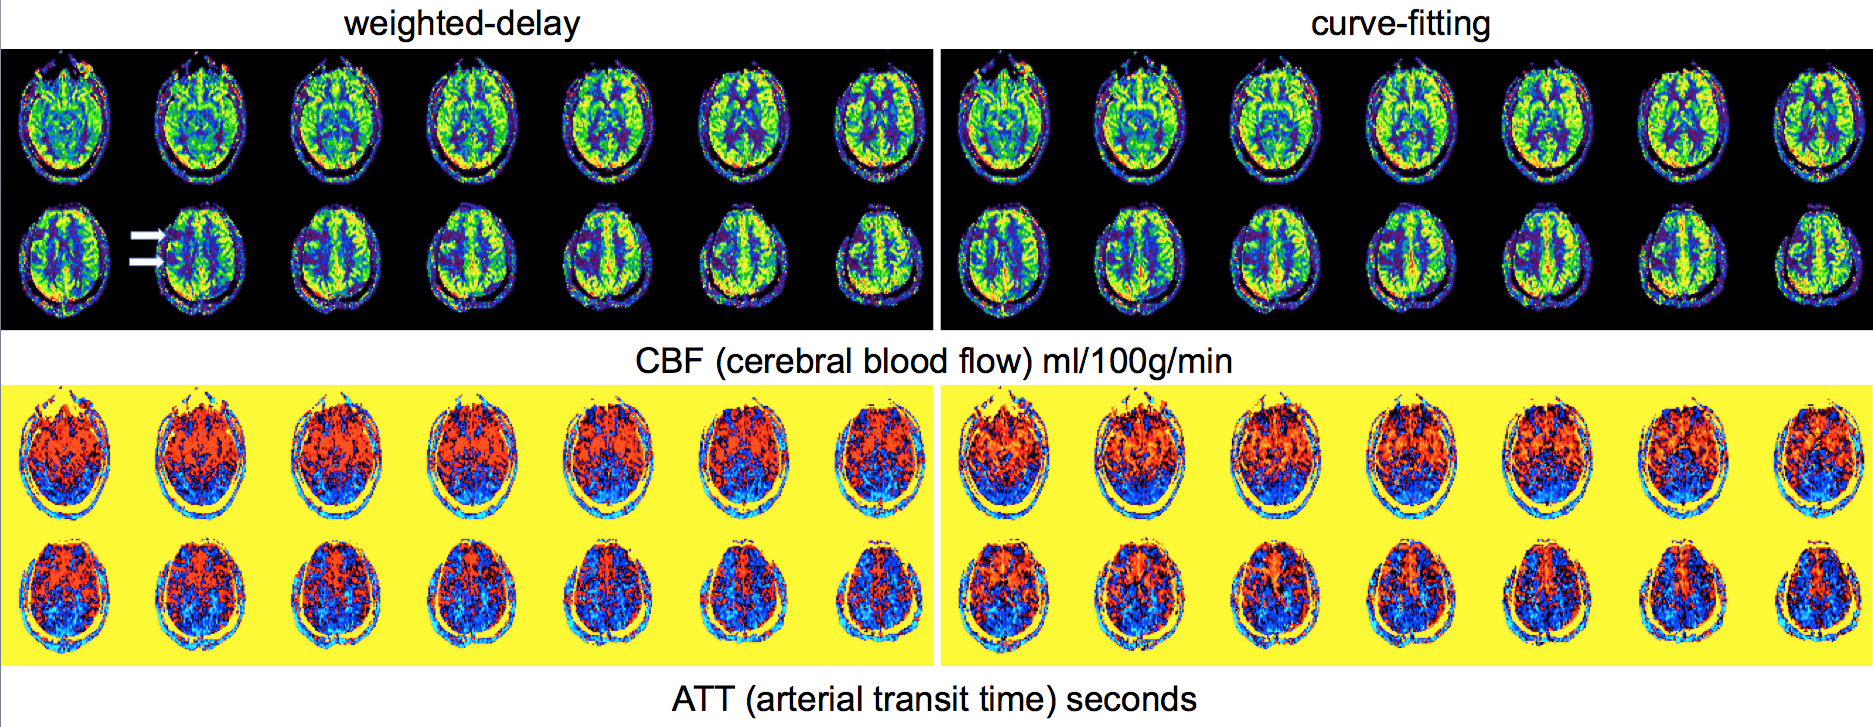
illustrates ATT and CBF maps in a patient with perfusion deficits and compares
results between weighted-delay and curve-fitting algorithms. Figure 4
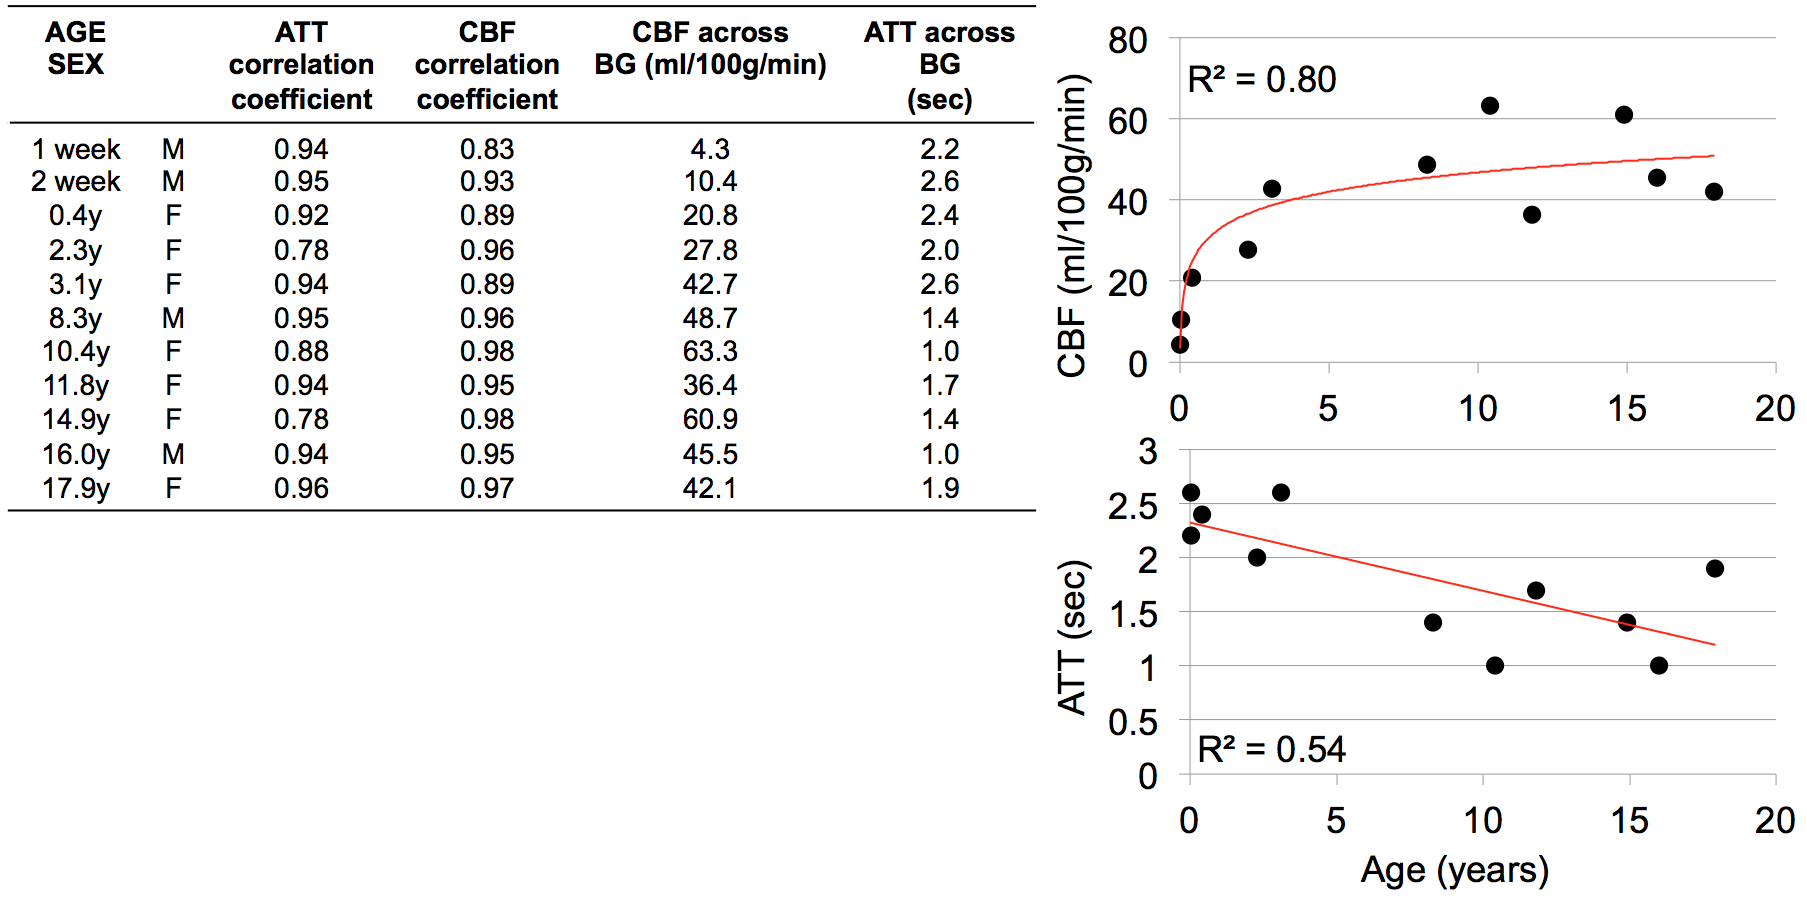
summarizes linear correlation coefficients between these two
algorithms for estimated ATT and CBF values. A majority of the coefficients
are high (i.e., r>0.9), although they are noticeably lower in
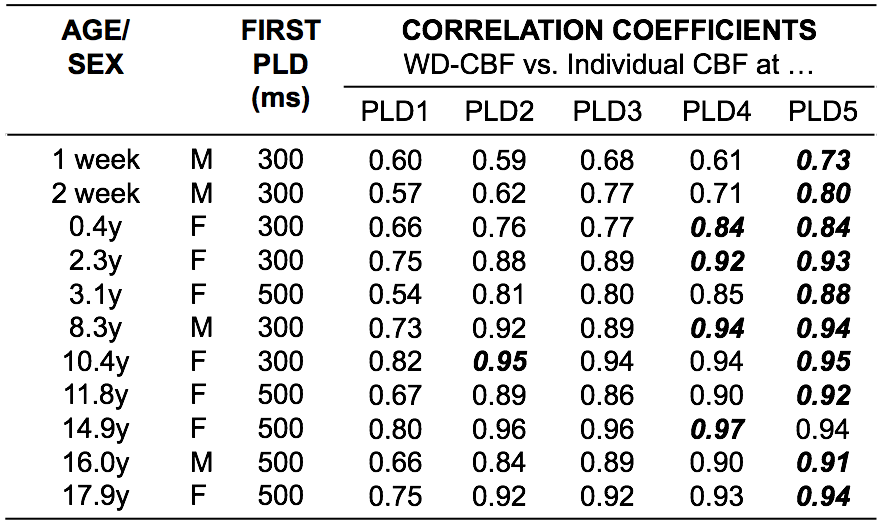
neonates and young children. All were statistically significant (p<0.01). Figure 5 summarizes correlation
coefficients between a weighted-delay mean CBF using all PLD data versus individual CBFs calculated at each of the five PLDs. The weighted-delay CBF showed the highest correlations with CBF derived from single-delay
calculations for PLDs>1500ms.
DISCUSSION and CONCLUSION
Using a multi-delay 3D pCASL GRASE sequence, we have demonstrated in this pilot work that there are ATT and CBF variations between newborns and adolescents, suggesting the need to incorporate ATT in the quantification of CBF in pediatric patients. The highest correlation between WD-derived CBF and single-delay CBF occurred for PLDs>1500ms. This is logical since we often observe high ASL signal in the cerebral arterial vasculature, and not gray matter tissue, in CBF maps derived from PLDs<1500ms. We also observed a significant correlation between ATT and CBF calculated using weighted-delay and curve-fitting algorithms, suggesting that linear and nonlinear methods converge for multi-delay ASL data and that linear computations, which are slightly faster, are accurate and adequate for clinical use. Some limitations of this study include a small sample size and that the calculation did not include age- and gender- specific T1 values for blood and labeling efficiency. These effects will be assessed as additional patient data are collected. In conclusion, the data provides preliminary evidence suggesting that multi-delay 3D pCASL methods can be applied reliably in pediatric patients and provide multi-parametric perfusion measurements that may be useful in assessing neurological, vascular, and developmental disorders.Acknowledgements
Nationwide Children's Hospital acknowledges support from Siemens Healthcare, in particular Christianne Leidecker, Christian Eusemann, Ning Jing, Christopher Boyea, and Stuart Schmeets.References
[1] Alsop DC, Detre JA, Golay X, et al. Magn Reson Med. 2015 Jan;73(1):102-116. PMID 24715426.
[2] Jain V, Duda J, Avants B, et al. Radiology. 2012 May;263(2):527-536. PMID: 22517961.
[3] Wang DJ, Alger JR, Qiao JX, et al. Neuroimage Clin. 2013 Jul;3:1-7. PMID 24159561.
[4] Wang R, Yu S, Alger JR, et al. Eur Radiol. 2014 May; 24(5):1135-1144. PMID: 24557051.
[5] Dai W, Robson PM, Shankaranarayanan A, Alsop DC. Magn Reson Med. 2012 May;67(5):1252-1265. PMID: 22084006.
[6] Lou X, Yu S, Scalzo F, Starkman S, et al. Oncotarget. 2017 Jan;8(2):2437-2443. PMID: 27974692.
[7] Chen G, Lei D, Ren J, et al. Sci Rep. 2016 Jul;6:28867. PMID: 27374369.
[8] Sugimori H, Fujima N, Suzuki Y, et al. Magn Reson Imaging. 2015; 33(10):1338-1344. PMID: 26260545.
[9] Martin SZ, Madai VI, von Samson-Himmelstjerna FC, et al. J Cereb Blood Flow Metab. 2015; 35(3):392-401. PMID: 2540727.
[10] http://transmri.com/
Figures