3174
Systematic comparison of DTI metrics as potential biomarkers in cerebral small vessel disease1Department of Bioengineering, ISR-Lisboa/LARSyS, Instituto Superior Técnico - Universidade de Lisboa, Lisboa, Portugal, 2Department of Neurology, Hospital Egas Moniz, Lisbon, Portugal, 3Imaging Department, Hospital da Luz, Lisbon, Portugal
Synopsis
Cerebral small vessel disease (SVD) is the major cause of dementia among the elderly and sensitive biomarkers of disease progression are needed. Here, we investigated the potential of DWI to provide sensitive biomarkers of SVD, by evaluation multiple metrics extracted from DTI in terms of their predictive power of cognitive performance. We considered different white matter regions of interest to perform histogram analysis and extract multiple FA and MD metrics, and showed that specific DTI metrics were better than conventional structural MRI at explaining impairments in processing speed and execute function in a group of SVD patients.
Introduction
Cerebral small vessel disease (SVD) describes the pathological processes affecting the small vessels and is considered the major cause of dementia among the elderly1. Biomarkers for SVD based on conventional structural imaging have been extensively studied but they are poorly correlated with cognitive performance2. Here, we aimed to investigate the potential of DWI to provide sensitive biomarkers of SVD, by performing a systematic evaluation of multiple metrics extracted from DTI in terms of their predictive power of cognitive performance.Methods
The sample comprised 6 patients with a genetic form of SVD (CADSIL) (47 ± 11 yrs) and 11 patients with sporadic SVD (sSVD) (56 ± 1 yrs). All patients were subjected to a comprehensive battery of neuropsychological tests to evaluate their cognitive function, including3: Trail making part A test (TMTA) to evaluate Processing Speed; Stroop Task to evaluate executive function; Wechsler Adult Intelligence Scale (WAIS-III) to evaluate attention and working memory; and Rey-Osterrieth complex figure memory sub-test to evaluate learning and long-term memory.
Whole-brain images were acquired on a 3T Siemens Verio scanner including: T1-weigthed MPRAGE with 1mm isotropic resolution; T2-weighted FLAIR with 0.7x0.7x3.3mm3 resolution; (3) DWI-EPI TR=4.8s, TE=107ms, 25 contiguous slices, 1.7x1.7x5.2mm3 resolution, 3 repetitions of diffusion-sensitizing gradients along 20 directions with b=1000s/mm2 and one b=0s/mm2 image. Normalized brain volume (nBV) was estimated using FSL’s SIENAX4 from MPRAGE images to measure brain atrophy. Brain tissue was segmented with FSL’s FAST5 to obtain a white matter (WM) mask. Co-registration to MNI space was achieved through a non-linear transformation determined using ANTs6. WM hyperintensity (WMH) lesions were manually segmented on FLAIR images and normalized WMH lesion load (nWMHLL) was estimated. A normal-appearing WM (NAWM) mask was also obtained. Both masks were transformed to MNI space, by first applying the transformation resulting from the linear registration between the FLAIR and MPRAGE images using FSL’s FLIRT, and then applying the previously derived transformation from MPRAGE to MNI space. DWI images were corrected for eddy current distortions and motion with FSL’s eddy7. To obtain the FA and MD maps, tensor fitting was performed using FSL’s dtifit. Co-registration of both maps to an FA template was performed using a nonlinear transformation (ANTs). A 0.2 FA threshold was applied to reduce variability between subjects and obtain a mean FA skeleton to be used as a mask in subsequent analysis using TBSS.
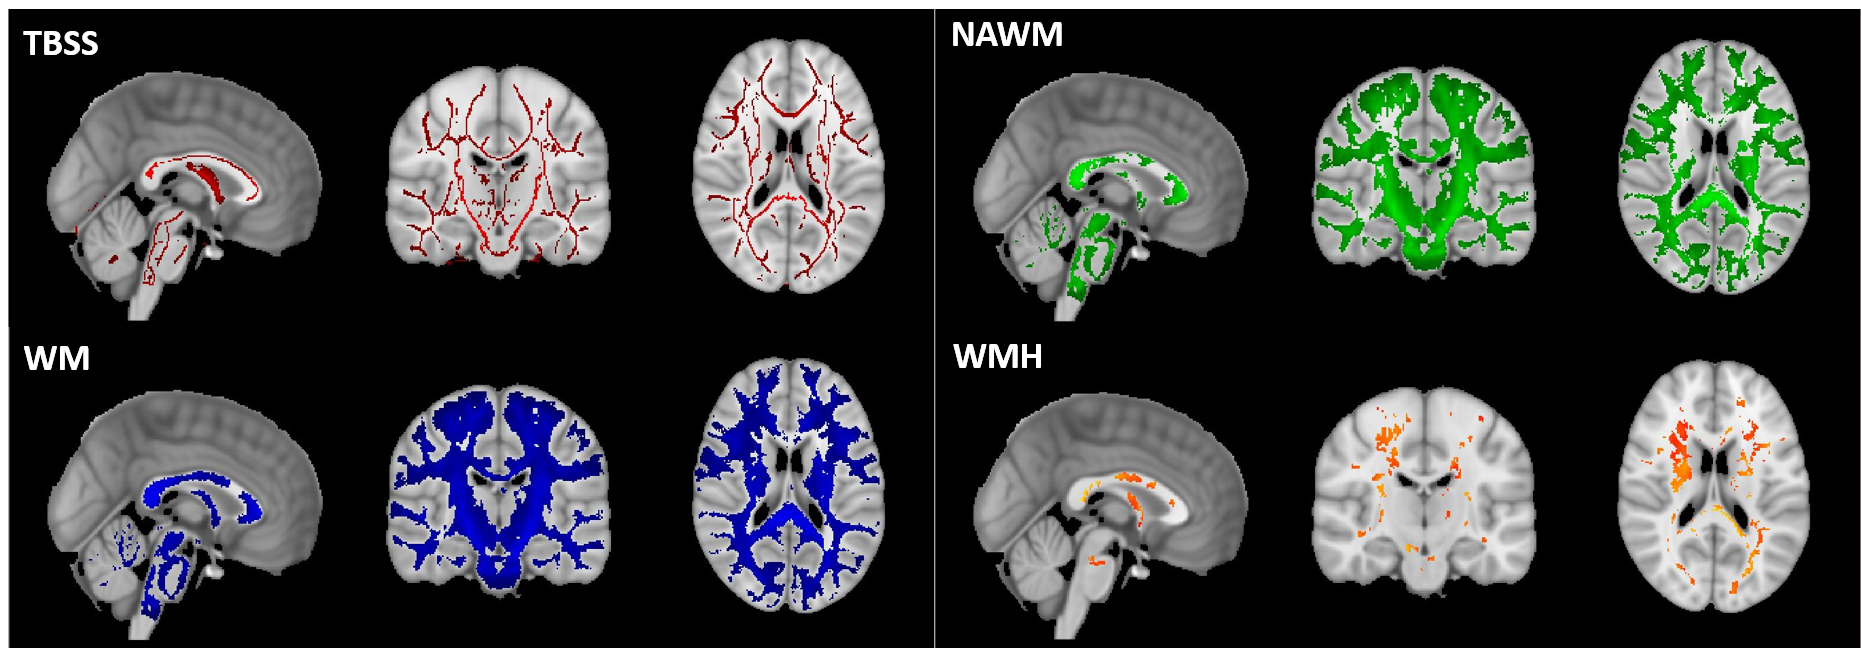
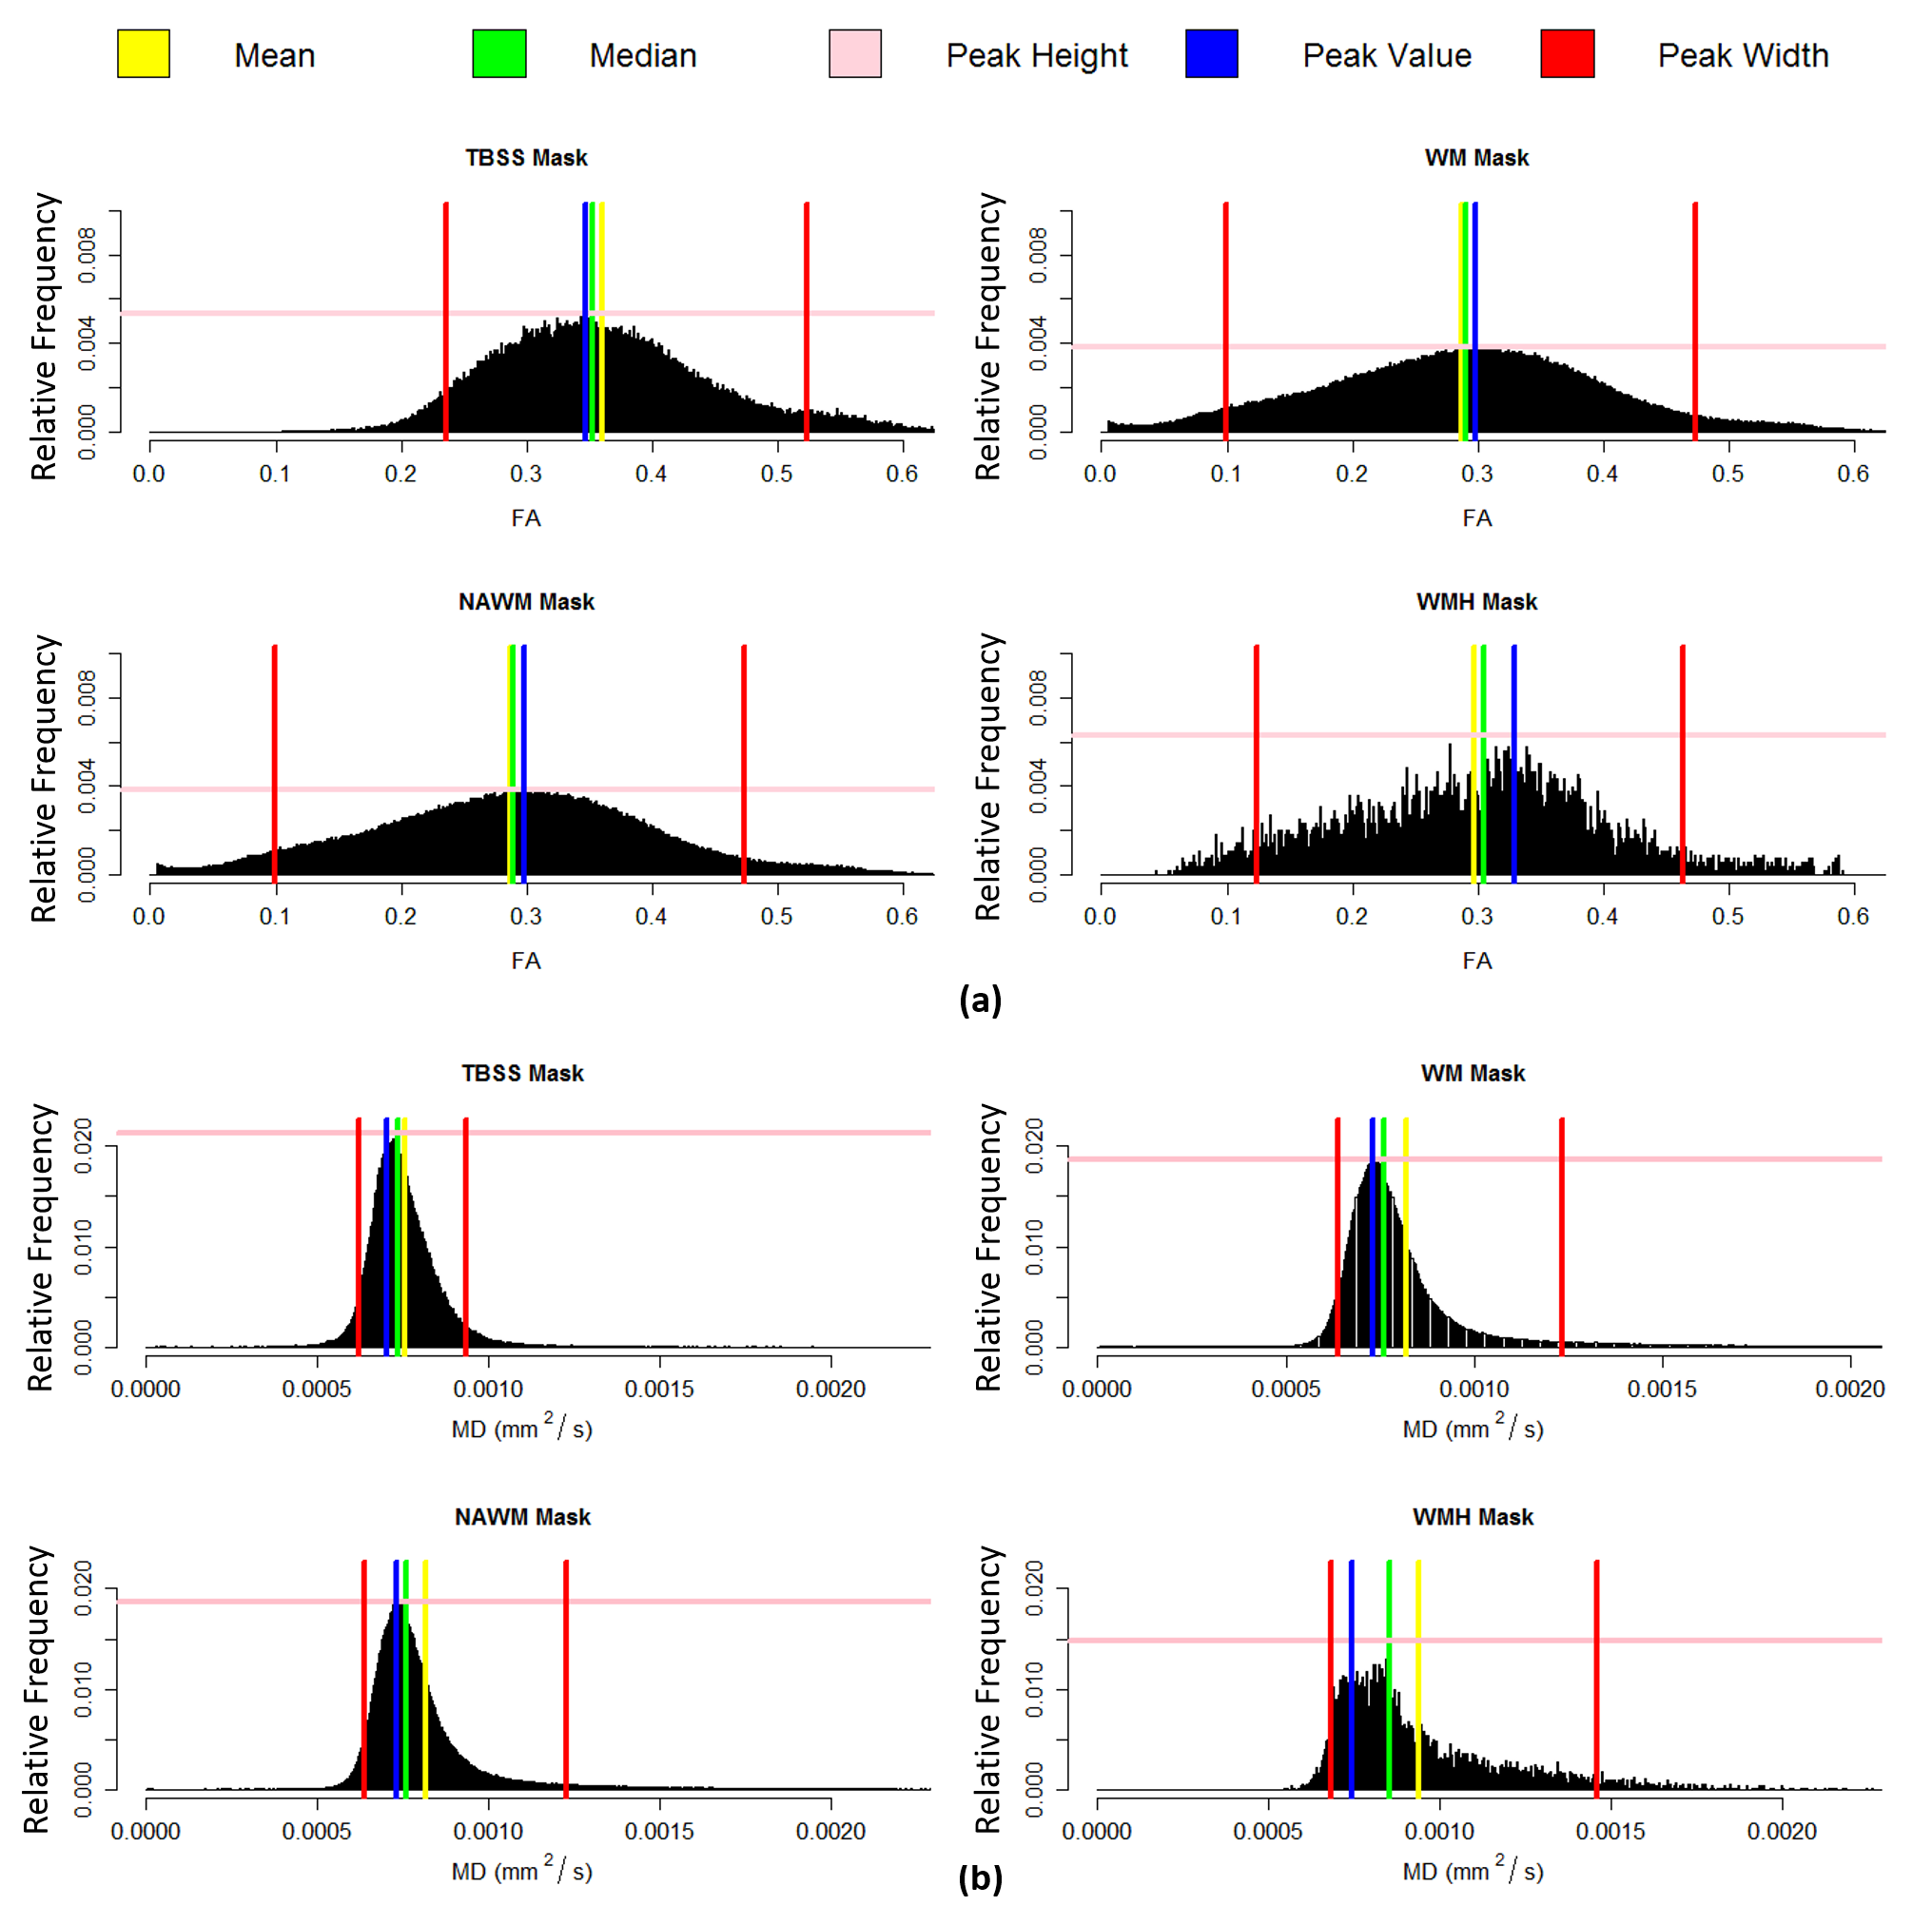
Histogram analysis of both FA and MD maps was performed in R (https://www.r-project.org/). Four masks (Fig.1) were considered as regions-of-interest: TBSS; WM, NAWM and WMH. Normalized histograms with 1000 bins were computed6 (FA - range: 0-1, bin width: 0.001; MD - range: 0-0.004 mm2/s, bin width: 0.004x10⁻³ mm2/s) and the following metrics were then extracted: median, peak height and peak width between the 5th and 95th percentiles (Fig.2).
A 1-way ANOVA was conducted to investigate the main effect of the mask using Bonferroni correction for multiple comparisons. Multiple linear regression models were then estimated including as covariates the DTI metrics of interest, as well as the structural metrics nBV and nWMHLL, and also age. A stepwise model8 approach was employed to select the sub-group of covariates that best explained the outcome of the neuropsychological tests. All metrics were first transformed to z-scores and tested for normality (Shapiro-Wilk test). Metrics found not to be normally distributed were log transformed (nBV, TMTA and Peak width MD - TBSS).
Results
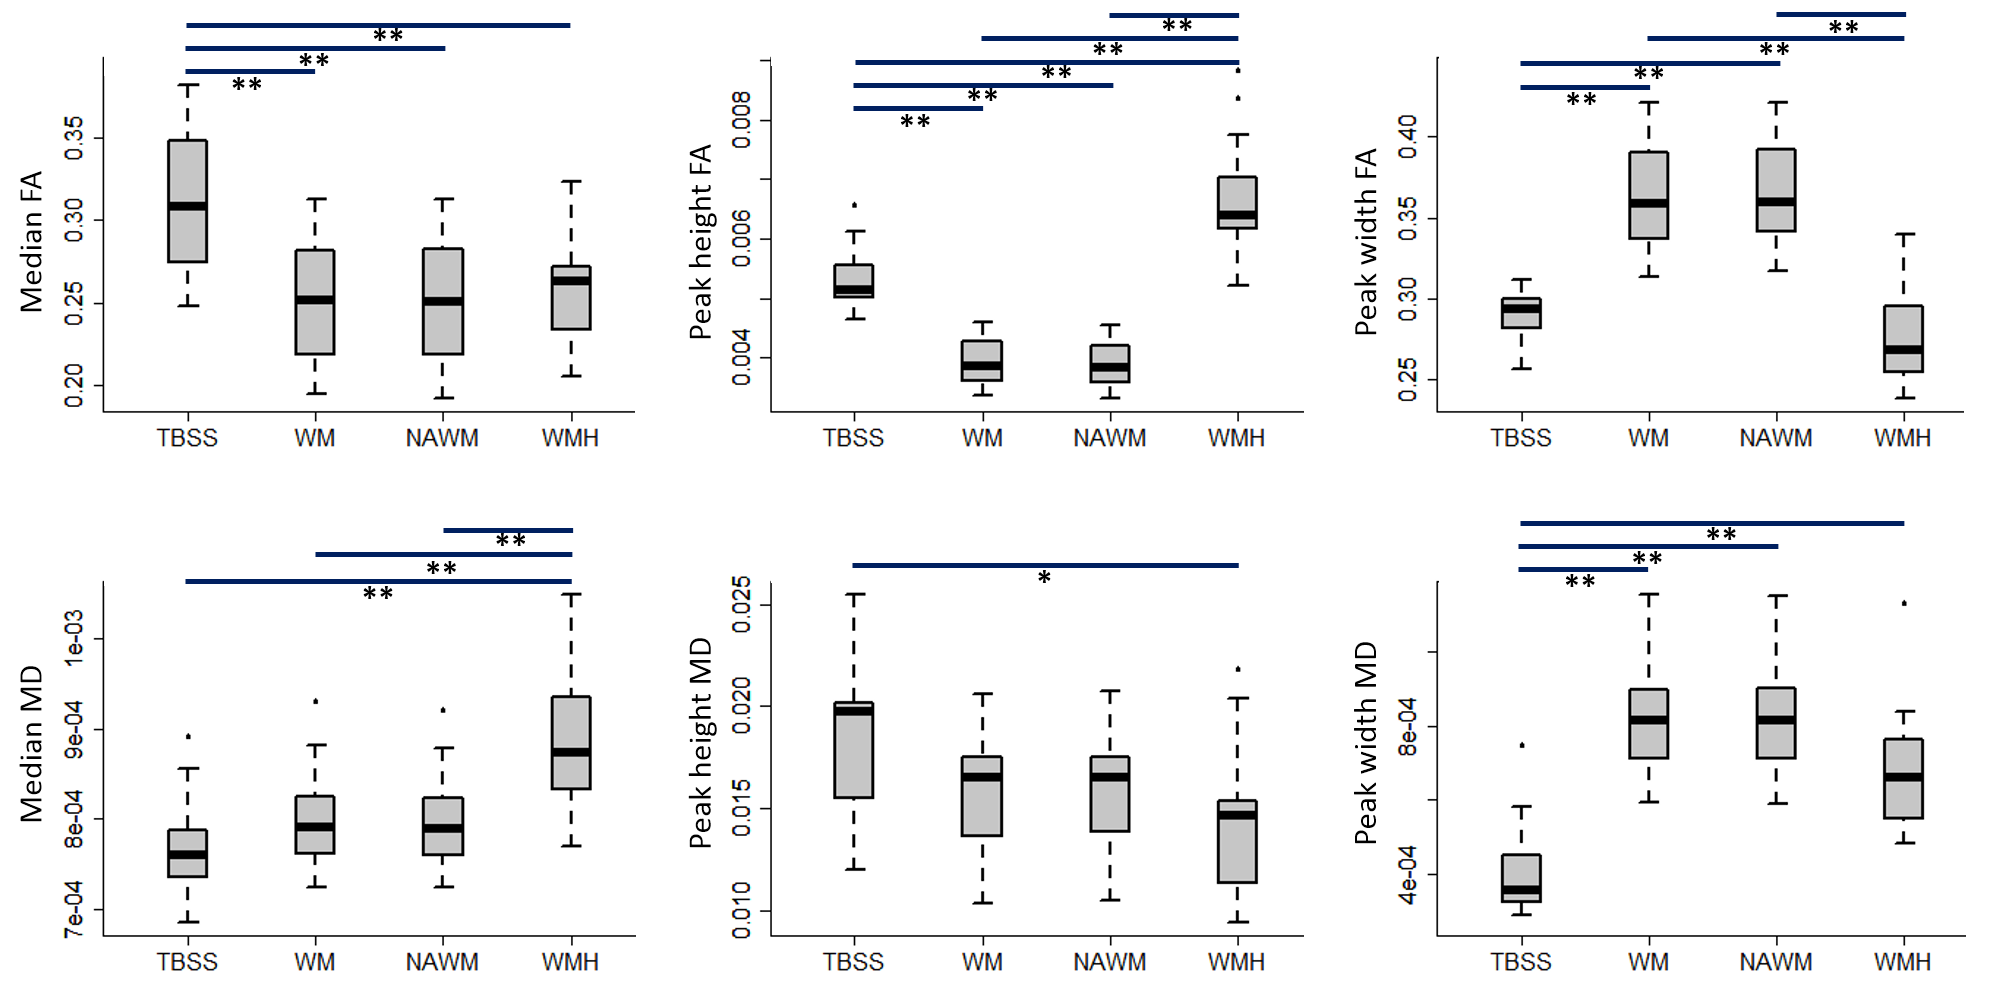
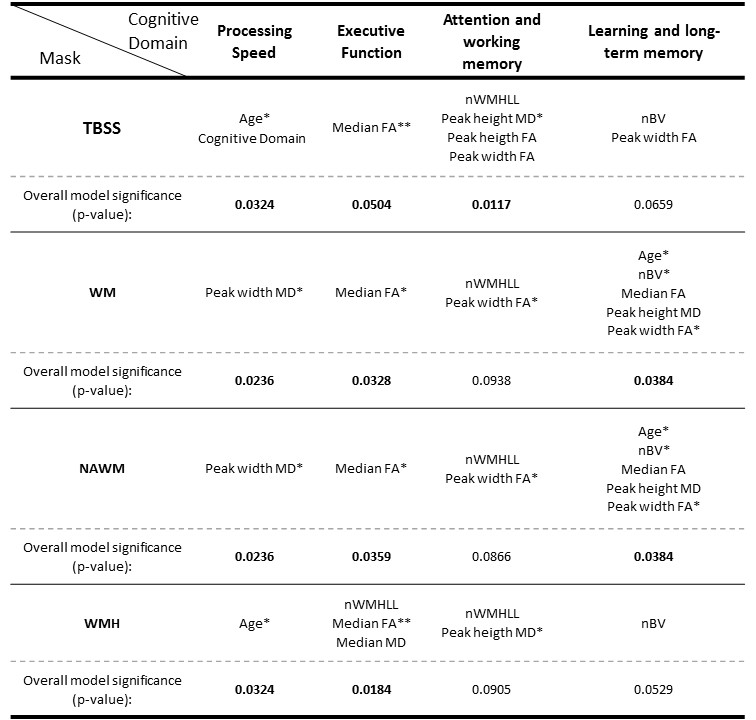
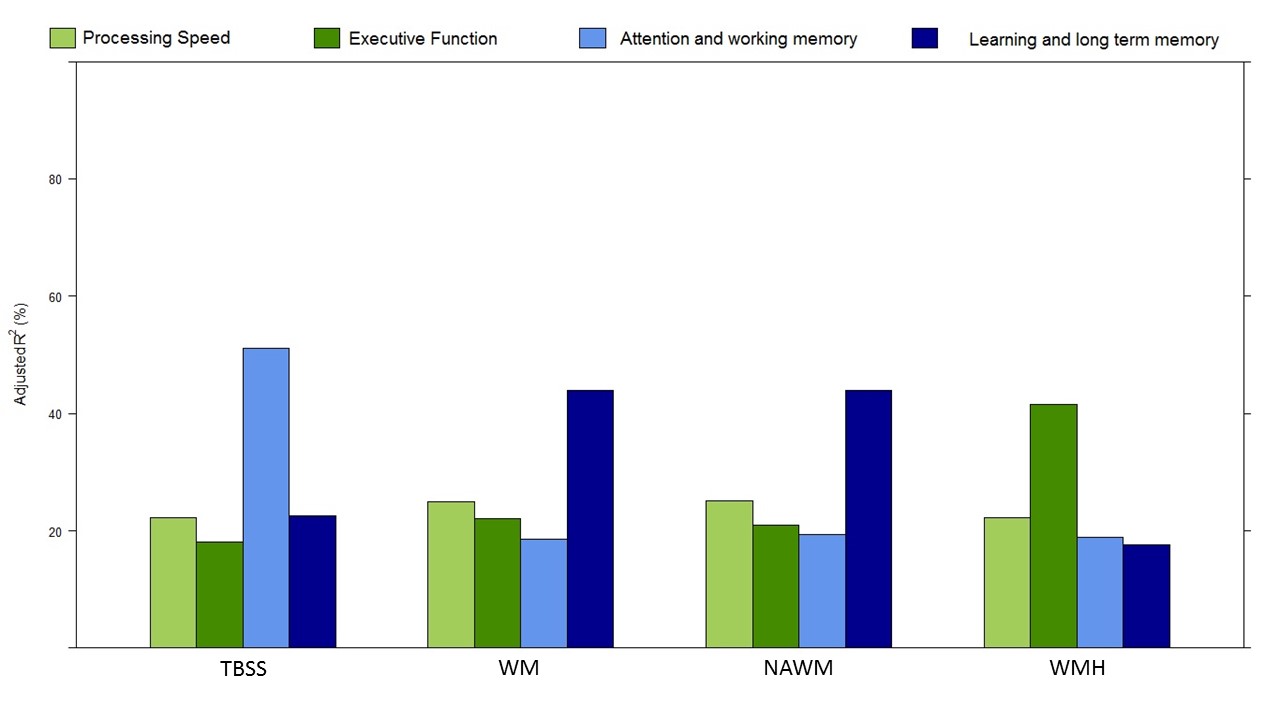
The distributions across all patients of the FA and MD metrics obtained with each mask are presented in Fig.3, showing effects of mask. The covariates selected by the stepwise model approach to explain the patients’ performance in each cognitive domain, using each mask, are shown in the table in Fig.4. The total adjusted R2 values for each stepwise model are shown in Fig.5.Conclusions
We found that multiple FA and MD metrics extracted from DTI explain a higher variance fraction of cognitive performance than conventional structural metrics (nWMHLL and nBV) in a group of SVD patients. Consistently with a previous report9, the MD Peak width was the best at predicting processing speed and the FA Median the best explaining executive function. Interestingly, cognitive domains not specific to SVD were better explained by more generic factors as age and nBV. Comparing between masks, as the WMH mask contained fewer voxels, it displayed lower sensitivity. Although a clinical, non-optimized, DWI sequence was used for this analysis, we could observe that the stepwise model preferentially selected DTI metrics to explain variability in cognitive performance. DTI metrics thus show great potential as sensitive biomarkers in SVD.Acknowledgements
This work was funded by FCT grants PTDC/BBB-IMG/2137/2012 and UID/EEA/50009/2013References
1. Banerjee G, Wilson D, Jäger HR, Werring DJ. Novel imaging techniques in cerebral small vessel diseases and vascular cognitive impairment. Biochim Biophys Acta - Mol Basis Dis. 2015;1862(5):926-938. doi:10.1016/j.bbadis.2015.12.010.
2. Patel B, Markus HS. Magnetic resonance imaging in cerebral small vessel disease and its use as a surrogate disease marker. Int J Stroke. 2011;6(1):47-59. doi:10.1111/j.1747-4949.2010.00552.x.
3. Cullen B, Moreton FC, Stringer MS, et al. Resting state connectivity and cognitive performance in adults with cerebral autosomal-dominant arteriopathy with subcortical infarcts and leukoencephalopathy. J Cereb Blood Flow Metab. 2016;36(5):981-991. doi:10.1177/0271678X16636395.
4. Smith SM, De Stefano N, Jenkinson M, Matthews PM. Normalized accurate measurement of longitudinal brain change. J Comput Assist Tomogr. 2001;25(3):466-475.
5. Zhang Y, Brady M, Smith S. Segmentation of brain MR images through a hidden Markov random field model and the expectation-maximization algorithm. IEEE Trans Med Imaging. 2001;20(1):45-57. doi:10.1109/42.906424.
6. Stanagithubio. ANTs by stana. http://stnava.github.io/ANTs/. Published 2017. Accessed November 8, 1BC.
7. Andersson JLR, Graham MS. Incorporating outlier detection and replacement into a non-parametric framework for movement and distortion correction of diffusion MR images. Neuroimage. 2016;141:556-572. doi:10.1016/j.neuroimage.2016.06.058.
8. Croall ID, Lohner V, Moynihan B, et al. Using DTI to assess white matter microstructure in cerebral small vessel disease ( SVD ) in multicentre studies. Clin Sci. 2017;131:1361-1373. doi:10.1042/CS20170146.
9. Wilkinson G, Rogers C. Symbolic description of factorial models for analysis of variance. Appl Stat. 1973;22(3):392-399. doi:10.2307/2346786.
10. Hastis T, Pregibon D. Statistical Models in S. In: Chambers J, Hastie T, eds. Generalized Linear Models. Wadsworth & Brooks/Cole.; 1992.
11. Baykara E, Gesierich B, Adam R, et al. A Novel Imaging Marker for Small Vessel Disease Based on Skeletonization of White Matter Tracts and Diffusion Histograms. Ann Neurol. 2016;80(4):581-592.
Figures