3173
High Resolution Black-blood T1-weighted Turbo Spin Echo with Variable Flip Angles for Visualization of Small Perforating Arteries at 3 and 7 Tesla1Stevens Neuroimaging and Informatics Institute, University of Southern California, Los Angeles, CA, United States
Synopsis
Cerebral small vessel disease frequently affects the small perforating arteries, resulting in silent strokes, which contribute to progressive cognitive impairment in elderly persons. Previous studies have demonstrated the ability of time-of-flight (TOF) MRA to non-invasively image these small arteries at 7T; In this study, we introduce and optimize a T1-weighted turbo spin echo sequence with variable flip angles (T1w-VFA-TSE) sequence for high resolution black blood MRI to delineate the lenticulostriate arteries (LSA) at 3T and 7T. Our results show T1w-VFA-TSE provides high contrast for visualizing LSAs and delineates small arteries better than TOF MRA at 7T.
Purpose
Cerebral small vessel disease (SVD) leads to cognitive decline and is the most common vascular cause of dementia1. Small arteries, particularly the lenticulostriate arteries (LSA), are known to be involved in silent stroke and lacunar infarcts. Previous studies have demonstrated the ability of time-of-flight (TOF) MRA to non-invasively image these small arteries at 7T2,3; however, small arteries with slow flow are prone to saturation effects of TOF MRA. In this work, we introduce a novel application using high-resolution 3D black-blood T1-weighted turbo spin echo sequence with variable flip angles (T1w-VFA-TSE) for visualizing LSAs at 3T and 7T.Methods
Six young volunteers (3 female, 26±3 years) and two aged volunteers (2 female, 64±1 years) were scanned on both a Siemens 3T Prisma scanner using a 32-channel head coil and a 7T Terra scanner using a 1Tx/32Rx head coil. A 3D T1w TSE sequence with VFA (T1w-VFA-TSE), originally developed for vessel wall imaging4-6, was adapted for small vessel imaging given its suppression of (slow) flowing blood by the TSE echo train resulting in excellent contrast between vessels and surrounding tissue. Optimization of the T1w-VFA-TSE imaging protocol was performed using extended phase graph (EPG) simulations. The slow flow dephasing of blood signal within the LSAs was incorporated into the model by defining accrued phase with the following equation: $$\phi_n = \gamma (\overrightarrow{v} \cdot \int \overrightarrow{G}(t)dt) (n\cdot\tau)$$ where G is the applied gradient amplitude, v is the flow velocity profiles in small arteries (3.9-5.1 cm/s)7, and τ is half of the echo spacing. For EPG simulations, white matter was assumed to have T1/T2=1084/69 ms and T1/T2=1220/46 ms for 3T and 7T, respectively. Arterial blood was assumed to have T1/T2=1932/275 ms and T1/T2=2587/68 ms for 3T and 7T, respectively8,9. Based on EPG simulation results, the optimal imaging parameters at 3T were voxel size=0.52x0.52x0.5 mm3 interpolated to 0.26x0.26x0.5 mm3, 166 sagittal slices (with two saturation bands to avoid signal wrapping), TE/TR=12/1000ms, ETL=41, scan time=9:05 min. To minimize potential pulsatile motion artifacts, ECG triggering was performed on 3 subjects with an acquisition window of 1000 ms at 3T. At 7T, the optimal sequence parameters were voxel size=0.5 mm3 isotropic, 288 sagittal slices, TE/TR=13/1200ms, ETL=40, scan time=10 min. The anti-driven-equilibrium (ADE) pulse was applied at the end of the TSE echo train. A TOF MRA sequence was performed for comparison with the following parameters (voxel size=0.4 mm3 isotropic, 72 transverse slices, TE/TR=4.67/12 ms, scan time=9:32 min). Thin slab minimum intensity projection (minIP) images were generated from 3D T1w-VFA-TSE volumes for visualizing LSAs. Contrast to noise ratio (CNR) was calculated to compare image quality between 3T and 7T sequences.Results
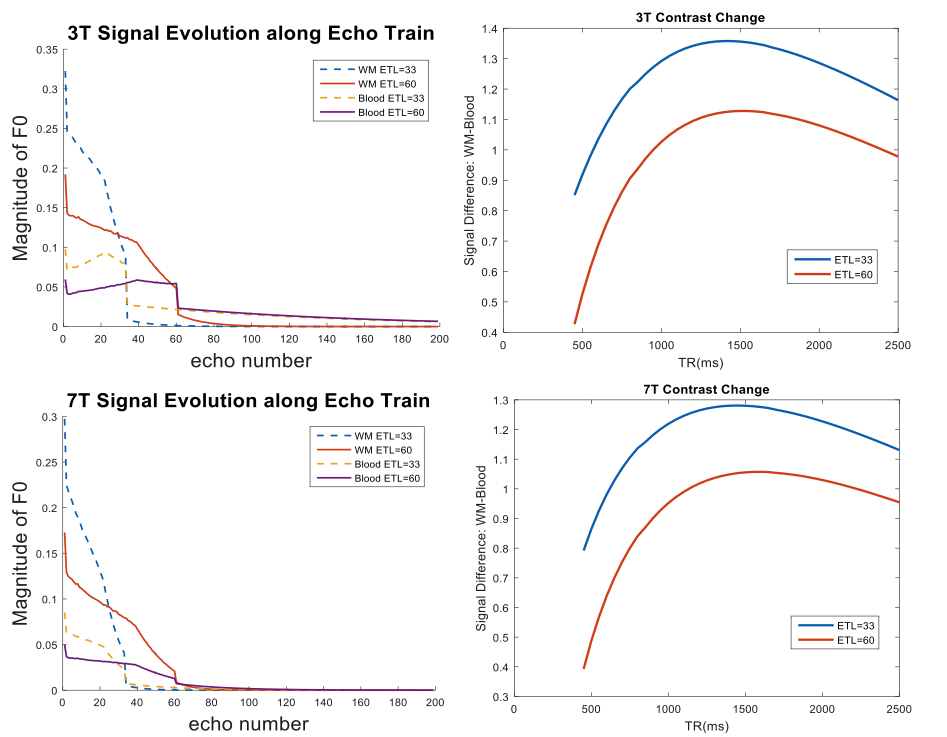
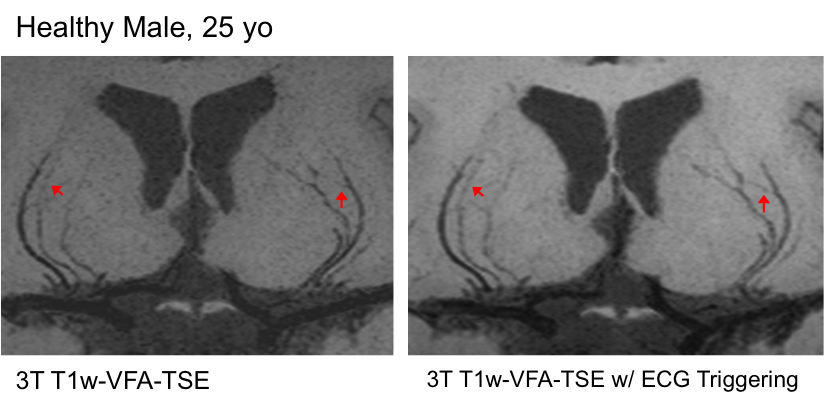
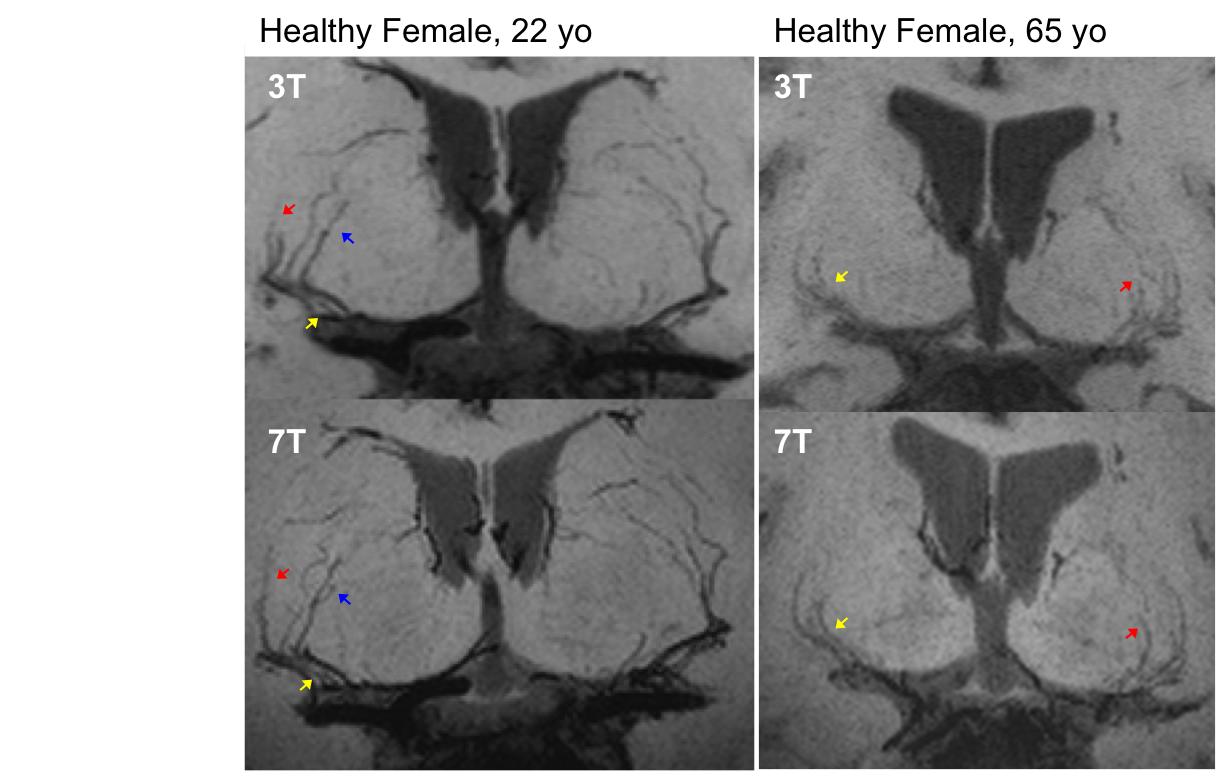
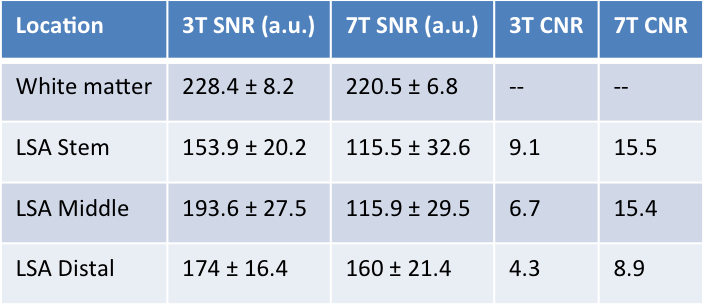
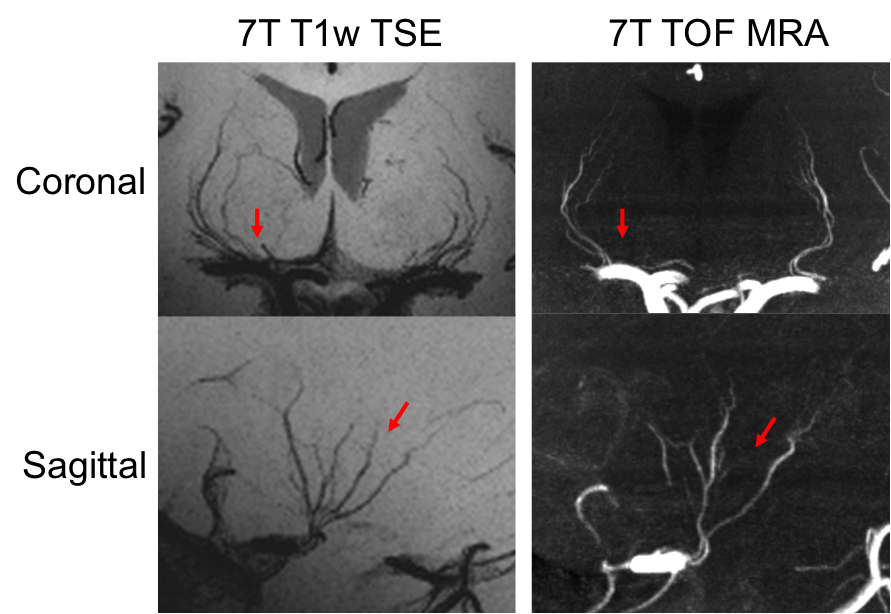
Figure 1 shows EPG simulation results with two echo train lengths (ETL) at 3 and 7T. The blood signal is suppressed to ~1/3 and ~1/4 of white matter (WM) signals at 3 and 7T, respectively. The black-blood contrast is higher with the ETL of 33 compared to ETL of 60, and starts to plateau around the TR of 1000ms and 1200ms at 3 and 7T, respectively, which were employed in experiments. Due to the tradeoff with total scan time, an ETL of 40 was chosen for the actual image acquisition. Figure 2 shows the effectiveness of ECG triggering at 3T for reducing pulsatile motion artifacts; the overall reduction of noise enables the better visualization of distal portions of the LSAs at the center of the brain. Figure 3 displays the LSAs using minIP across 10 mm slices from two representative subjects at 3T and 7T. Improved delineation of LSAs, especially in distal regions, can be appreciated at 7T compared to 3T for both young and older subjects. Comparison of CNR for blood in the LSAs relative to adjacent white matter between 3T vs. 7T (Table 1. CNR: 9.1 vs. 15.5, 6.7 vs. 15.4, and 4.3 vs. 8.9 for the stem, middle, and distal regions, respectively) further demonstrate that LSAs imaged at 7T have better contrast in general and especially in the distal portions as noted by the colored arrows. Comparison of T1w-VFA-TSE and TOF MRA at 7T shows that T1w-VFA-TSE is able to delineate more small LSA branches than TOF MRA at 7T (Figure 4).Discussion and Conclusion
There is currently no standard for visualizing LSAs, though previous studies have demonstrated potential value of TOF MRA at 7T. High-resolution black-blood T1w–VFA-TSE has the advantages of better visualization of slow flowing blood, simultaneous imaging of blood vessel and brain structure, and potentially wider clinical applicability at both 3 and 7T. Particularly, 7T T1w–VFA-TSE technique could be a promising imaging marker of cerebral small vessel diseases.Acknowledgements
This work was supported by National Institute of Health (NIH) grant UH2-NS100614.References
1. Gorelick PB, Scuteri A, Black SE, et al. Vascular contributions to cognitive impairment and dementia: a statement for healthcare professionals from the american heart association/american stroke association. Stroke 2011; 42(9): 2672-713.
2. Kang CK, Park CA, Lee H, et al. Hypertension correlates with lenticulostriate arteries visualized by 7T magnetic resonance angiography. Hypertension 2009; 54(5): 1050-6.
3. Seo SW, Kang CK, Kim SH, et al. Measurements of lenticulostriate arteries using 7T MRI: new imaging markers for subcortical vascular dementia. J Neurol Sci 2012; 322(1-2): 200-5.
4. Qiao Y, Steinman DA, Qin Q, et al. Intracranial arterial wall imaging using three-dimensional high isotropic resolution black blood MRI at 3.0 Tesla. J Magn Reson Imaging 2011; 34(1): 22-30.
5. Qiao Y, Zeiler SR, Mirbagheri S, et al. Intracranial plaque enhancement in patients with cerebrovascular events on high-spatial-resolution MR images. Radiology 2014; 271(2): 534-42.
6. Fan Z, Yang Q, Deng Z, et al. Whole-brain intracranial vessel wall imaging at 3 Tesla using cerebrospinal fluid-attenuated T1-weighted 3D turbo spin echo. Magn Reson Med 2016.
7. Bouvy WH, Geurts LJ, Kuijf HJ, et al. Assessment of blood flow velocity and pulsatility in cerebral perforating arteries with 7‐T quantitative flow MRI. Nmr in Biomedicine 2016; 29(9): 1295-304.
8. Blockley NP, Jiang L, Gardener AG, Ludman CN, Francis ST, Gowland PA. Field strength dependence of R1 and R 2* relaxivities of human whole blood to prohance, vasovist, and deoxyhemoglobin. Magnetic Resonance in Medicine 2008; 60(6): 1313-20.
9. Dobre MC, Uğurbil K, Marjanska M. Determination of blood longitudinal relaxation time (T1) at high magnetic field strengths. Magnetic Resonance Imaging 2007; 25(5): 733-5.
Figures