3168
19F Signal Distribution in Pre-Symptomatic Experimental Autoimmune Encephalomyelitis1Berlin Ultrahigh Field Facility (B.U.F.F.), Max Delbrück Center for Molecular Medicine in the Helmholtz Association(MDC), Berlin, Germany, Berlin, Germany, 2Experimental and Clinical Research Center, a joint cooperation between the Charité Medical Faculty and the Max Delbrück Center for Molecular Medicine in the Helmholtz Association, Berlin, Germany, Berlin, Germany
Synopsis
Experimental autoimmune encephalomyelitis (EAE) is an animal model used to study the pathogenesis of autoimmune neuroinflammatory diseases, such as multiple sclerosis (MS). In MS, recruitment of immune cells into the central nervous system (CNS) occurs already at early stages of the disease. Magnetic resonance imaging (MRI) can be used as a non-invasive technique suited for tracking immune cell migration, following intravenous administration of fluorine (19F)-loaded nanoparticles which can then be followed using 19F MR techniques. The present study aims to investigate the distribution of immune cells during the pre-symptomatic disease phase in the EAE mouse model using 19F MR methods.
Introduction
Neuroinflammatory
autoimmune conditions such as multiple sclerosis (MS) involve the early
recruitment of immune cells from the periphery into the CNS1,2, leading
to myelin destruction and neuronal damage. Experimental autoimmune
encephalomyelitis (EAE) is an animal model of autoimmune demyelinating disease
which shares various features with MS2. 19F Magnetic
Resonance Imaging (19F-MRI) holds promise as a method for the
non-invasive imaging of cells due to its high detection sensitivity and
specificity3. Intravenously-administered 19F-nanoparticles
(NPs) are taken up by phagocytic immune cells (labeling) which then migrate to
the areas of inflammation. Given the lack of endogenous 19F in the
body, a 19F MR image will only include signals related to the
exogenous 19F-NPs, allowing the specific tracking of these cells3.
The successful application of cell tracking using 19F-MRI has been
shown experimentally in animal models4-6 and in humans7. However,
in order to apply these methods in a clinical context, it is crucial to
understand the distribution of the NPs in
vivo. For this objective, we investigated the uptake of NPs by inflammatory
cells and their distribution in the CNS, liver, spleen, and kidney of
pre-symptomatic EAE mice using 19F MR methods.
Methods
EAE Experiments
SJL/J female mice (n=9) were immunized subcutaneously with PLP139-151 and complete Freund’s adjuvant, followed by 200ng Pertussis toxin i.p. on d0 and d24. Nanoparticles were prepared by emulsifying 1200mM of perfluoro-15-crown-ether (PFCE, Fluorochem, UK) with Pluronic F-68 (Sigma-Aldrich, Germany) using a titanium sonotrode (Sonopuls GM80, Bandelin, Germany) as previously described8. Mice were administered the nanoparticle preparation (10μmol) i.v. for 5 days (d5-d9 after immunization)4. On d10, mice were perfused with PBS, and fixed in paraformaldehyde (PFA). Mice CNS, kidneys, spleen, and liver were embedded in 15ml Falcon tubes filled with 4% PFA.
MR Methods
Experiments were performed on a 9.4T animal MR scanner
(Bruker BioSpin, Ettlingen, Germany) using a dual-tuned 19F/1H
room temperature (RT) volume head coil4. 19F signal was
measured using non-localized spectroscopy
(single pulse: TR=1000ms, NA=1800, TA=30min) and quantified by calculating
the Y-axis intercept of the FID fit in MATLAB (The MathWorks, Inc., USA). Post-processing
using MATLAB included zero-filling, line-broadening, phase, and baseline
correction. Images were acquired using 1H 3D-RARE (TE/TR=7/1300ms,
NA=4, spatial res=(0.0625x0.0625x0.0625)mm3, TA=1h) and 19F
3D-RARE (TE/TR=3/800ms, NA=174, spatial res=(0.2044x0.2051x0.2051)mm3,
TA=1h), respectively. In the particular case of the kidneys, the 19F
3D-RARE method included NA=348 (TA=2h) given that spectroscopy revealed a low 19F
signal.
Results
Spectroscopy results
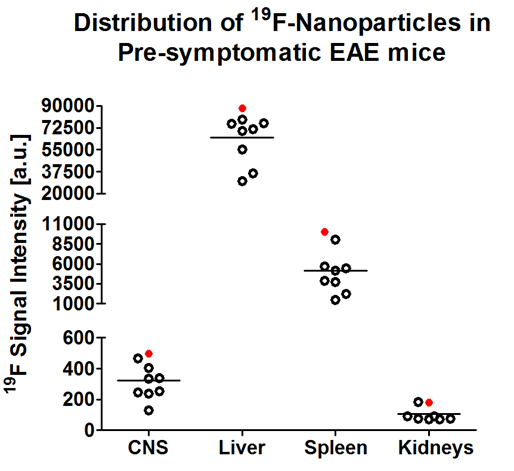
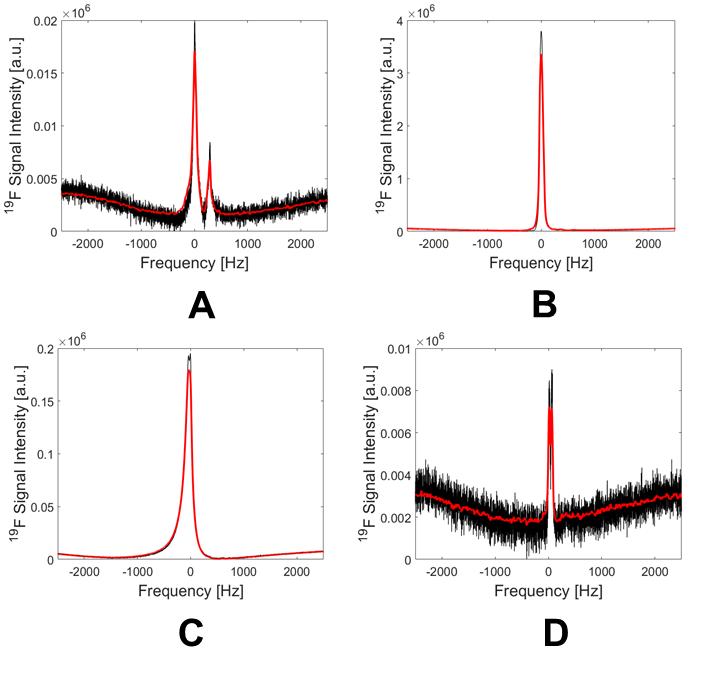
The spectroscopy results show an uneven distribution of the PFCE NPs between selected organs, with the highest 19F signal in the liver (Fig. 1), which was more than 1000-fold higher than the 19F signal in the CNS. This could be explained by the expected clearance route for the i.v.-administered NPs. A strong 19F signal was also observed in the spleen, suggesting a high turnover and circulation of inflammatory cells already during the early stages of pathology. Exemplary spectra are shown in Fig. 2 corresponding to mouse #5. Interestingly, a spectrum with two peaks was observed in the CNS. This was also observed in all n=9 mice, which might suggest the labeling of different immune cell subtypes or possibly the presence of free nanoparticles in the blood stream. High 19F signal peaks were observed for both liver and spleen, and only a minor signal was detected in the kidney.
Imaging results
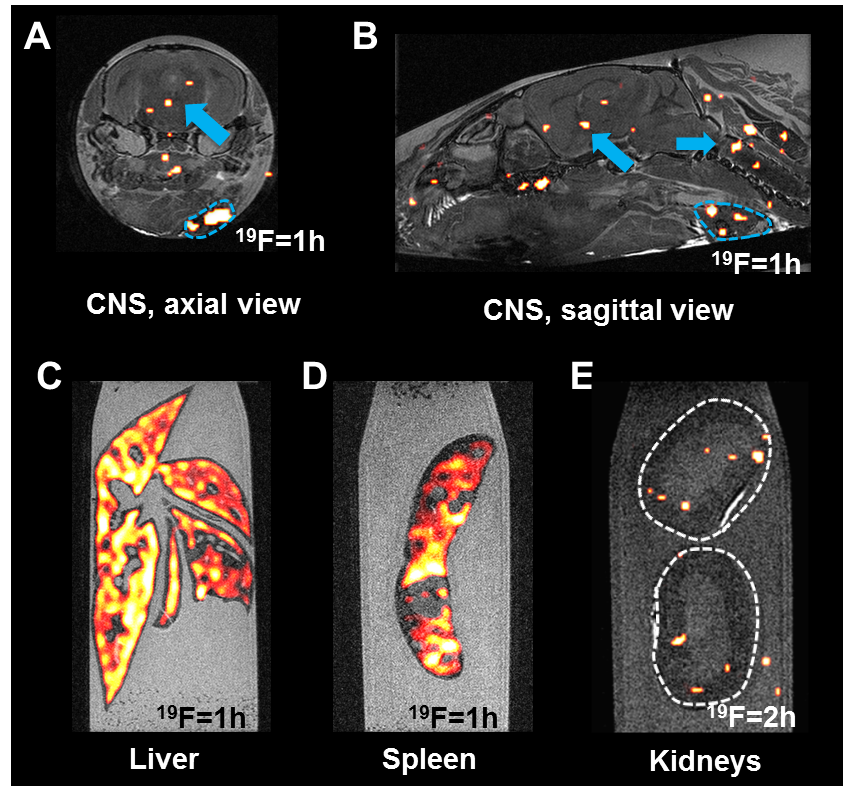
Imaging (Fig. 3) shows a relatively even distribution in the liver (C). In the spleen (D) there is a lack of signal in the areas coinciding with the lymphoid follicles, where there are no macrophages. Conversely, the surrounding reticulo-endothelial areas show a high 19F signal. Early signs of pathology are shown by 19F signals in the brain and spinal cord (A-B) even though the mice were asymptomatic. Additionally, signal was seen in the adjacent lymph nodes (outlined in blue). In contrast to liver and spleen, the kidneys (E) showed little signal even when the time of acquisition was doubled.
Conclusion
In this work we investigated the distribution of 19F signal in the pre-symptomatic EAE mouse following application of PFCE NPs. This is important to better understand what happens to NPs in vivo, and is highly relevant for any future clinical use of the NPs and 19F MRI. Findings of particular interest are the observation of two peaks in the CNS spectra, as well as the 19F signals present in other structures besides the typical areas of immune cell infiltration, which require further investigation using histology. Further experiments are warranted to investigate the distribution of free NPs versus those taken up by inflammatory cells in all the relevant organs.Acknowledgements
This work was supported by a grant of the Deutsche Forschungsgemeinschaft (DFG) to Sonia Waiczies and Andreas Pohlmann.References
1) Stadelmann, C, Wegner, C, Brück, W. Inflammation, demyelination, and degeneration - Recent insights from MS pathology. Biochimica et Biophysica Acta. 2011; 1812: 275-282.
2) Constantinescu, C S, Farooqi, N, O'Brien, K, et al. Experimental autoimmune encephalomyelitis (EAE) as a model for multiple sclerosis (MS). Br J Pharmacol. 2011; 164: 1079-1106.
3) Ruiz-Cabello, J, Barnett, B P, Bottomley, P A, et al.
Fluorine (19F) MRS and MRI in biomedicine. 2011; 24(2): 114-129.
4) Waiczies, H, Lepore, S, Drechsler, S, et al. Visualizing brain inflammation with a shingled-leg radio-frequency head probe for 19F/1H. Sci Rep. 2013; 3: 1280.
5) Srinivas,
M, Boehm-Sturm, P, Aswendt, M, et al. In vivo 19F MRI for cell tracking. J. Vis. Exp. 81:e50802.
6) Waiczies, S, Millward, J M, Starke, L, et al. Enhanced fluorine-19 MRI sensitivity using a cryogenic radiofrequency probe: technical developments and ex vivo demonstration in a mouse model of neuroinflammation. Sci Rep 2017; 7: 9808.
7) Ahrens, E T, Helfer, B M, O’Hanlon, C F, et al. Clinical cell therapy using a perfluorocarbon tracer and fluorine-19 MRI. Magn Reson Med. 2014; 72(6): 1696-1701.
8) Waiczies, H, Lepore, S, Janitzek, N, et al. Perfluorocarbon particle size influences magnetic resonance signal and immunological properties of dendritic cells. PLoS One. 2011; 6(7):e21981.
Figures