3167
A real-time metabolic investigation of the effect of hypothermia on hypoxic ischemia during mouse brain development using hyperpolarized 13C1Department of Radiology and Biomedical Imaging, University of California San Francisco, San Francisco, CA, United States, 2Department of Neurology, University of California San Francisco, San Francisco, CA, United States, 3Department of Pediatrics, University of California San Francisco, San Francisco, CA, United States
Synopsis
In this study, we applied dynamic nuclear polarization (DNP) technique to investigate C1 labeled 13C pyruvate to lactate conversion to study the effect of hypothermia treatment on hypoxic ischemia (HI) injured neonatal mouse brains during development. Our results showed that lower pyruvate delivery to the injured hemisphere in comparison to the non-injured hemisphere at the day of injury (P10) for all subjects, and difference narrows as the brain matures. There were different individual responses to the lactate to pyruvate ratio between two hemispheres. With this technique, we are able to examine individual responses to treatment during brain development.
Introduction
Hypoxic-ischemia (HI) is an important cause of neonatal death and disability. Hypothermia has been accepted as the standard intervention for HI, even though it brings protection for only up to 60% of the babies [1]. However, the metabolic mechanisms of HI are not fully understood and differences in individual responses to hypothermia are unknown. Dynamic nuclear polarization (DNP) has been proven to increase 13C NMR signal for more than 10,000 fold, allowing investigations of 13C metabolic exchanges in vivo [2,3]. Using DNP, our study investigated the changes in pyruvate to lactate conversion during maturation in HI mice with hypothermia treatment.Methods
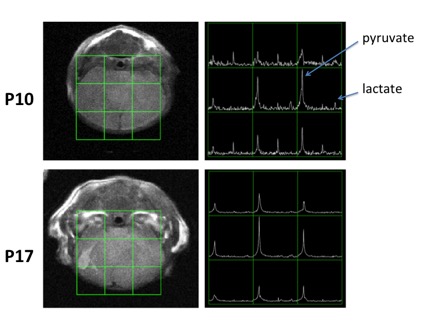
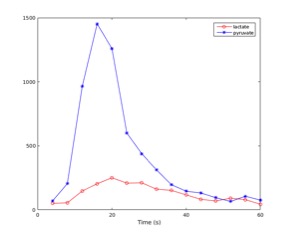
Preparation: 7 mice received HI using the Vannucci model [4] on the left hemisphere at postnatal day 10 (P10) and followed by whole-body hypothermia for 3.5 hours. They were scanned at P10, P17 and P31. Some data points were slightly shifted or missing due to scanner availability, technical issues or animal expiration. All experiments were conducted on a vertical 14T NMR spectrometer with a 40mm diameter 1H and 13C dual-tuned coil. C1 labeled 13C pyruvate was polarized and 150µL of the dissolution mixture containing 160mM pyruvate was injected into the tail vein through a catheter over a span of 12 seconds. Data acquisition: Data were acquired on a 24 mm × 24 mm × 5 mm slab centered on the brain, with 2D chemical-shift imaging acquired using center-out 7x7 phase encodings. The acquisition was started simultaneously with pyruvate injection and repeated every 4s (3s TR with 1s delay between each repetition) for a total of 60s. A T2-weighted image was also acquired as anatomic reference. Data processing: The area under pyruvate and lactate curves (Figure 2) was taken from a voxel on each of the hemispheres. The pyruvate signal difference between two hemispheres were calculated as Diffpyr = (PyrR–PyrL)/(PyrR+PyrL), where PyrR is the area under the pyruvate curve for the right hemisphere and PyrL is the same for the left. The difference in lactate to pyruvate ratio were calculated as Diffratio= (LacR/PyrR–LacL/PyrL)/(LacR/PyrR+LacL/PyrL), where LacR/PyrR is the ratio of the area under the lactate curve to the area under the pyruvate curve for the right hemisphere and LacL/PyrL is the same for the left.Results
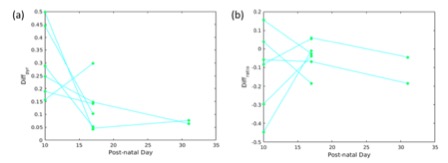
Figure 1 shows the T2-weighted imaging results of a representative subject at P10 and P17. One can observe slight hypointensity at P10 and hyperintensity at P17 on the left hemisphere. There is a significant reduction of pyruvate uptake in the left hemisphere than the right at P10, but the difference narrows at P17. Figure 3a shows results from all subjects that the left hemisphere has much less pyruvate level at P10, but the difference shrinks while the brain matures, except for one outlier. In terms of lactate to pyruvate ratio, 2 subjects have much higher ratio at P10 on the left hemisphere while others show small (<20%) difference between both hemispheres (Figure 3b). The lactate to pyruvate ratio has small difference between both hemispheres at P17 and P31 for all subjects.Discussion
The results of comparing pyruvate delivery are consistent with our previous findings of HI subjects without hyperthermia treatment5, which the injured hemisphere has much less pyruvate level than the non-injured side on the day of injury (P10). This implies that hypothermia has no effect on the reduction of blood flow to the injured hemisphere. During HI injury, anaerobic respiration causes increase in lactate production, as we observed higher lactate to pyruvate ratio on the injured hemisphere for most of the subjects from our previous study. In this study, although some subjects still maintain high metabolism by producing higher lactate to pyruvate ratio on the injured hemisphere, most of the subjects has little difference between both hemispheres. This may suggest that hyperthermia is an effective way for some individuals to slow down metabolism after HI, which will consequently prevent apoptosis and long-term brain damage. A more comprehensive interpretation of individual responses will be accompanied by high resolution ex vivo MRI and histology after the completion of metabolic imaging. By applying hyperpolarized 13C, we are able to investigate longitudinal metabolic changes in vivo, which will provide a more thorough understanding of the underlying mechanisms during brain maturation of hypothermia treatment on HI injury.Acknowledgements
No acknowledgement found.References
[1] Shankaran S. Neonatal Encephalopathy: Treatment with Hypothermia. Journal of Neurotraum. 2009; 26, 3: 437-43.
[2] Ardenkjaer-Larsen JH, Fridlund B, Gram A, Hansson G, Hansson L, Lerche MH, et al. Increase in signal-to-noise ratio of > 10,000 times in liquid-state NMR. Proceedings of the National Academy of Sciences of the United States of America. 2003;100:10158-63.
[3] Golman K, in 't Zandt R, Thaning M. Real-time metabolic imaging. Proceedings of the National Academy of Sciences of the United States of America. 2006;103:11270-5.
[4] Rice JE, Vannucci RC, Brierley JB. The influence of immaturity on hypoxic‐ischemic brain damage in the rat. Annals of neurology. 1981;9:131-41.
[5] Chen Y, Lee B, Bok R, Park I, Sukumar S, Sheldon RA, et al. A metabolic study of hypoxic ischemia during mouse brain development using hyperpolarized 13C. Proceedings of the Society of Magnetic Resonance in Medicine 2017.
Figures