3166
Imaging toxin-induced inflammation in the mouse brain with hyperpolarized 13C MRS1Department of Physical Therapy and Rehabilitation Science, University of California San Francisco, San Francisco, CA, United States, 2Department of Radiology and Biomedical Imaging, University of California San Francisco, San Francisco, CA, United States
Synopsis
13C MRS of hyperpolarized (HP) [1-13C] pyruvate has recently shown promise in assessing neuroinflammation in mouse models of MS and TBI. Here, we expanded on previous reports and evaluated whether HP 13C MRS could detect the effect of the inflammation-inducing toxin lipopolysaccharide (LPS), using mice injected intracranially with either LPS or saline. LPS-injected mice showed significantly elevated HP [1-13C] lactate:pyruvate ratios in the LPS-injected hemisphere compared to contralateral, in line with increased microglial number. In contrast, saline-injected mice showed no such changes. Our results further confirm the potential of hyperpolarized 13C MRS for non-invasive assessment of neuroinflammation in the brain.
Introduction
Neuroinflammation is characteristic of many degenerative diseases, and there is increasing discussion around its benefits or harms. New techniques are required to assess the extent of inflammation in the brain, preferably non-invasively. Hyperpolarized (HP) 13C magnetic resonance spectroscopy (MRS) is a rapidly expanding technology for imaging metabolism in vivo, and has thus far been particularly informative on the conversion of pyruvate to lactate via lactate dehydrogenase1. The technique has recently been demonstrated to be specifically applicable to neuroinflammation in models of multiple sclerosis and traumatic brain injury, where increased HP [1-13C] lactate production was associated with the presence of high levels of activated microglia2–4. A commonly used agent for inducing neuroflammation outside of a specific disease setting is the endotoxin lipopolysaccharide (LPS)5,6. We hypothesized that hyperpolarized 13C MRS could visualize the effect of LPS in the mouse brain in vivo.Methods
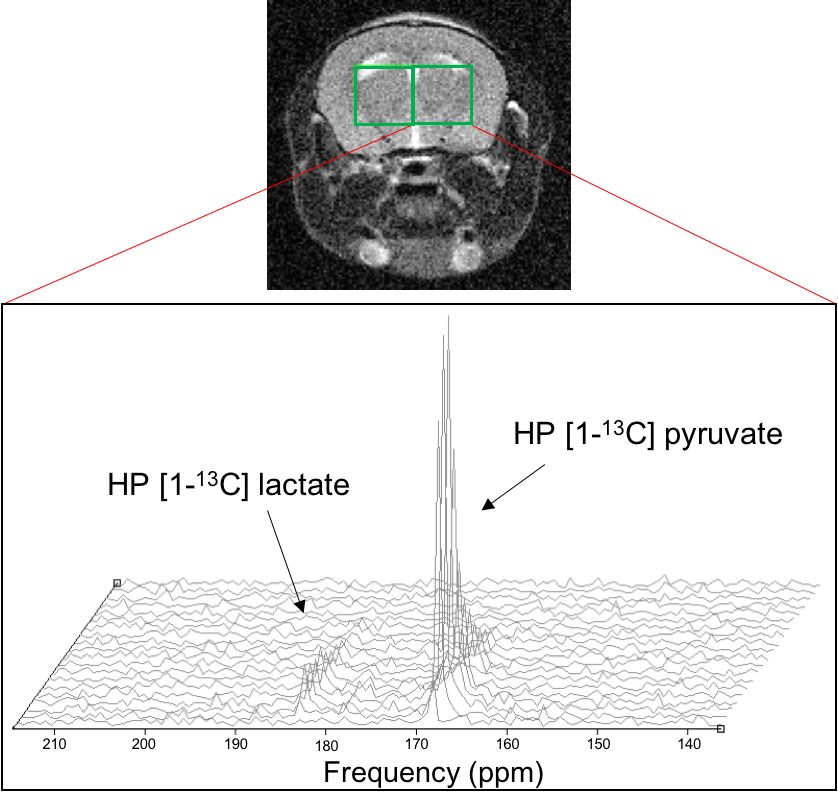
CX3CR1GFP/+CCR2RFP/+ reporter mice were intracranially injected with either saline (n=3) or LPS (n=3) into the right striatum (ipsilateral) using a stereotaxic frame. One week post-injection, MR acquisitions were performed on a 3T horizontal system (Bruker) with a dual-tuned 1H/13C mouse head coil (2cm diameter). T2-weighted data were acquired for co-registration of the spectral voxels (FOV 20x20mm, 192x192 matrix, NA=4, TR=2s, TE=60ms, 9 slices of thickness 1mm). Hyperpolarized [1-13C] pyruvate was administered (500μl from a dissolution of 24μl pyruvate in 4.5ml heated 80mM NaOH, Oxford Instruments polarizer) over 14s via a tail vein catheter; data were acquired every 4.2s using a dynamic 2D-CSI sequence (slice thickness 5mm, FOV 24x24, 8x8 matrix, TR=66.4ms, TE=1.24ms, Figure 1). One naïve mouse was also scanned.
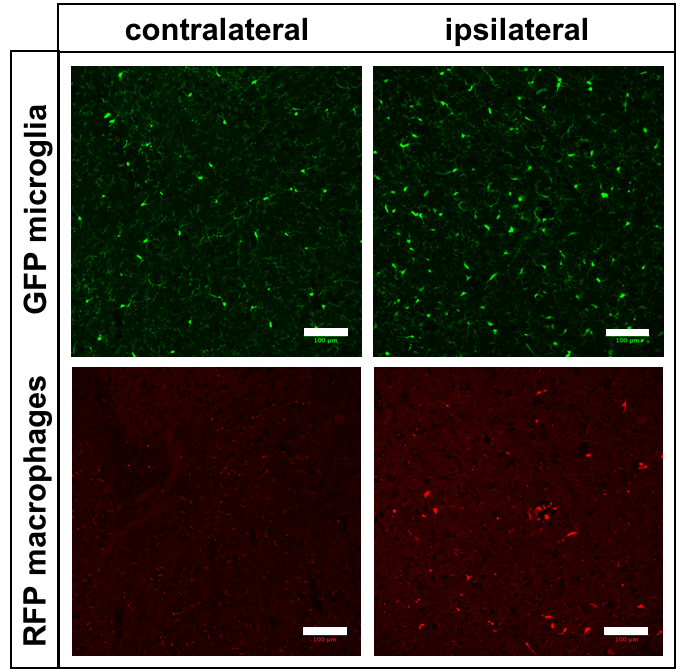
Animals were transcardially perfused and brains fixed (4% PFA). Fluorescence images of 10μm tissue slices were acquired; due to the reporter nature of the mice, microglia expressed GFP, and macrophages expressed RFP.
13C MRS data were analysed using in-house SIVIC software and custom-built MATLAB scripts. Spectra from ipsilateral and contralateral voxels (locations shown in Figure 1) were summed and peaks fitted to a Lorentzian curve prior to integration to obtain lactate:pyruvate ratios.
Results are expressed as mean ± standard deviation. A 2-way ANOVA was used for analysis of data shown in Figure 3A, and a students’ t-test for those in Figure 4B.
Results
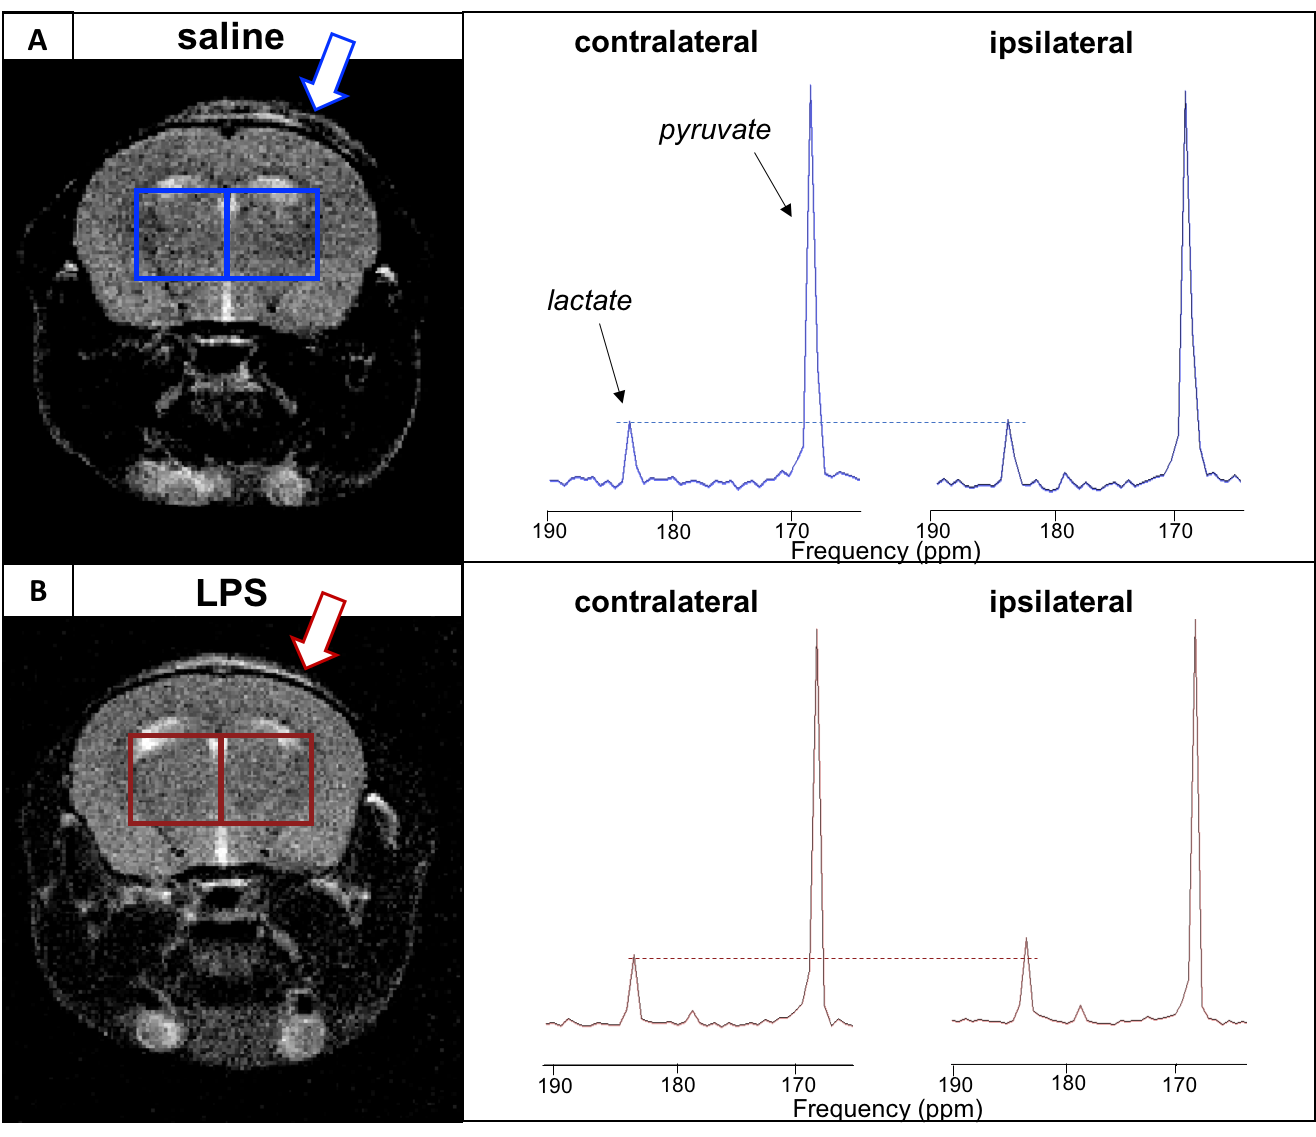
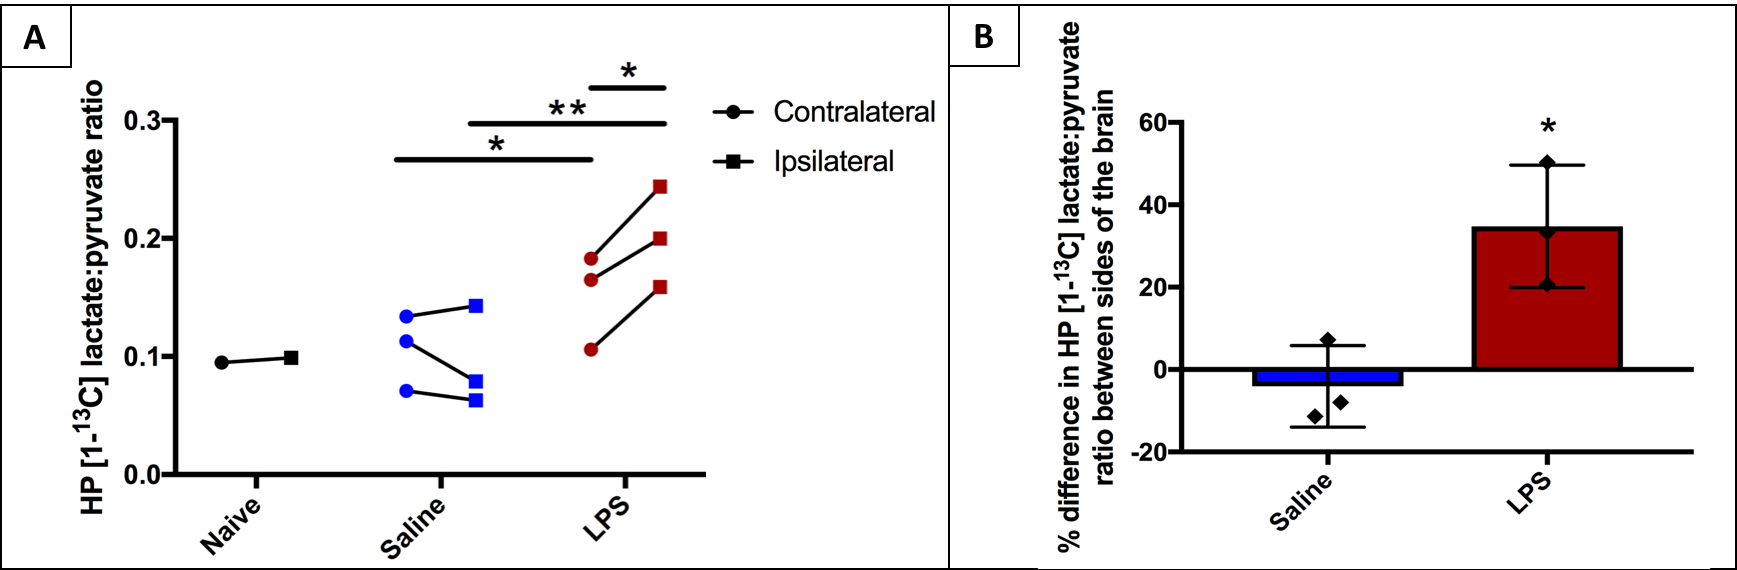
The HP [1-13C] lactate in the ipsilateral side of the LPS-injected animal was elevated in comparison to the contralateral side; this was not seen in saline-injected animals (Figure 2). Quantification of these differences is shown in Figure 3; 3A shows the HP [1-13C] lactate:pyruvate ratios in both voxels in a naïve animal, saline-injected and LPS-injected animals. When comparing data between saline and LPS groups, the contralateral ratios in the LPS mice were significantly elevated compared to the contralateral ratios in saline-injected mice (p=0.002). Similarly, the ipsilateral HP [1-13C] lactate:pyruvate ratios in the LPS-injected mice were significantly elevated compared to the ipsilateral hemisphere ratios in the saline-injected mice (p=0.015). Within the LPS group, the HP [1-13C] lactate:pyruvate ratios were significantly different between hemispheres (0.151 ± 0.041 vs 0.201 ± 0.043, p=0.012); this was not seen in the saline-injected group (0.106 ± 0.032 vs 0.095 ± 0.043, p=0.2).
Figure 3B displays the percentage differences in HP [1-13C] lactate:pyruvate between sides of the brain within each group; these differences were significantly greater between sides in the LPS-injected mice than in the saline-injected mice (p=0.02).
Finally, Figure 4 shows an increased number of microglia (GFP) and macrophages (RFP) in the ipsilateral side of an LPS-injected mouse brain relative to the contralateral side.
Discussion and Conclusion
Our data show that hyperpolarized 13C MRSI can visualize the effects of LPS in the mouse brain in vivo. The increased HP [1-13C] lactate:pyruvate ratios in the ipsilateral compared to the contralateral side of the LPS-injected mouse brain, along with the increased number of microglia and macrophages, are in line with previous work by Guglielmetti et al. in animal models of MS and TBI2,3; this increase in ratio was also seen in models of inflammatory liver injury7 and arthritis8. Further experiments (enzyme activity assays and completion of histological analysis) will be performed to investigate the underlying mechanism responsible for the changes we have seen thus far.
In conclusion, we can successfully detect increased HP [1-13C] lactate production in LPS-induced lesions, lending support to previous work which uses this technique to assess neuroinflammation non-invasively. HP 13C MRS is becoming an increasingly promising technique for non-invasive assessment of inflammatory status of the brain, and has great potential to inform on the extent of disease and the effectiveness of treatment.
Acknowledgements
We would like to acknowledge the following which funded this work: NIH R01NS102156, Cal-BRAIN 349087, NMSS research grant RG-1701-26630, the Hilton Foundation – Marilyn Hilton Award for Innovation in MS Research #17319 and the Dana Foundation: The David Mahoney Neuroimaging program
References
1. Nelson, S. J. et al. Sci. Transl. Med. 5, 198ra108 (2013).
2. Guglielmetti, C. et al. Proc. Natl. Acad. Sci. 201613345 (2017).
3. Guglielmetti, C., Chou, A., Van der Linden, A., Rosi, S. & Chaumeil, M. in ISMRM (2016).
4. DeVience, S. J. et al. Sci. Rep. 7, 1907 (2017).
5. Go, M., Kou, J., Lim, J.-E., Yang, J. & Fukuchi, K. Biochemical and Biophysical Research Communications 479, (2016).
6. Herber, D. L. et al. Exp. Neurol. 190, 245–253 (2004).
7. Josan, S. et al. NMR Biomed. 28, 1671–7 (2015).
8. MacKenzie, J. D. et al. Radiology 259, 414–420 (2011).
Figures