3162
Acute changes in rat brain metabolism after intravenous administration of alcohol, cocaine, and nicotine: A simultaneous PET/MR study with dynamic 1H-MRS and continuous infusion 18FDG.1KU Leuven – University of Leuven, MoSAIC, Molecular Small Animal Imaging Center, Leuven, Belgium., Leuven, Belgium, 2KU Leuven – University of Leuven/University Hospital Leuven, Division of Nuclear Medicine, Department of Imaging and Pathology, Leuven, Belgium., Leuven, Belgium, 3KU Leuven – University of Leuven, Biomedical MRI unit, Department of Imaging and Pathology, Leuven, Belgium, Leuven, Belgium, 4Bruker BioSpin, Preclinical Imaging NMI, Valencia, Spain
Synopsis
We have combined PET imaging with continuous 18F-deoxy-glucose PET and dynamic 1H-MRS focused on the prefrontal cortex in a rodent model of substance abuse. During imaging, animals received an intravenous injection of saline, alcohol, cocaine, or nicotine. Cocaine administration reduced the regional cerebral metabolic rate of glucose (rCMRGlu) as measured by PET, but increased prefrontal glucose and creatine levels as measured with dynamic MRS. Furthermore, alcohol administration significantly influenced the prefrontal concentration of ethanol, glucose, creatine, and glutamate. Finally, our data show that alcohol induces a transient decrease in prefrontal glutamate coinciding with the peak in ethanol concentration.
Introduction
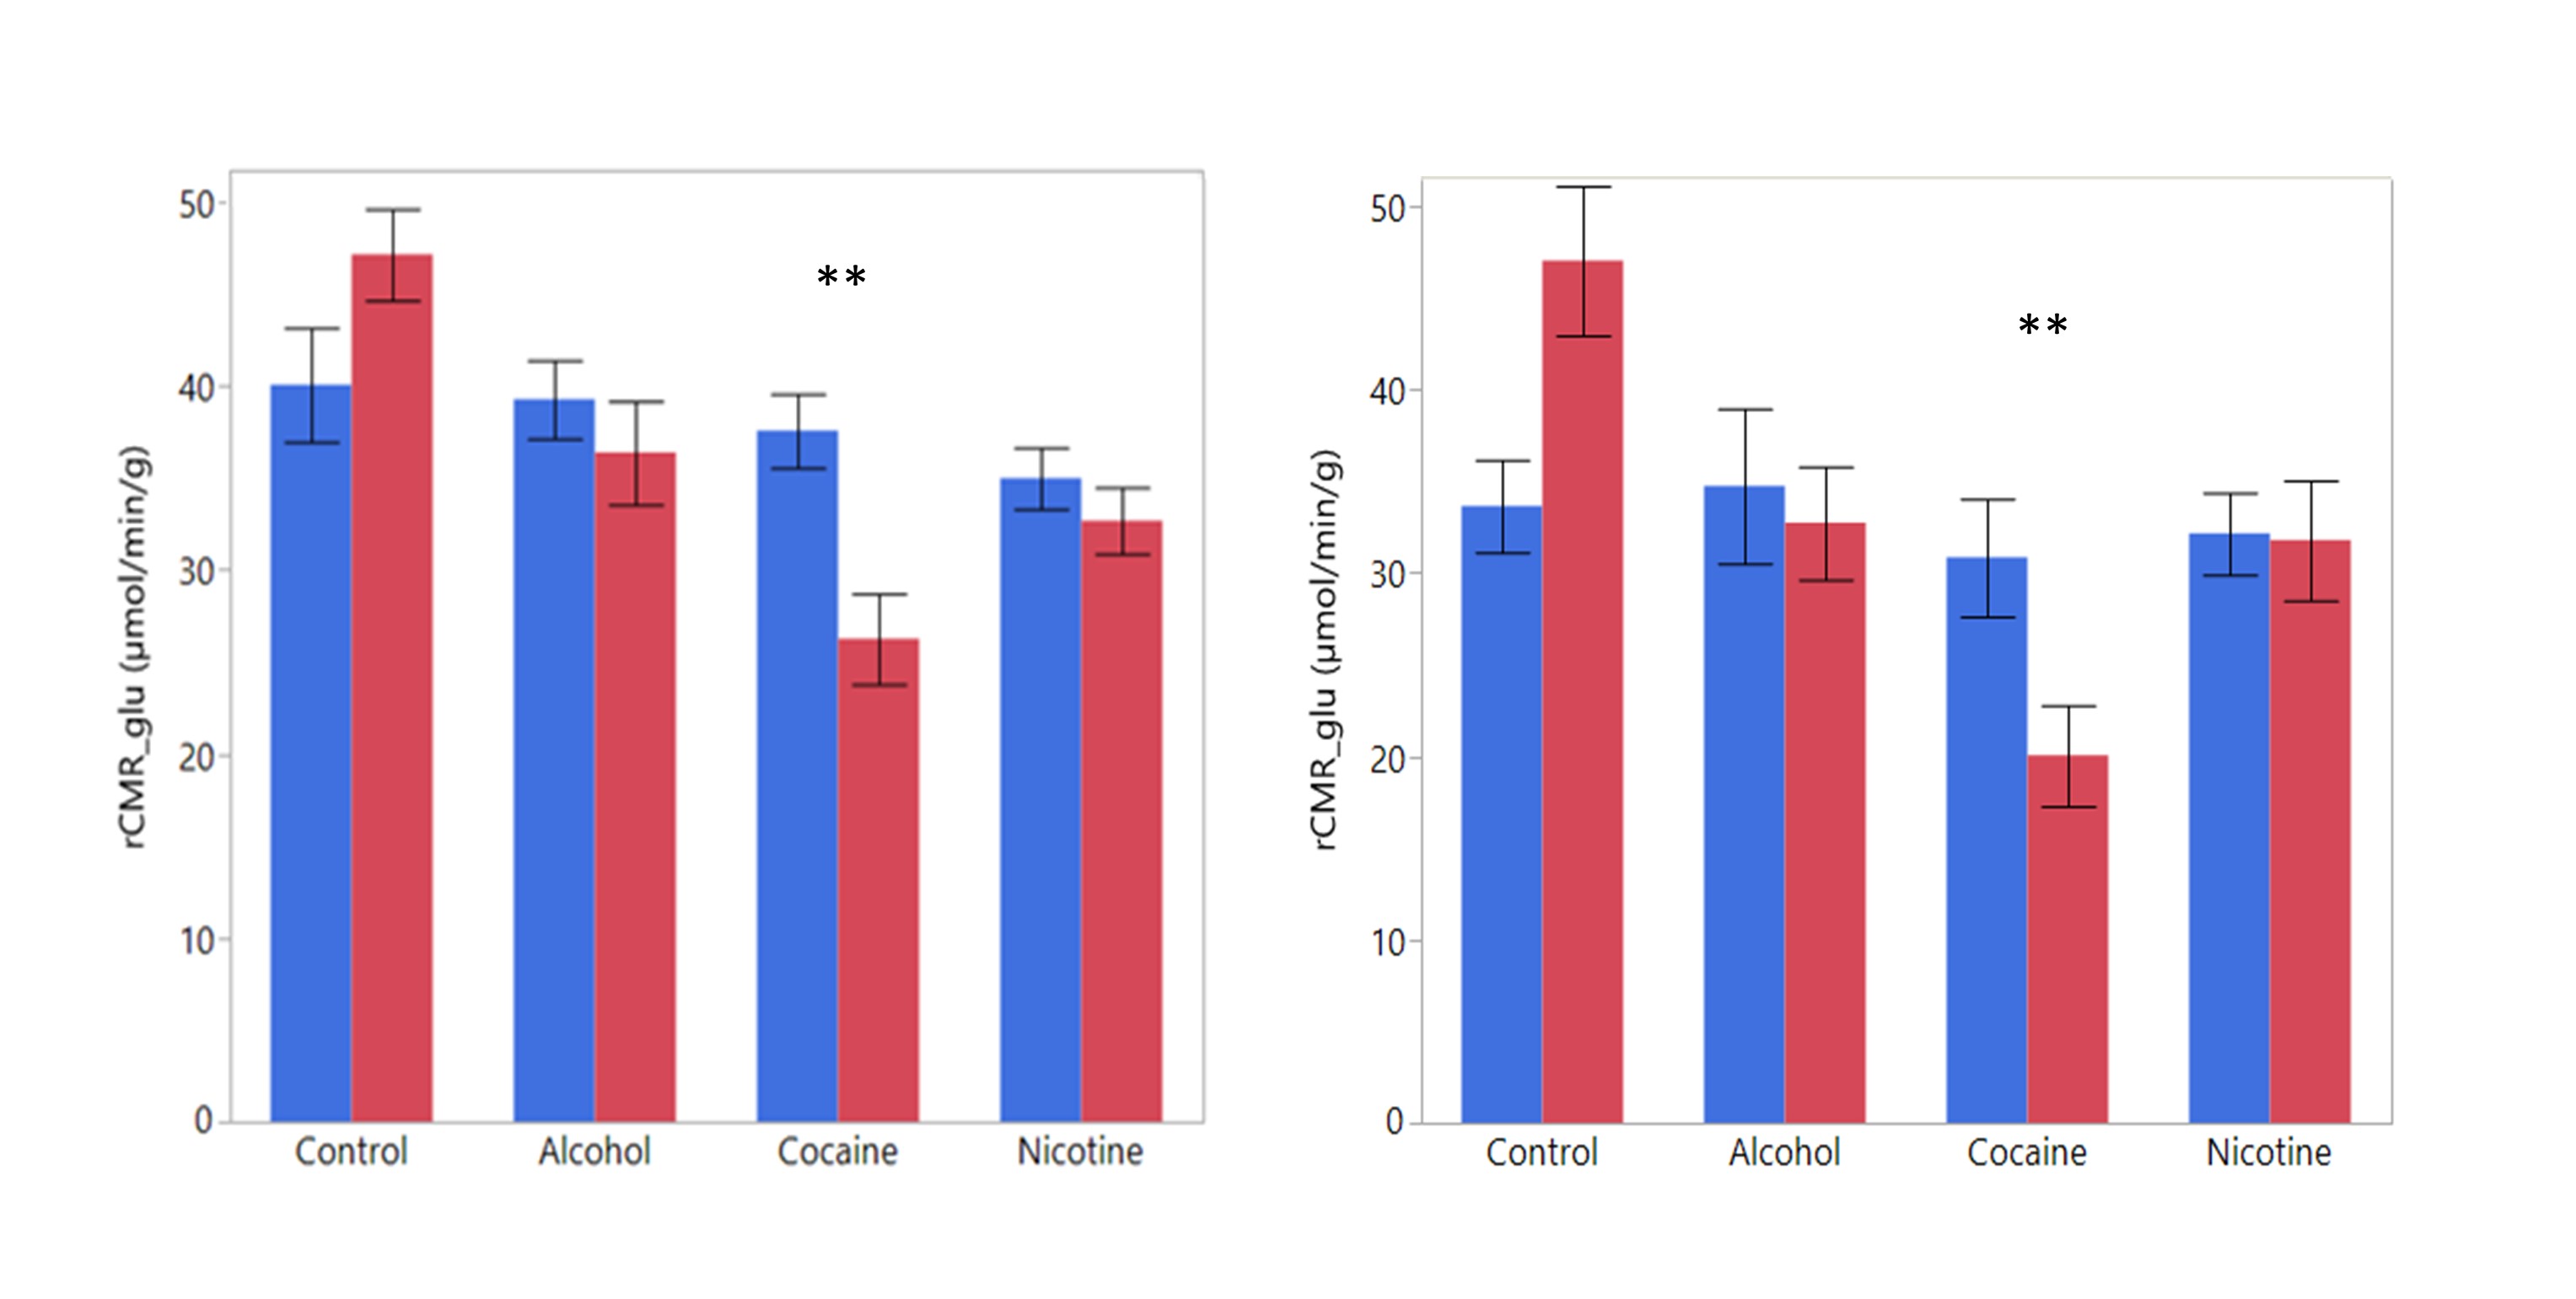
It has been reported that intravenous administrations of nicotine, cocaine, and alcohol reduce the regional cerebral metabolic rate of glucose (rCMRGlu). A proposed common mechanism is that drugs of abuse would induce an acute reduction in cerebral glutamate concentration. Next to its depolarizing effect on neurons, glutamate has been shown to induce glycolysis in astrocytes.1 In Humans, the typical 30 min uptake period of a 18FDG PET scan is long relative to the acute subjective effect of intravenous drugs of abuse.2 This issue has been addressed with protocols that utilize a continuous 18FDG infusion.3-5 In parallel, dynamic 1H-MRS protocols have been established to acquire data with high temporal resolution, e.g. 1 min, and have been applied to study changes in muscle and brain metabolism.6,7 We hypothesized that an important glutamate release, induced by drugs of abuse, will result in a temporary depletion of glutamate with the concurrent decrease in glucose metabolism, as measured in previous PET studies. Therefore, we conducted a study in which continuous 18FDG PET and dynamic 1H-MRS are simultaneously acquired from rats, before and after they received a dose of intravenous alcohol, cocaine, or nicotine.Methods
Male Wistar rats were subjected to a 50 min simultaneous PET-MR scan using a Bruker Biospec 70/30 MR scanner with an Albeira SiPM-based PET insert (Bruker Biospin, Ettlingen, Germany). After 25 min, animals received an intravenously administered solution (0.5 mL) containing either ethanol (400 mg/kg), cocaine (2.5 mg/kg), nicotine (0.3 mg/kg) or saline. Small-animal PET imaging was performed while continuously infusing 31.6 ± 4.0 MBq 18FDG into the tail vein. List-mode acquisition data were reconstructed to 50 frames of one min and co-registered to an in-house atlas. Patlak plots were generated to estimate the mean rCMRGlc using the time-activity curves of the whiskers area of the rat muzzle as reference region.8 Slopes obtained from the Patlak plot were corrected for measured glycemia and the lumped constant was set to 0.625.
Magnetic resonance was performed using a 7T Bruker preclinical PET-MR scanner. A 1H-MRS voxel of 2.5 mm3 was placed in the prefrontal cortex. A point resolved spectroscopy (PRESS) pulse sequence (TR = 2000 ms, TE = 20 ms, 30 averages and 50 repetitions) was used to obtain 50 separate spectra, each taking one minute and three seconds to acquire. Spectra were processed with the jMRUI software, and quantification with the QUEST algorithm.9 The difference between measurements before and after the challenge injection were assessed using a linear mixed model, which included a random effect per animal.
Results
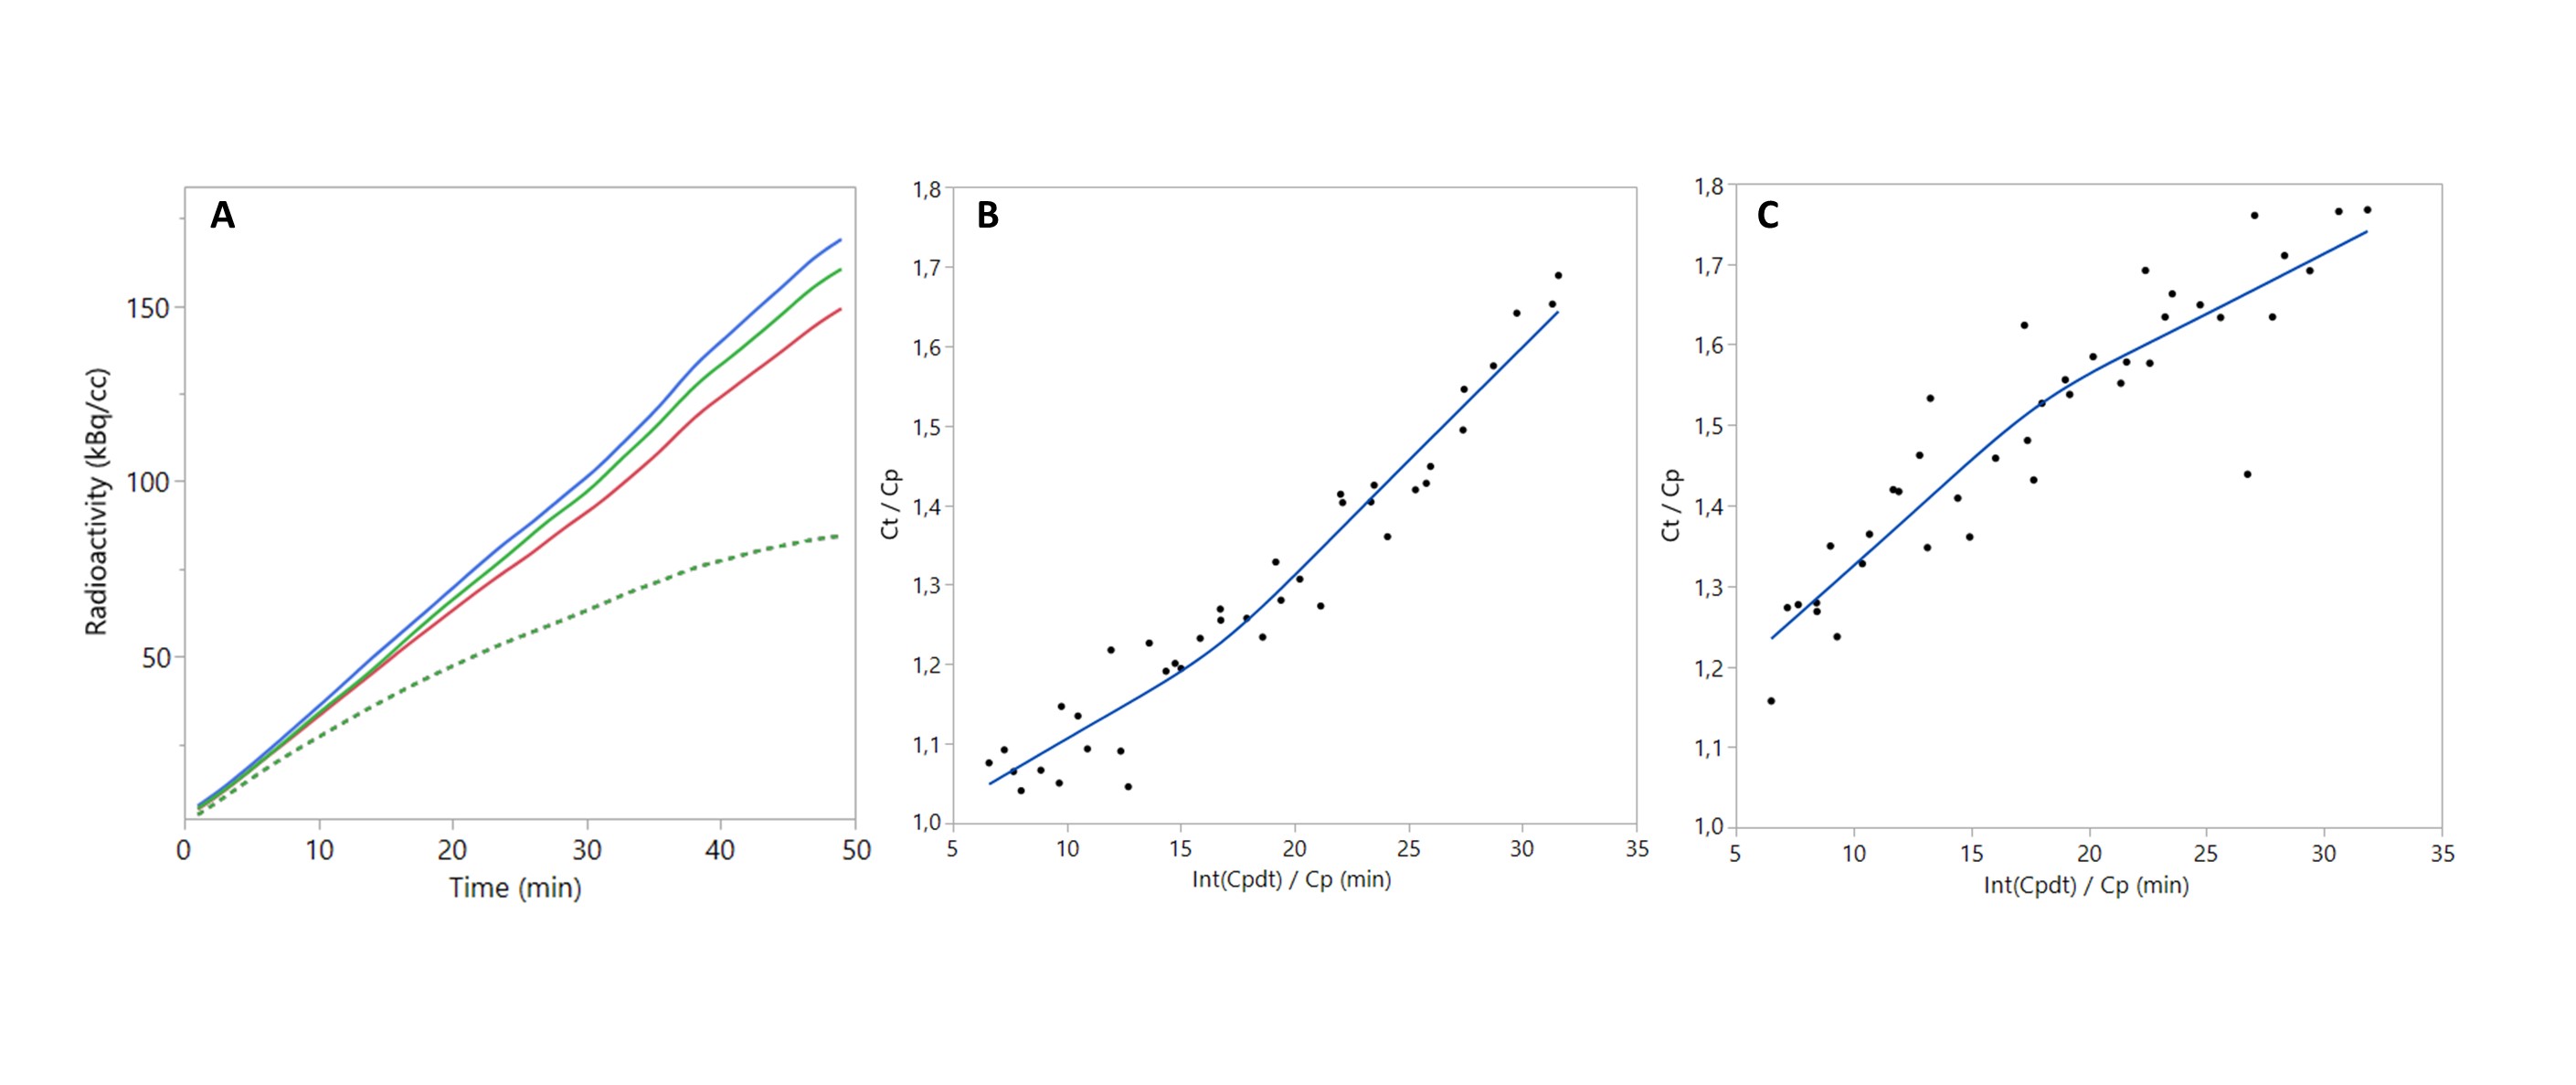
Animals showed a time-activity curve in the brain and blood consistent with previous reports (Figure 1).4 Linear spline regression was performed on the obtained Patlak plot for each animal, and the resulting slope was used to estimate the rCMRGlu. The average baseline rCMRGlu were similar to the previously reported rCMRGlu of anesthetized rats, e.g. 27 ± 9 µmol/min/g in the prefrontal cortex and 34 ± 12 µmol/min/g in the striatum.5
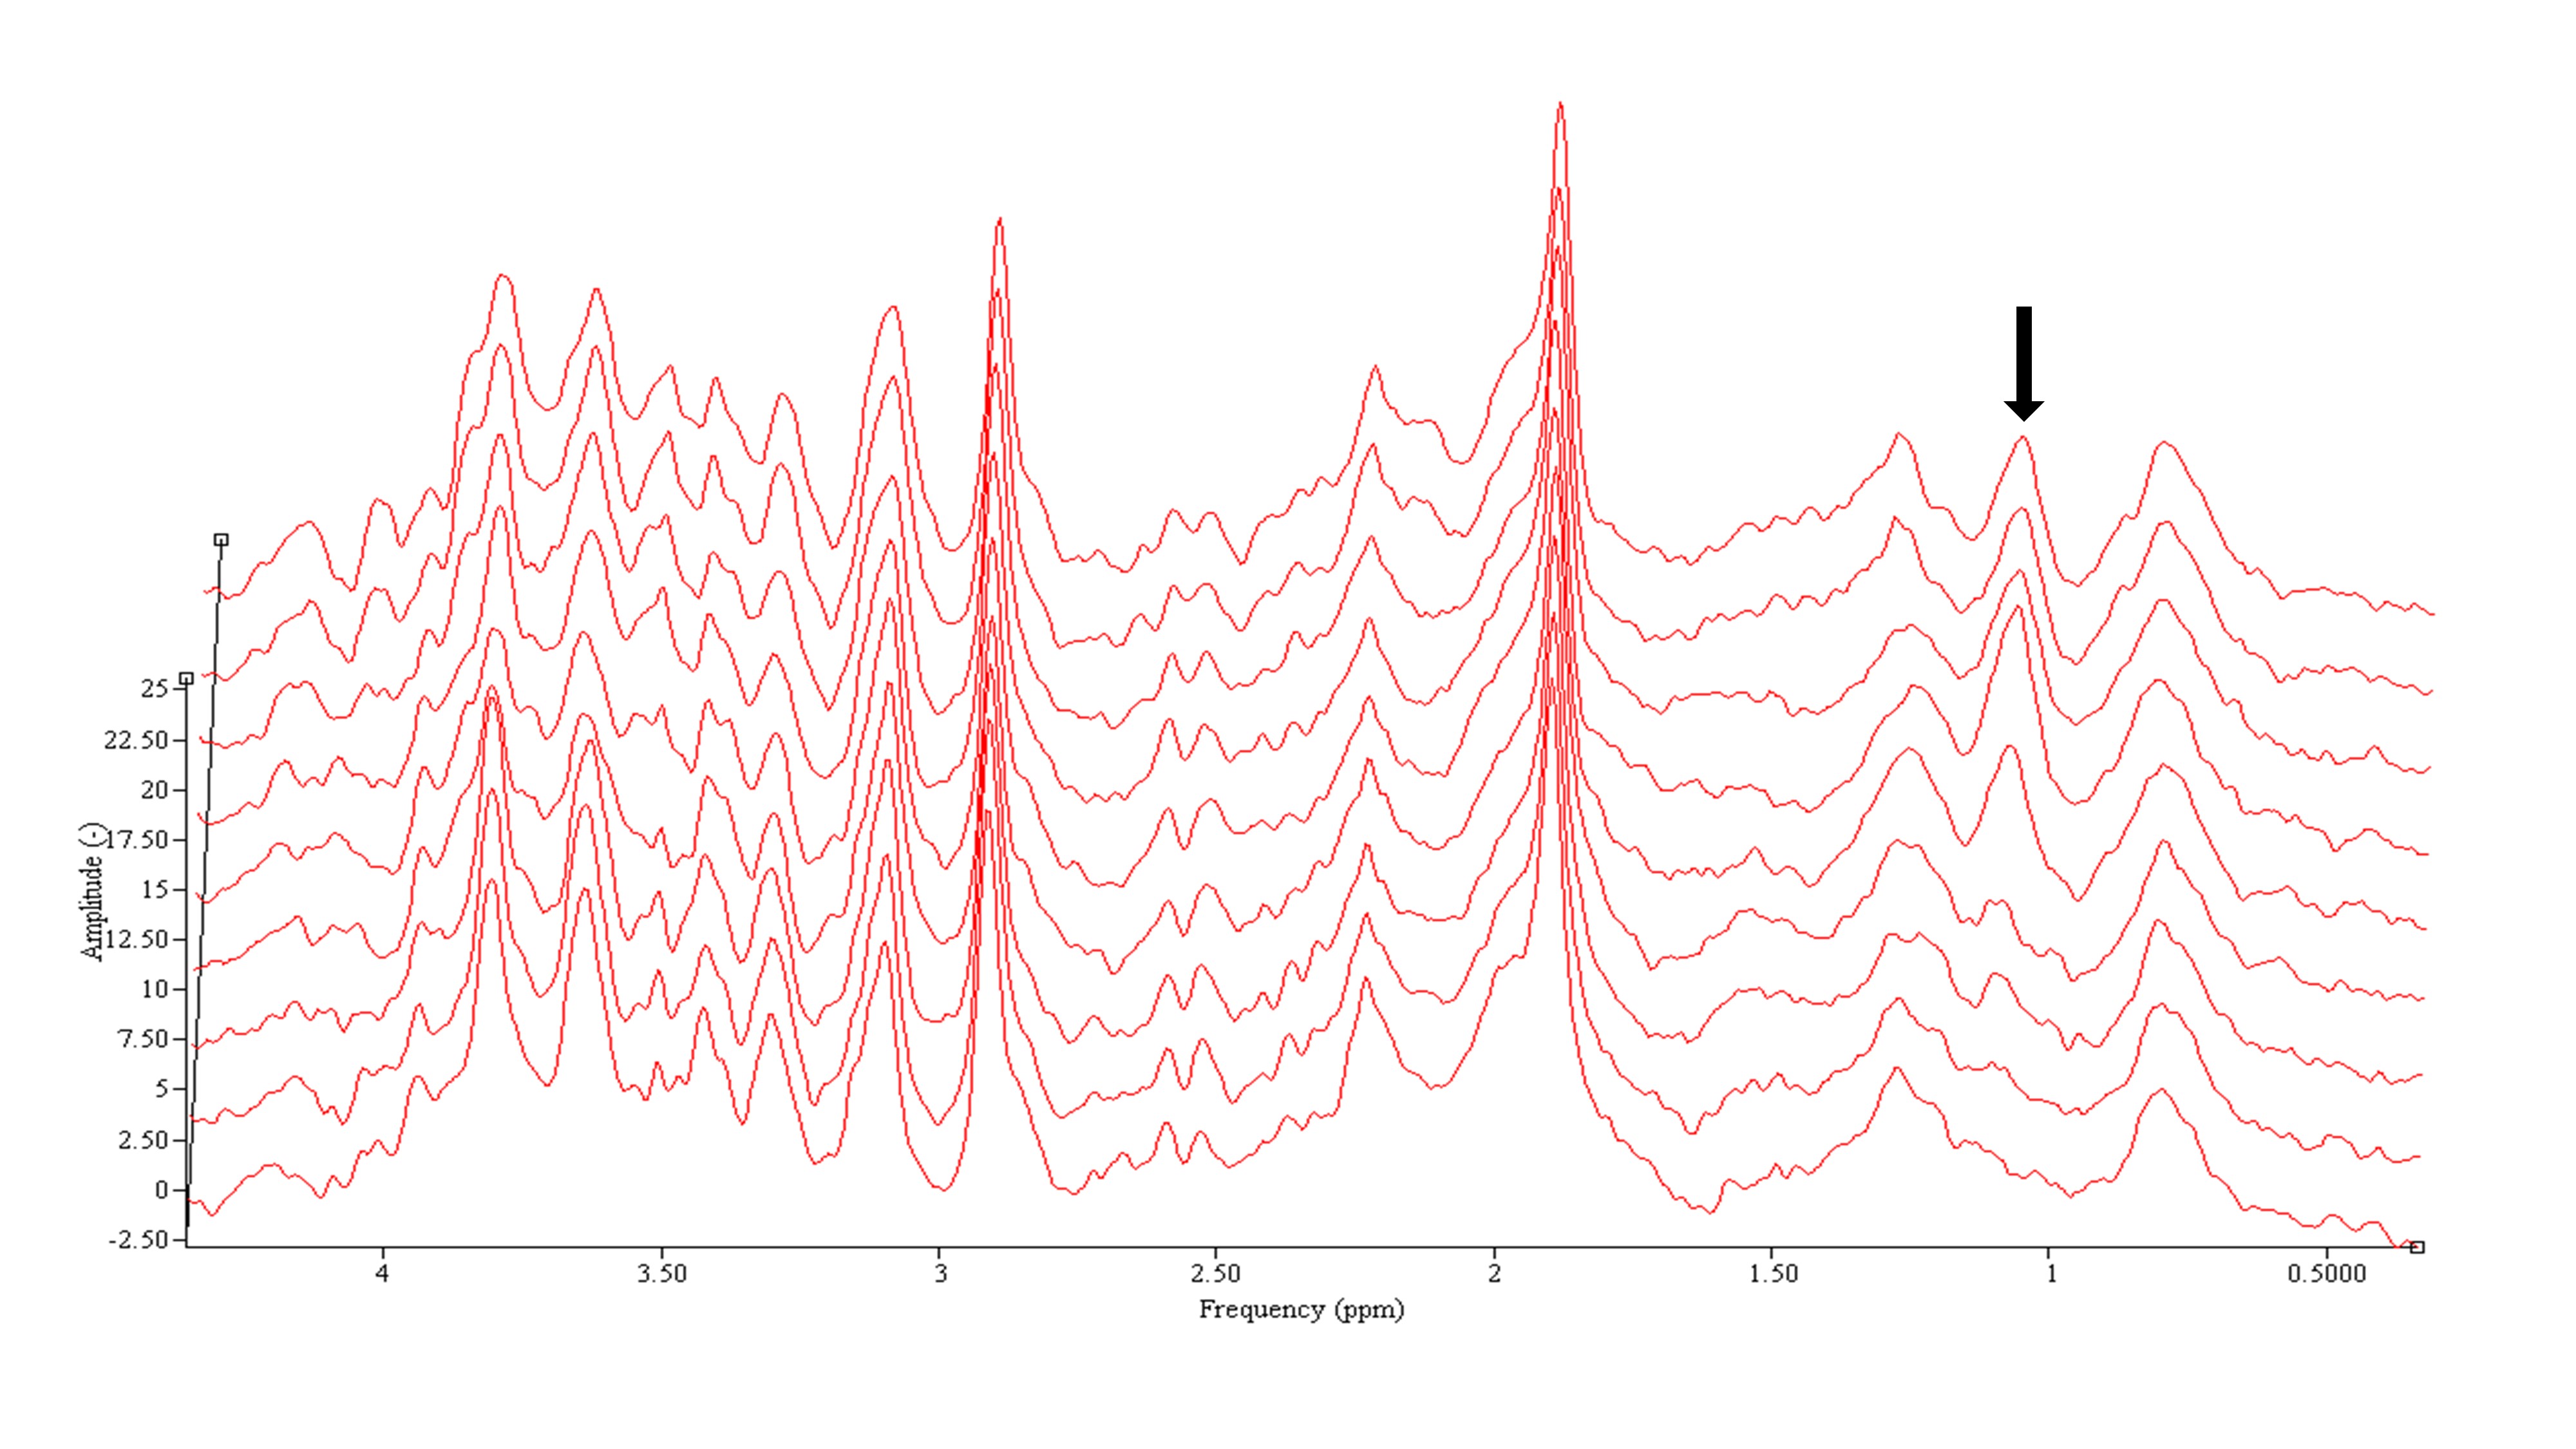
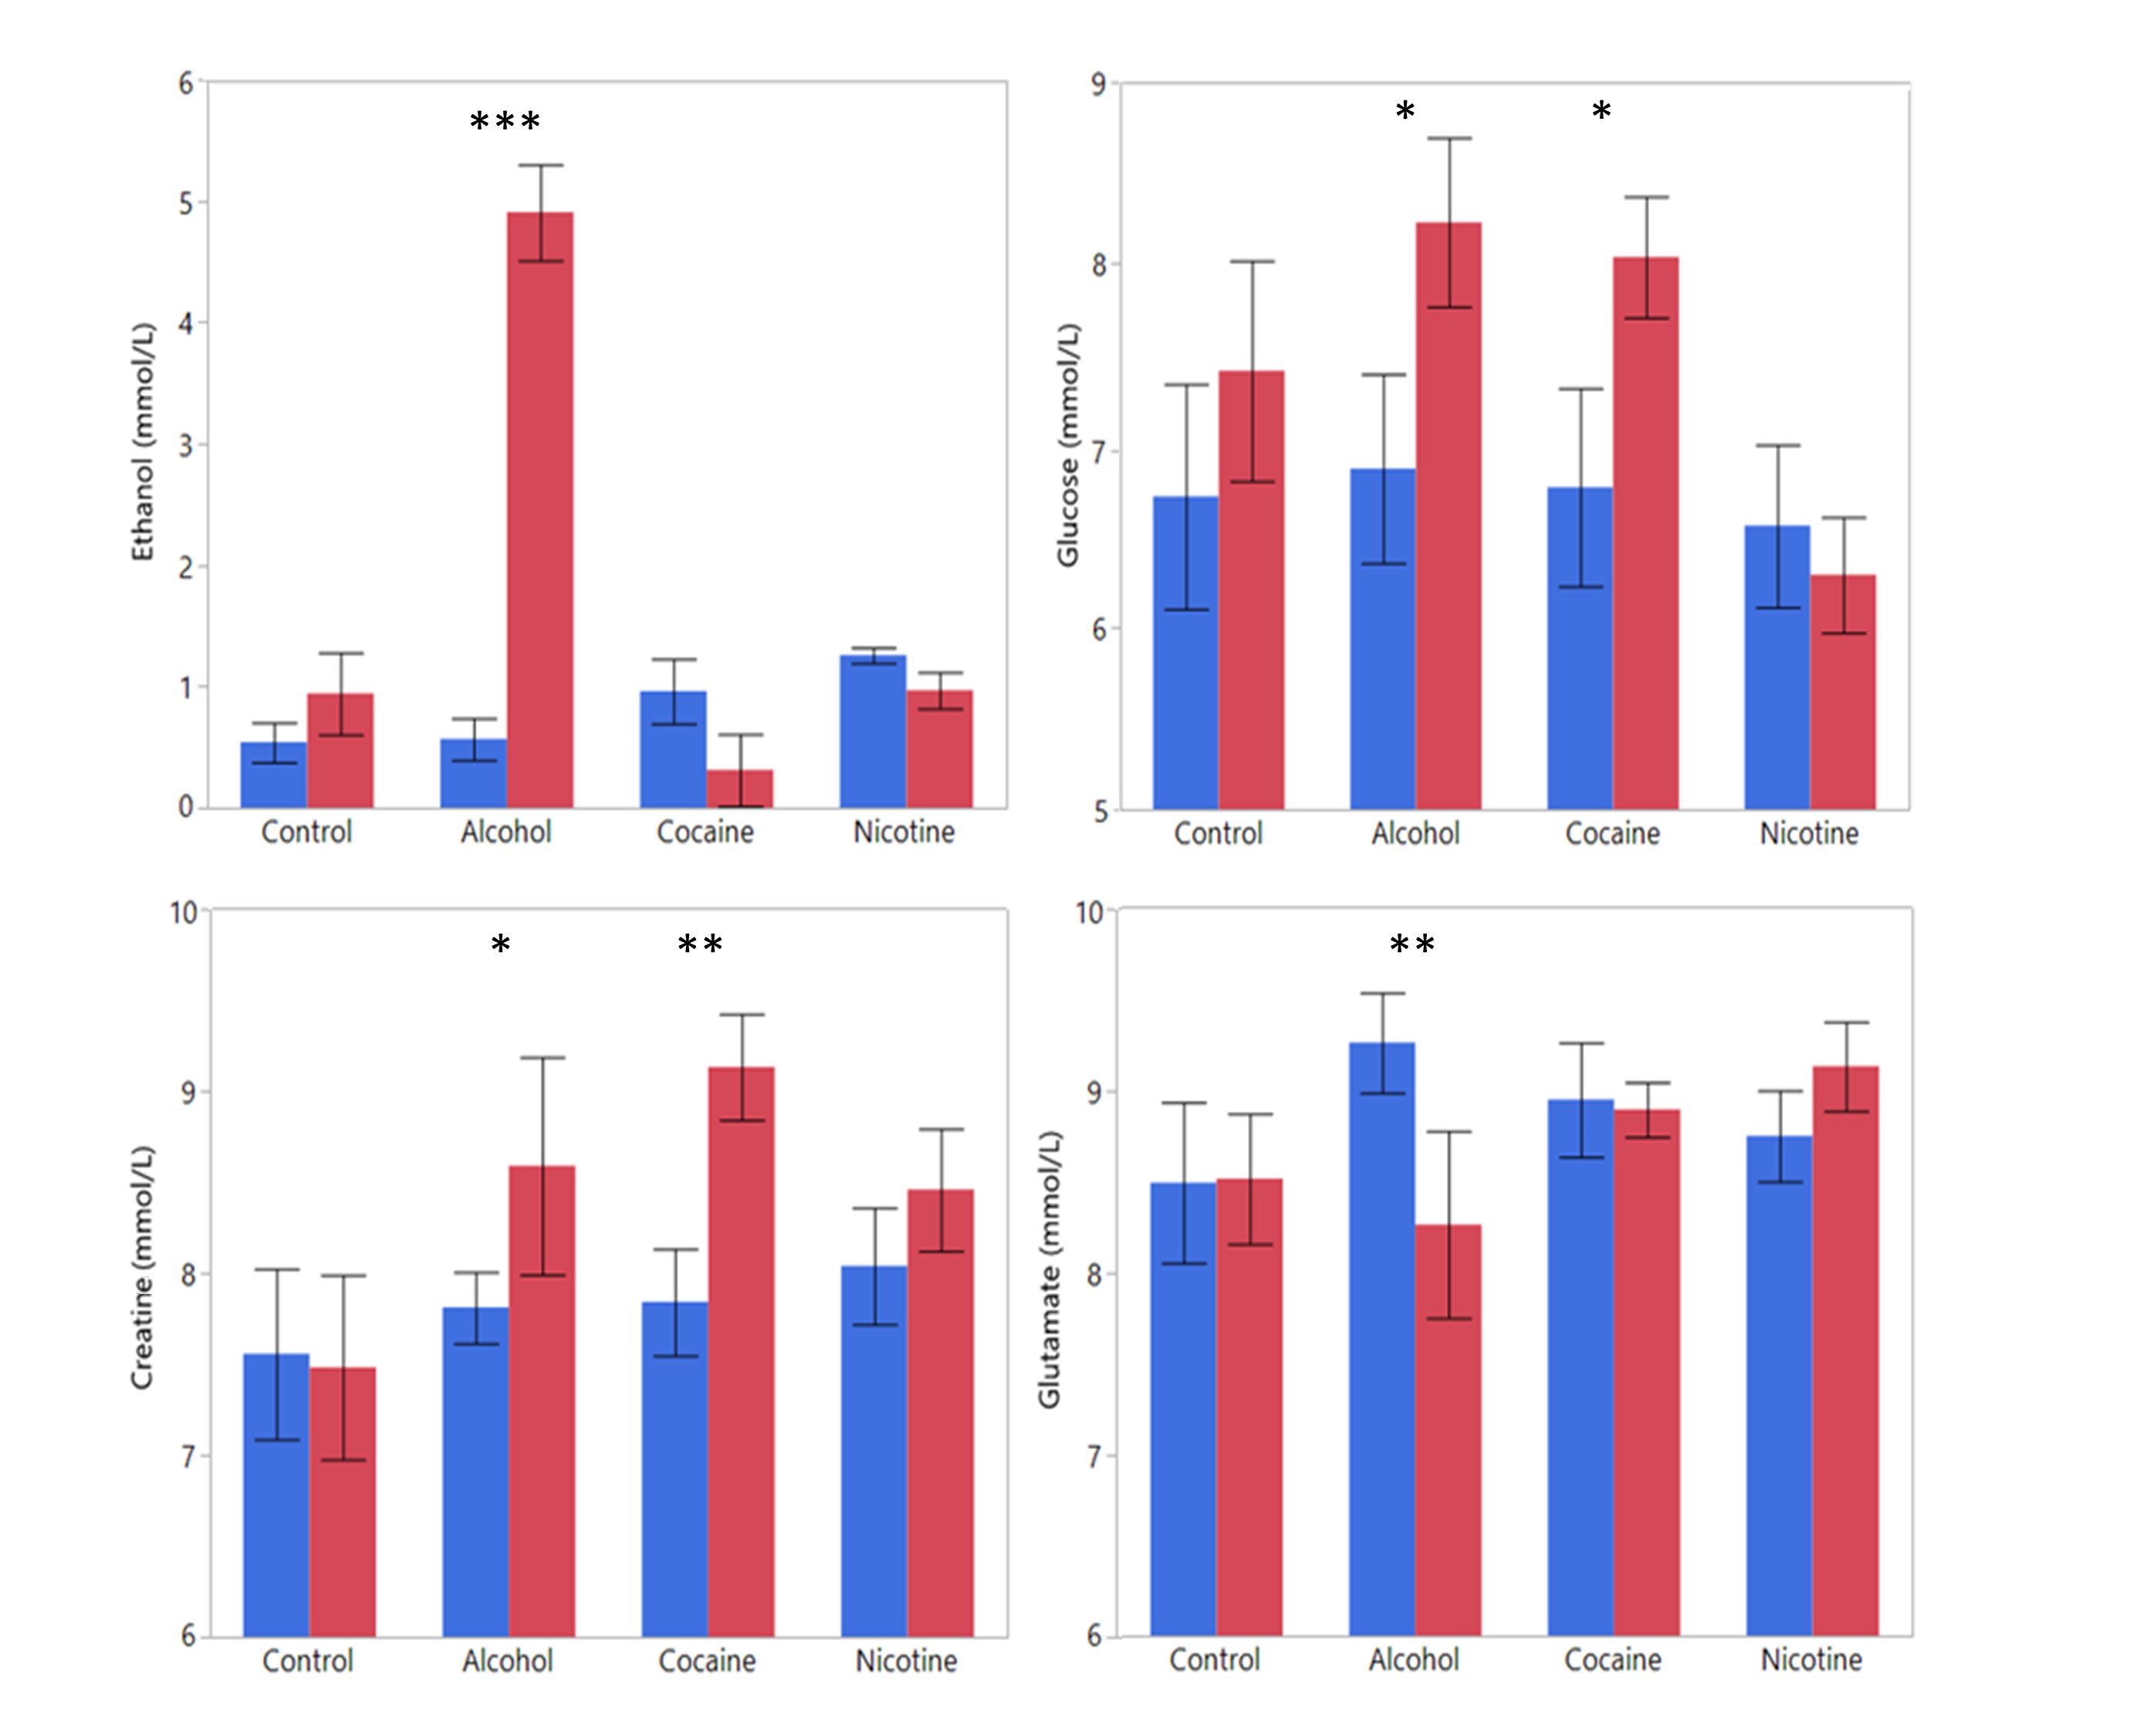
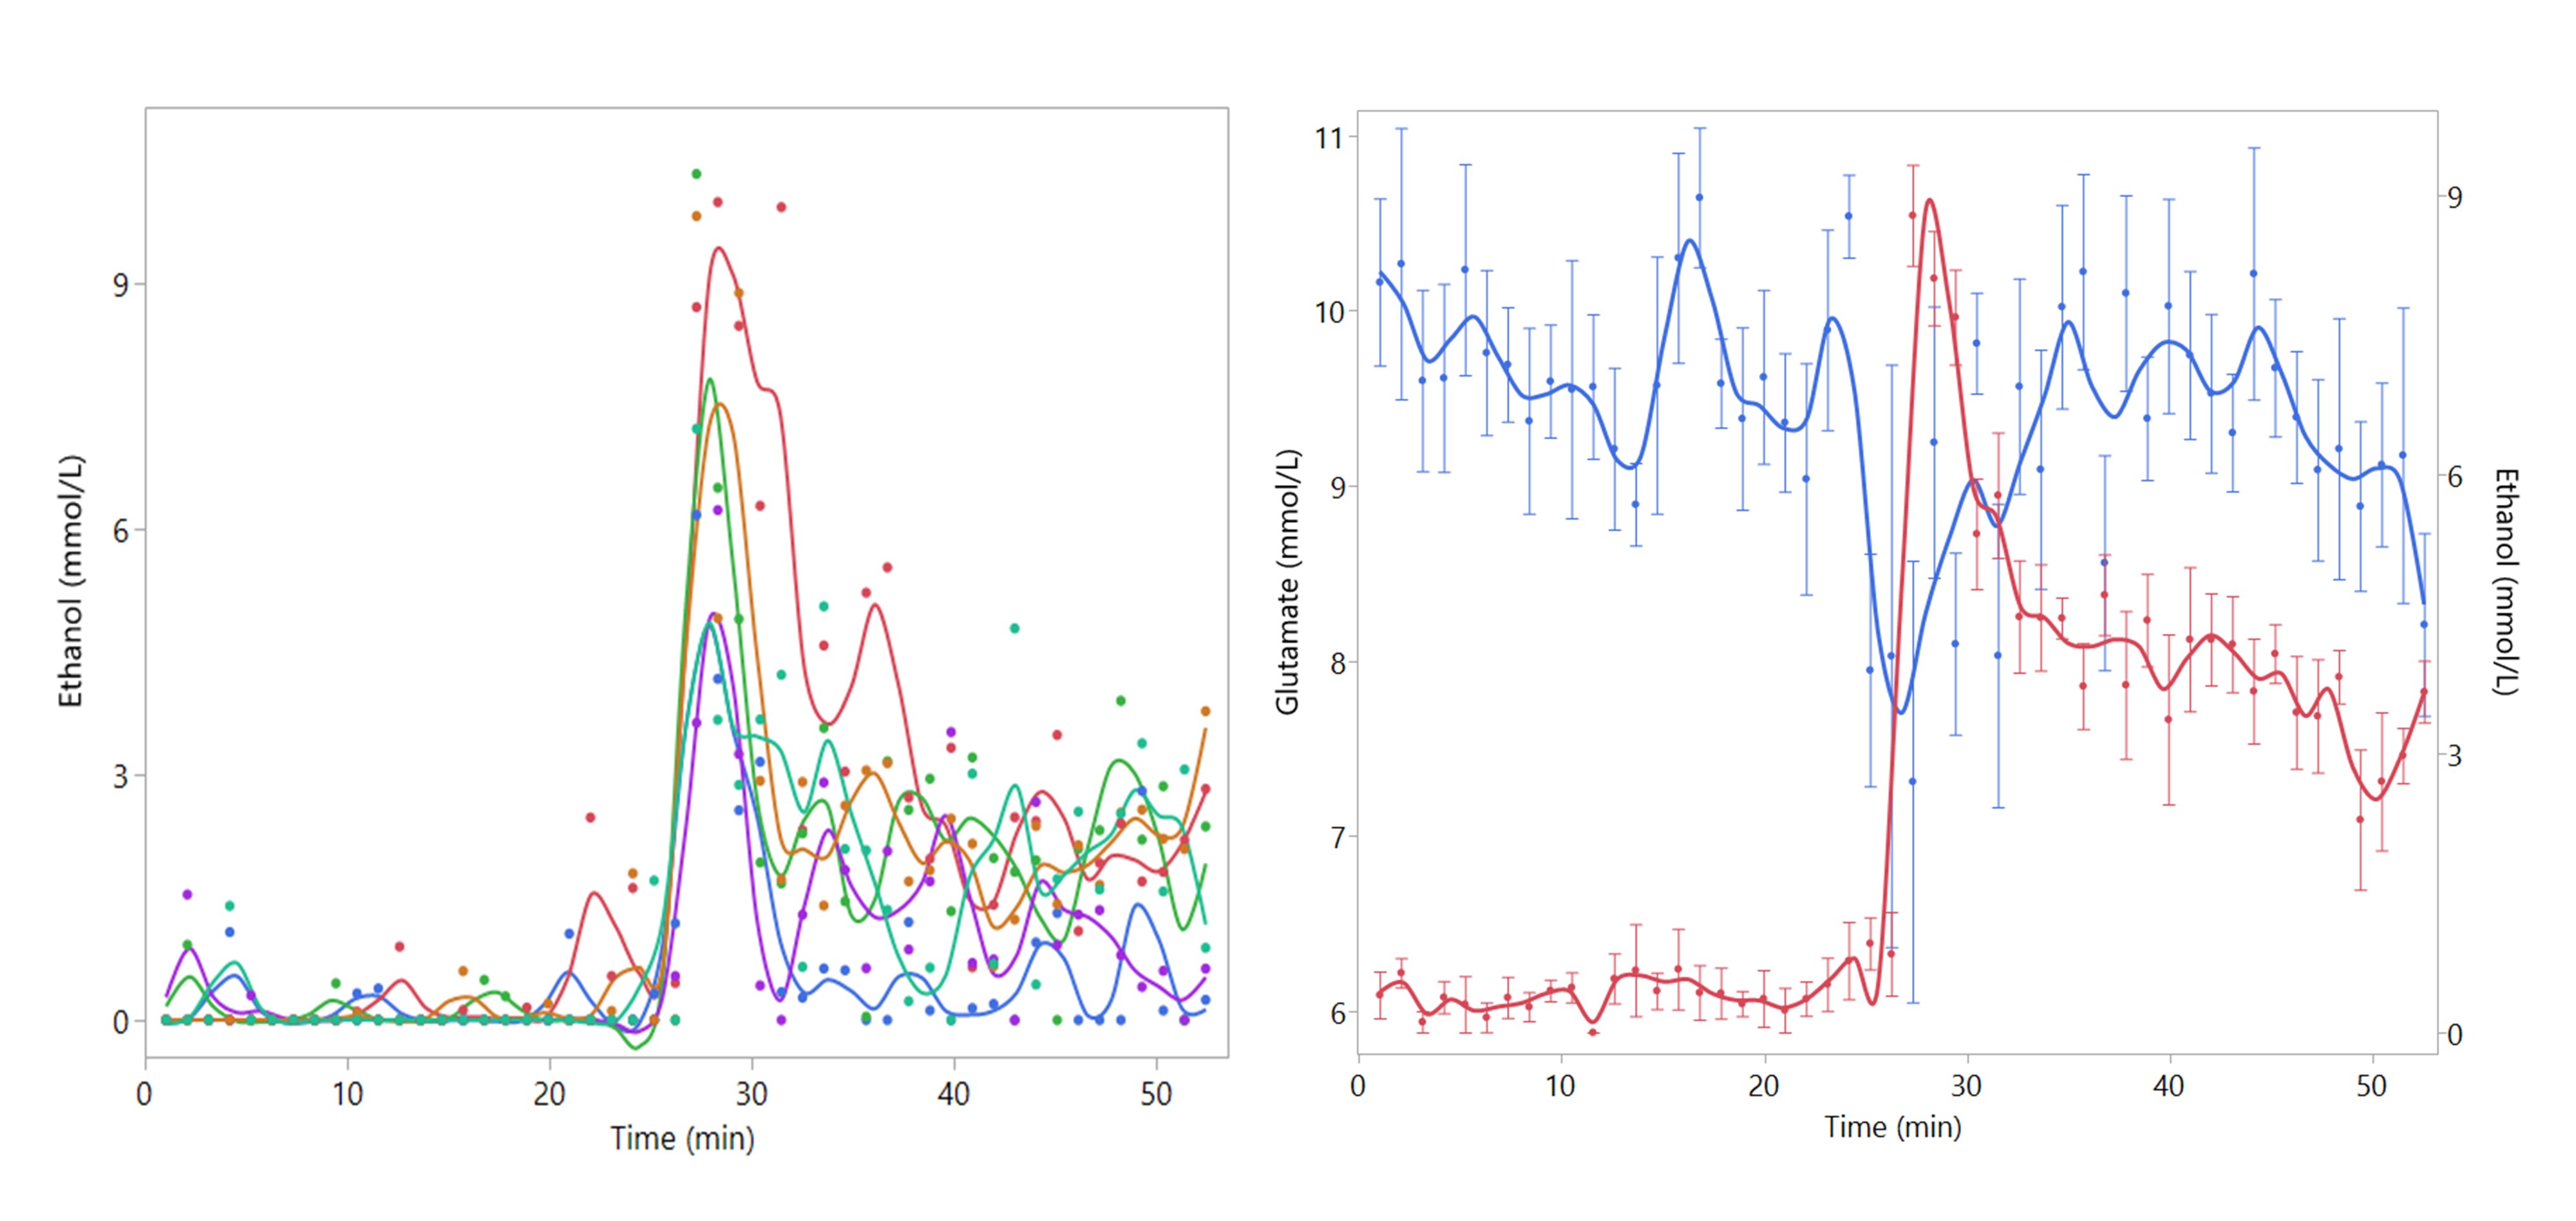
An example of the acquired dynamic 1H-MRS spectra can be found in Figure 3. All measured metabolites were found to be in previously reported ranges for healthy rats.10 Glucose, creatine, ethanol, and glutamate were found to be significantly different before and after the injection (Figure 4). To fully exploit the one-minute temporal resolution of the dynamic MRS data, we visually inspected how every metabolite behaved after the injection of each drug. No distinct patterns were found for any drug, except for the alcohol administration (Figure 5).
Discussion
Dynamic MRS showed a decrease of prefrontal glucose in the nicotine group. This might be explained by the increased uptake of 18FDG in adipose tissue after acute nicotine exposure.11 Ethanol was observed to rise rapidly after injection, this highlights the benefits of dynamic 1H-MRS. In addition, using dynamic 1H-MRS we demonstrated that prefrontal glutamate transiently decreased immediately after the alcohol administration. A major degradation of glutamate, such as suggested by our data, would reduce the metabolic activity of both neurons and astrocytes, thus decreasing the rCMRGlu as reported before.1Conclusion
We show that continuous 18FDG infusion PET and dynamic 1H-MRS are well suited to study the acute effects of pharmacological challenges. Our results suggest that the reduction in rCMRGlu, which is observed in humans after IV injection of alcohol, could be caused by a decrease in glutamate. These preliminary results warrant further investigation to support a potential dose-dependent effect of alcohol and nicotine that could lead to significant rCMRGlu as we report here for cocaine.Acknowledgements
No acknowledgement found.References
1. Pellerin L, Magistretti PJ. Glutamate uptake into astrocytes stimulates aerobic glycolysis: a mechanism coupling neuronal activity to glucose utilization. Proceedings of the National Academy of Sciences. 1994;91(22):10625-10629.
2. Stapleton JM, Gilson SF, Wong DF, et al. Intravenous nicotine reduces cerebral glucose metabolism: a preliminary study. Neuropsychopharmacology. 2003;28(4):765-772.
3. Villien M, Wey HY, Mandeville JB, et al. Dynamic functional imaging of brain glucose utilization using fPET-FDG. Neuroimage. 2014;100:192-199.
4. Hahn A, Gryglewski G, Nics L, et al. Quantification of Task-Specific Glucose Metabolism with Constant Infusion of 18F-FDG. J Nucl Med. 2016;57(12):1933-1940.
5. Watabe T, Amend M, Thielcke A, Hatazawa J, Pichler B, Wehrl H. Constant infusion of 18F-FDG can detect changes in cerebral metabolic rate of glucose during multiple stimulations in a single scan: A quantitative PET study in rats. J Nucl Med. 2016;57(S2):1.
6. Prompers JJ, Jeneson JA, Drost MR, Oomens CC, Strijkers GJ, Nicolay K. Dynamic MRS and MRI of skeletal muscle function and biomechanics. NMR Biomed. 2006;19(7):927-953.
7. Kuhn S, Schubert F, Mekle R, et al. Neurotransmitter changes during interference task in anterior cingulate cortex: evidence from fMRI-guided functional MRS at 3 T. Brain Struct Funct. 2016;221(5):2541-2551.
8. Backes H, Walberer M, Endepols H, et al. Whiskers area as extracerebral reference tissue for quantifcation of rat brain metabolism using 18F-FDG PET: Application to focal cerebral ischemia. J Nucl Med. 2011;52:8.
9. Stefan D, Cesare FD, Andrasescu A, et al. Quantitation of magnetic resonance spectroscopy signals: the jMRUI software package. Measurement Science and Technology. 2009;20(10):104035.
10. Pfeuffer J, Tkác I, Provencher SW, Gruetter R. Toward an in Vivo neurochemical profile: Quantification of 18 metabolites in Short-Echo-Time 1H-NMR spectra of the rat brain. Journal of Magnetic Resonance. 1999;141:16.
11. Baba S, Tatsumi M, Ishimori T, Lilien DL, Engles JM, Wahl RL. Effect of nicotine and ephedrine on the accumulation of 18F-FDG in brown adipose tissue. J Nucl Med. 2007;48(6):981-986.
Figures