3158
Optimizing Brain MR Elastography with Multiple Motion Encoding Gradient CyclesYuan Le1, Kevin Glaser2, Matthew Murphy2, Yuxiang Zhou3, Jun Chen2, William Pavlicek1, Joseph M. Hoxworth3, Bradley D. Bolster Jr.4, John Huston III.2, Joel P. Felmlee2, and Richard L. Ehman2
1Radiology, Mayo Clinic Arizona, Scottsdale, AZ, United States, 2Radiology, Mayo Clinic, Rochester, MN, United States, 3Radiology, Mayo Clinic Arizona, Phoenix, AZ, United States, 4Siemens Medical Solutions USA, Inc., Salt Lake City, UT, United States
Synopsis
A spin-echo EPI MR Elastography sequence was optimized so that multiple motion encoding gradient (MEG) cycles can be added to increase the motion sensitivity. Volunteer tests showed that comparing with the original one MEG version, optimized two or three MEG cycles provided higher Octahedral Shear Strain Signal-to-Noise Ratio (OSS-SNR), which means higher stiffness measurement precision. Global brain Images acquired with 2 and 3 MEG cycles are in most cases comparable in stiffness and OSS-SNR while images with 1 MEG tend to have a slightly lower OSS-SNR.
Introduction
Given the fact that brain cannot be easily palpated, there is a great interest in studying the brain mechanical properties using MR Elastography (MRE)1 in diseases such as Alzheimer’s, concussion/chronic traumatic encephalopathy, Parkinson’s disease, meningioma, intracranial pressure 1-5. The motion encoding gradients (MEG) in MRE are designed to be sensitive to periodic motion. An increase of MEG cycle numbers increases the motion sensitivity which enables the use of lower motion amplitude and less patient discomfort. On the other hand, the increase of MEG cycles requires longer TE, which decreases the signal level and in turn has an impact on the motion detection. The purpose of this study is to develop a modified spin-echo EPI MRE so that the number of MEG cycles can be optimized for brain MRE applications.Materials and Methods
Figure 1 shows the spin-echo-EPI MRE pulse sequence with three MEG cycles (2 MEG cycles before the 180o refocusing RF pulse and 1 after the refocusing RF). There was a gap with the length of half the MEG cycle in between (where we have the refocusing RF). Four healthy volunteers were imaged for this study after obtained written informed consent. All images were acquired on a clinical 3T MRI scanner (Prisma, Siemens Healthineers, Erlangen, Germany) with a 20 channel head coil. The MRE driver setting was the same as in previous studies3, 6. The scan parameters were: · With 1 MEG: TR/TE=4800/46 ms; · With 2 MEG: TR/TE=4800/58 ms; · With 3 MEG: TR/TE=6400/87 ms. For all images FOV=240 mm, matrix size=72x72, bandwidth=1984 Hz/pixel. The frequency of the motion was 60 Hz. GRAPPA factor=3. Slice thickness=3mm. 3D motion encoding was applied. The stiffness and the octahedral shear strain-based measure of SNR7 was estimated and compared.Results
Figure 2 shows the magnitude image, stiffness map, and the OSS-SNR maps of the center slice from one of the volunteers. With the increase TE, and the magnitude image became more T2 weighted (the signal magnitude decreased) and showed more distortion and susceptibility artifact. On the other hand, the motion sensitivity increased and the stiffness map looked better defined. The OSS-SNR maps showed a larger region of high OSS-SNR in the image slice with more MEG cycles. Interestingly the OSS-SNR decreased in the high OSS-SNR area when the MEG cycles increased from 2 to 3. Figure 3 shows that the median stiffness measured with all three settings were very close. Figure 4 shows that the OSS-SNR values of the 2 MEG and 3 MEG images were very close, and usually higher in 2 MEG images except in volunteer 2. Table 1 listed the average OSS-SNR in these volunteers and also demonstrated that the OSS-SNR was usually the highest with 2 MEG except in volunteer 2.Discussions
The images with 2 MEG cycles had a higher average OSS-SNR than those with 1 or 3 MEG cycles in 3 of 4 volunteers, indicating that under current brain MRE settings this combination (2 MEG cycles and a TE of 58 ms) provided a better balance in motion sensitivity and image signal amplitude. It was interesting that with 3 MEG cycles while in the center of the brain the OSS-SNR increased in some regions, the OSS-SNR at the edge of the brain, where the OSS-SNR was already relatively high with 1 or 2 MEGs, actually decreased. We considered this as an indication that with more MEG cycles and higher motion sensitivity, more phase wrapping in the phase images happened in those regions, which in turn required more complicated phase unwrapping algorithm and causes more error. Another factor that lowers the OSS-SNR is the signal intensity in the magnitude images decreased with the increased TE with 3 MEG cycles.Conclusions
The modified spin-echo EPI MR Elastography technique provided more flexibility in prescribing the sequence based on the need of the clinical application. Our results indicated that with the current MRE settings 2 MEG cycles may provide the best motion sensitivity. On the other hand, with 3 MEG cycles the longer TE provides images with more T2 effect. Therefore if a T2 weighted magnitude image is desirable 3 MEG cycles may be a better choice to get such images without sacrificing the motion sensitivity.Acknowledgements
No acknowledgement found.References
1. Litwiller, D.V., et al., Magnetic Resonance Elastography. Curr Med Imaging Rev, 2012. (8)(1): p. 46-55. 2. Murphy, M.C., et al., Measuring the characteristic topography of brain stiffness with magnetic resonance elastography. PLoS One, 2013. (8)(12): p. e81668. 3. Olivero, W.C., et al., Magnetic Resonance Elastography Demonstrating Low Brain Stiffness in a Patient with Low-Pressure Hydrocephalus: Case Report. Pediatr Neurosurg, 2016. (51)(5): p. 257-62. 4. Riek, K., et al., Magnetic resonance elastography reveals altered brain viscoelasticity in experimental autoimmune encephalomyelitis. Neuroimage Clin, 2012. (1)(1): p. 81-90. 5. Schregel, K., et al., Demyelination reduces brain parenchymal stiffness quantified in vivo by magnetic resonance elastography. Proc Natl Acad Sci U S A, 2012. (109)(17): p. 6650-5. 6. Arani, A., et al., Measuring the effects of aging and sex on regional brain stiffness with MR elastography in healthy older adults. Neuroimage, 2015. (111): p. 59-64. 7. McGarry, M.D., et al., An octahedral shear strain-based measure of SNR for 3D MR elastography. Phys Med Biol, 2011. (56)(13): p. N153-64.Figures
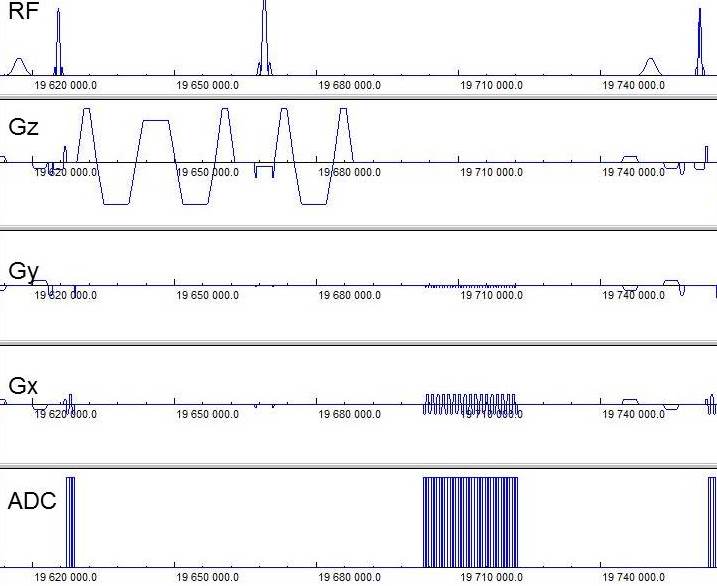
Figure 1. The modified
spin-echo EPI pulse sequence with 2 MEG cycles before the refocusing RF and 1
after.
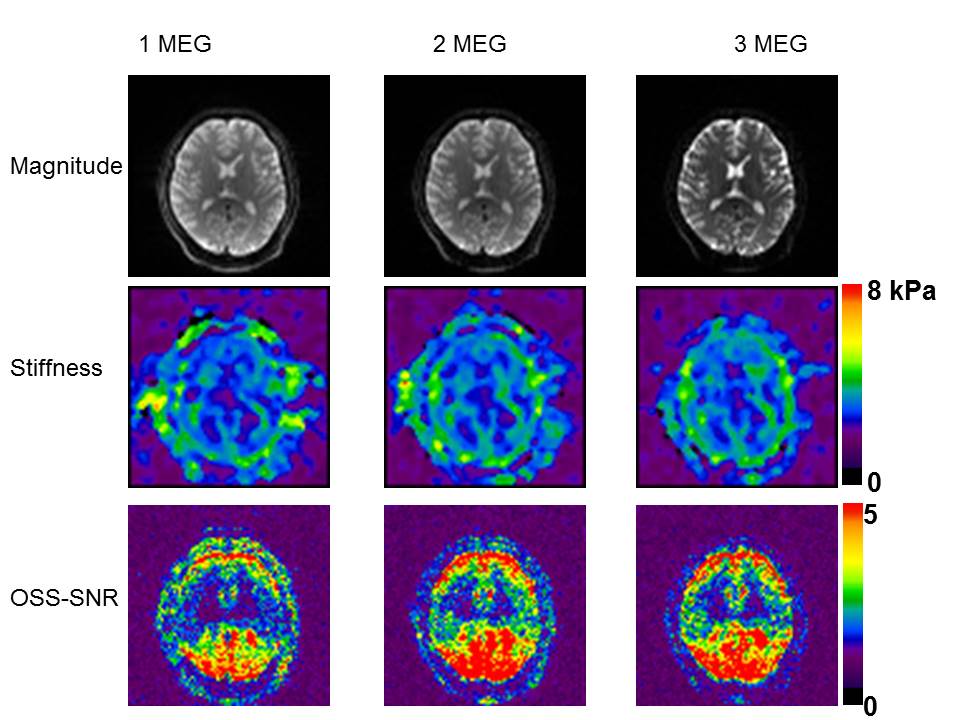
Figure 2. Magnitude images, stiffness maps and
OSS-SNR maps from the center slice of one of the volunteer’s images.
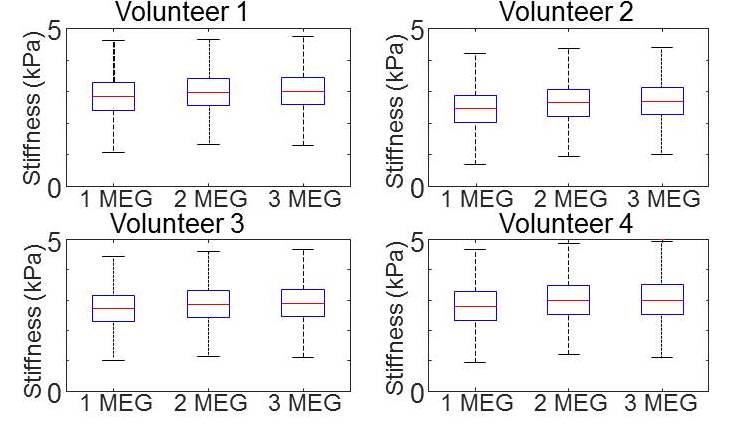
Figure 3. Stiffness distribution plots in the
whole brain indicated that the average stiffness values are very close using 1,
2 or 3 MEG cycles.
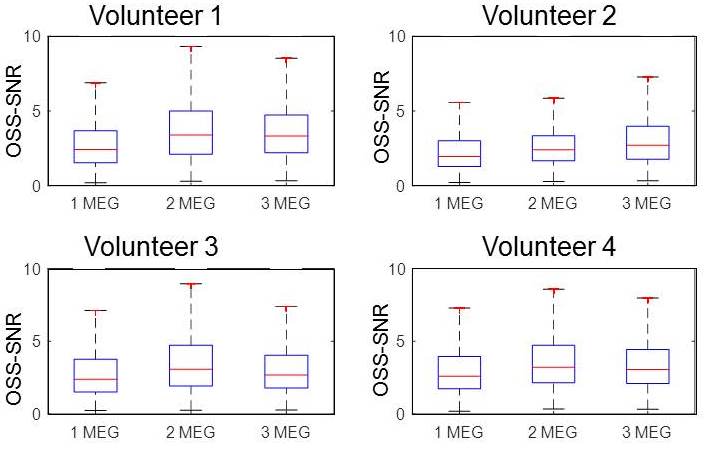
Figure 4. OSS-SNR
distribution. Images with 2 MEG cycles provides higher OSS-SNR in 3 of the 4
volunteers.
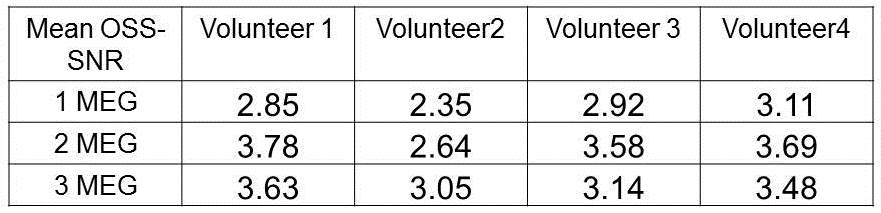
Table 1. Average OSS-SNR in
the whole brain was higher with 2 MEG cycles in 3 of the 4 volunteers.