3157
Longitudinal Change in the Developmental Rat Brain using in vivo Glutamate Chemical Exchange Saturation Transfer1Graduate School, Ulsan University, Seoul, Republic of Korea, 2Department of Convergence Medicine, Asan Medical Center, Seoul, Republic of Korea, 3Department of Radiology, Asan Medical Center, Seoul, Republic of Korea
Synopsis
Our study results and analyses show the trend in glutamate concentration and the decreases in T2 and ADC values influenced by myelination, neuronal change, and the water and macromolecule content of the developing rat brain, and also provide evidence indicating the time point where a neurochemical balance is achieved. Our results demonstrating changes in glutamate concentration up to the eighth postnatal week should provide valuable reference data for other studies of the developing healthy rat brain, and should be
INTRODUCTION
Chemical exchange saturation transfer (CEST) is a novel enhanced molecular imaging technique that indirectly monitors neurochemicals in millimolar (mM) concentrations. The concentration of glutamate changes during the brain’s developmental period and the CEST imaging technique is useful for measuring glutamate in the brain on the basis of the exchangeable protons in the amine group.METHODS
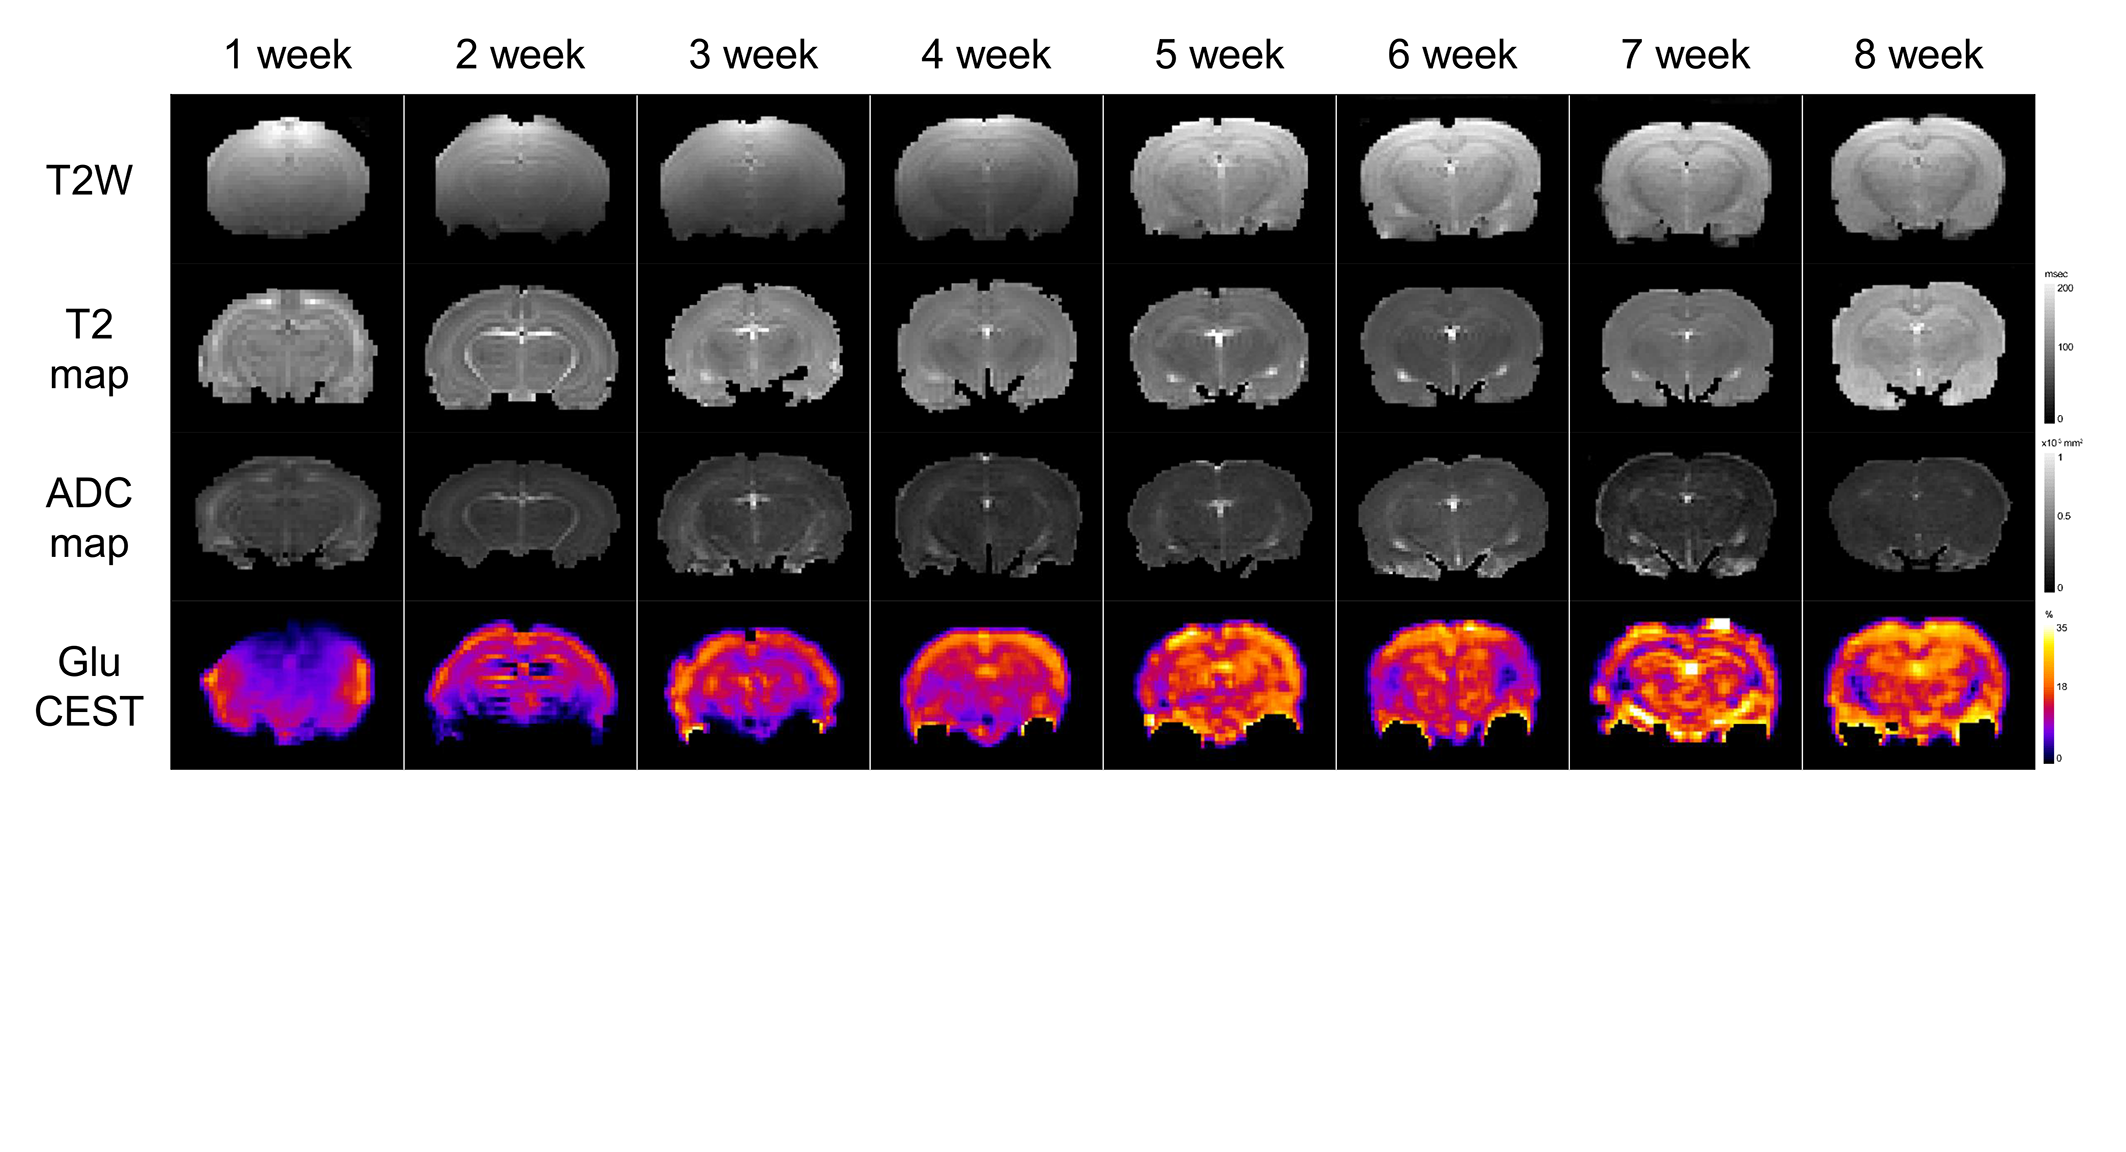
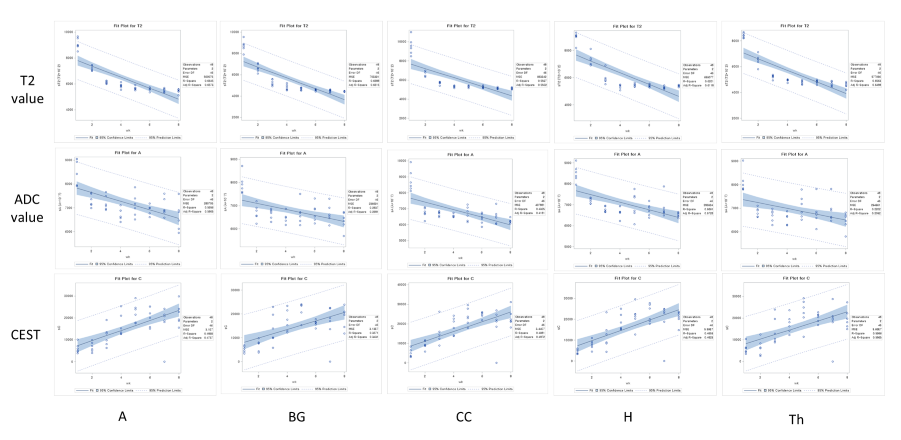
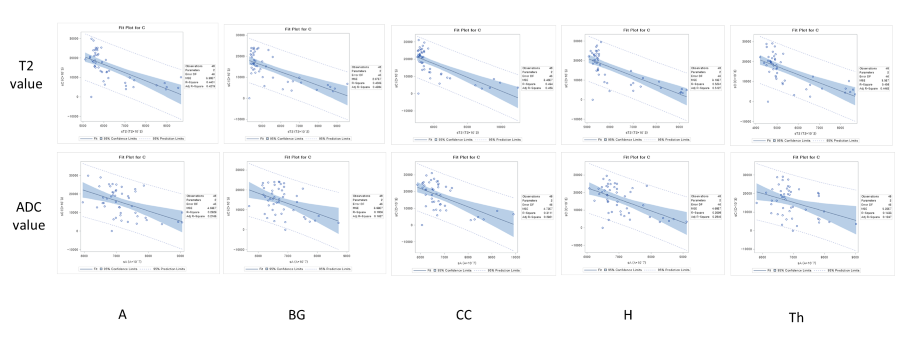
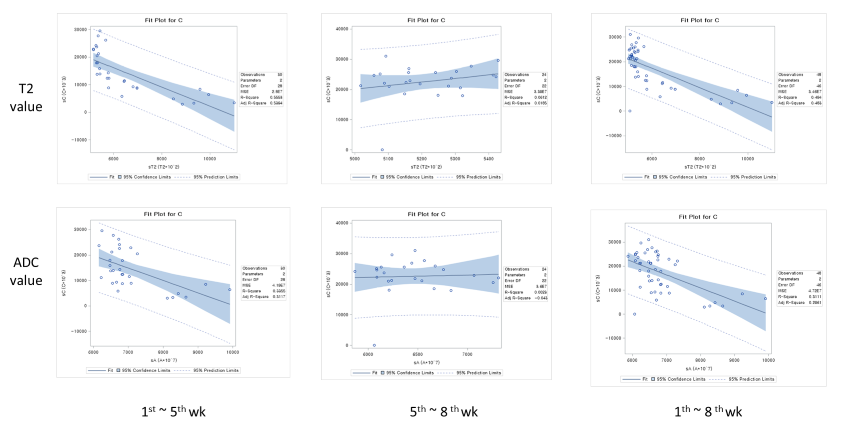
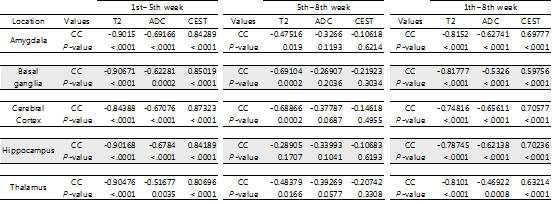
MRI scans of six rats, including GluCEST, T2 mapping, and diffusion-weighted sequences, were acquired on a 7.0-T 160 mm small animal imaging system, every week, for 2 months from birth. Glutamate levels in five different regions (cerebral cortex, hippocampus, thalamus, basal ganglia, and amygdala) of the developmental rat brain were measured using GluCEST. The weekly values of T2, ADC, and GluCEST from the five different brain regions were compared with t-tests and Pearson’s correlation analyses. These correlations were performed for three periods: all 8 weeks, the first to the fifth week, and the fifth to the eighth week.RESULTS
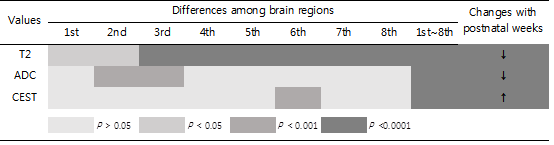
An increase in GluCEST values was observed in the five different brain regions during the first 5 postnatal weeks. After the fifth postnatal week, the levels of glutamate in the five brain regions varied. As postnatal weeks went by, T2 and ADC values decreased. Negative correlations between glutamate concentrations and T2 or ADC values were found (p<0.0001).DISCUSSION
This study shows that the GluCEST method is longitudinally reproducible and can detect glutamate concentrations in the developing postnatal healthy rat brain with high reliability and fine changes in in five different regions. These results are consistent with those previously reported from magnetic resonance spectroscopy and liquid chromatography studies (4, 14, 15). After the fifth week, changes in the concentration varied across the five regions. Statistically, the concentration increment is kept until the eighth week. However, a comparison of the correlation coefficients and p-values of P1 (1st ~5th week) and P2 (5th~8th week) showed that the correlation coefficients of P2 were not statistically significant. In addition to the GluCEST values, the T2 and ADC values also showed statistically significant changes up until the fifth week (p-value < 0.0001). The GluCEST values then differed significantly among the five regions from the sixth postnatal week, thereby providing evidence to suggest that the maturation time point for neurochemical development involving glutamate in the rat brain is the fifth week. Previously, a variety of neurochemicals showed unique concentration curves in rat brain until the fourth postnatal week (4). As the postnatal weeks progress, the brain becomes myelinated and increasingly structured, with gradual increases in the macromolecule content and decreases in the water content (4, 13). Declines in T2 and ADC values with increasing age were shown in this study, similar to the previous studies on humans and animals (16, 17). The T2 value is very sensitive to myelin and neuronal alterations and is affected by the amount and distribution of water (16, 18). In some medical situations (infarction, gliosis and others), an increase in T2 value is shown in association with an increasing free water in brain (19-22). The brain produces a more compact form of neuronal structure with the increase in myelination (24, 25). The dense structure restricts the free water movement, and thereby causes reduced ADC values. The correlations between GluCEST and T2 or ADC values along the postnatal period were negative, with the fifth week being a noticeable time point of change. Until the fifth week, the correlations were statistically significant, but the correlations afterwards were not. The negative correlations between them are the inferable result of putting this study data and the reported results together. As postnatal days continued, T2 and ADC values reflecting the myelination and water content of the brain rapidly decreased, while the concentration of glutamate increased according to the maturation of the brain. It could therefore possibly be used as a measure to indicate normal brain development until the fifth week in rats without disease. The limitation of the MRS is that measurements of glutamate are confined to finite voxels because of the technique’s low sensitivity. The limitation drives the need to find imaging biomarkers that both reflect energy metabolism and offer anatomical resolution of the whole brain at the same time. The CEST technique has advantages in acquisition time, spatial resolution, and increased anatomical and biological information with neurochemical information available for a single image slice (9).CONCLUSION
In rat brain, the fifth postnatal week is a possible time point for neurochemical developmental maturation, with the trends of glutamate concentration increase and T2 and ADC decrease, which are influenced by myelination and neuronal change, plateauing.Acknowledgements
No acknowledgement found.References
1. Demarque M, Represa A, Becq H, Khalilov I, Ben-Ari Y, Aniksztejn L. Paracrine intercellular communication by a Ca2+- and SNARE-independent release of GABA and glutamate prior to synapse formation. Neuron. 2002;36(6):1051-61.
2. Manent JB, Demarque M, Jorquera I, Pellegrino C, Ben-Ari Y, Aniksztejn L, et al. A noncanonical release of GABA and glutamate modulates neuronal migration. J Neurosci. 2005;25(19):4755-65.
3. Nguyen L, Rigo JM, Rocher V, Belachew S, Malgrange B, Rogister B, et al. Neurotransmitters as early signals for central nervous system development. Cell Tissue Res. 2001;305(2):187-202.
4. Tkac I, Rao R, Georgieff MK, Gruetter R. Developmental and regional changes in the neurochemical profile of the rat brain determined by in vivo 1H NMR spectroscopy. Magn Reson Med. 2003;50(1):24-32.
5. Larvaron P, Bielicki G, Boespflug-Tanguy O, Renou JP. Proton MRS of early post-natal mouse brain modifications in vivo. NMR Biomed. 2006;19(2):180-7.
6. Kunz N, Camm EJ, Somm E, Lodygensky G, Darbre S, Aubert ML, et al. Developmental and metabolic brain alterations in rats exposed to bisphenol A during gestation and lactation. Int J Dev Neurosci. 2011;29(1):37-43.
7. Nacewicz BM, Angelos L, Dalton KM, Fischer R, Anderle MJ, Alexander AL, et al. Reliable non-invasive measurement of human neurochemistry using proton spectroscopy with an anatomically defined amygdala-specific voxel. Neuroimage. 2012;59(3):2548-59.
8. Brierley B, Shaw P, David AS. The human amygdala: a systematic review and meta-analysis of volumetric magnetic resonance imaging. Brain Res Brain Res Rev. 2002;39(1):84-105.
9. Cai K, Haris M, Singh A, Kogan F, Greenberg JH, Hariharan H, et al. Magnetic resonance imaging of glutamate. Nat Med. 2012;18(2):302-6.
10. Zhou J, Lal B, Wilson DA, Laterra J, van Zijl PC. Amide proton transfer (APT) contrast for imaging of brain tumors. Magn Reson Med. 2003;50(6):1120-6.
11. Zhou J, Payen JF, Wilson DA, Traystman RJ, van Zijl PC. Using the amide proton signals of intracellular proteins and peptides to detect pH effects in MRI. Nat Med. 2003;9(8):1085-90.
12. Ramu J, Konak T, Liachenko S. Magnetic resonance spectroscopic analysis of neurometabolite changes in the developing rat brain at 7T. Brain Res. 2016;1651:114-20.
13. De Souza SW, Dobbing J. Cerebral edema in developing brain. I. Normal water and cation content in developing rat brain and postmortem changes. Exp Neurol. 1971;32(3):431-8.
14. Bayer SM, McMurray WC. The metabolism of amino acids in developing rat brain. J Neurochem. 1967;14(7):695-706.
15. Oja SS, Uusitalo AJ, Vahvelainen ML, Piha RS. Changes in cerebral and hepatic amino acids in the rat and guinea pig during development. Brain Res. 1968;11(3):655-61.
16. Miot-Noirault E, Barantin L, Akoka S, Le Pape A. T2 relaxation time as a marker of brain myelination: experimental MR study in two neonatal animal models. J Neurosci Methods. 1997;72(1):5-14.
17. Kumar R, Delshad S, Macey PM, Woo MA, Harper RM. Development of T2-relaxation values in regional brain sites during adolescence. Magn Reson Imaging. 2011;29(2):185-93.
18. Mathur-De Vre R. Biomedical implications of the relaxation behaviour of water related to NMR imaging. Br J Radiol. 1984;57(683):955-76.
19. Kumar R, Gupta RK, Rathore RK, Rao SB, Chawla S, Pradhan S. Multiparametric quantitation of the perilesional region in patients with healed or healing solitary cysticercus granuloma. Neuroimage. 2002;15(4):1015-20.
20. Seewann A, Vrenken H, van der Valk P, Blezer EL, Knol DL, Castelijns JA, et al. Diffusely abnormal white matter in chronic multiple sclerosis: imaging and histopathologic analysis. Arch Neurol. 2009;66(5):601-9.
21. Loubinoux I, Volk A, Borredon J, Guirimand S, Tiffon B, Seylaz J, et al. Spreading of vasogenic edema and cytotoxic edema assessed by quantitative diffusion and T2 magnetic resonance imaging. Stroke. 1997;28(2):419-26; discussion 26-7.
22. Wegner C, Esiri MM, Chance SA, Palace J, Matthews PM. Neocortical neuronal, synaptic, and glial loss in multiple sclerosis. Neurology. 2006;67(6):960-7.
23. Masumura M. Proton relaxation time of immature brain. II. In vivo measurement of proton relaxation time (T1 and T2) in pediatric brain by MRI. Childs Nerv Syst. 1987;3(1):6-11.
24. Reiss AL, Abrams MT, Singer HS, Ross JL, Denckla MB. Brain development, gender and IQ in children. A volumetric imaging study. Brain. 1996;119 ( Pt 5):1763-74.
25. Barkovich AJ. Concepts of myelin and myelination in neuroradiology. AJNR Am J Neuroradiol. 2000;21(6):1099-109.
26. Kogan F, Singh A, Debrosse C, Haris M, Cai K, Nanga RP, et al. Imaging of glutamate in the spinal cord using GluCEST. Neuroimage. 2013;77:262-7.
27. Singh A, Haris M, Cai K, Kassey VB, Kogan F, Reddy D, et al. Chemical exchange saturation transfer magnetic resonance imaging of human knee cartilage at 3 T and 7 T. Magn Reson Med. 2012;68(2):588-94.
28. Cai K, Singh A, Roalf DR, Nanga RP, Haris M, Hariharan H, et al. Mapping glutamate in subcortical brain structures using high-resolution GluCEST MRI. NMR Biomed. 2013;26(10):1278-84.
Figures