3156
Magnetization Transfer Ratio based Metric for APTw or CESTw MRI Suppressing Signal from Fluid Compartments - Initial Application to Glioblastoma Assessment1Philips Research, Hamburg, Germany, 2Kyushu University Hospital, Fukuoka, Japan
Synopsis
Amide proton transfer weighted (APTw) MRI has been shown to allow assessment of the tumor aggressiveness/tumor grade with high sensitivity and specificity. Compartments with significant fluid content, like cysts, haemorrhage or necrosis may complicate reading. A metric for APTw MRI is developed, applicable for chemical exchange saturation transfer (CEST) MRI in general, which suppresses fluids based on the spectral shape of the background magnetization transfer ratio (MTR). It is shown to essentially conserve numerical values of APTw MRI in solid tissues. Furthermore, no extra acquisition time is needed, because the metric can be computed from the minimum Z-spectral data also required for standard CEST MRI. The novel metric is explored in an intial study on N=12 gliobastoma cases.
Introduction
Amide
proton transfer (APT) provides MR molecular imaging of
endogenous proteins or peptides1 based on chemical exchange saturation transfer (CEST). Promising clinical applications of APT weighted (APTw) MRI are envisioned in oncology (tumor protein
concentrations2, necrosis/recurrent tumors differentiation3) and in stroke1. APTw-MRI is typically based on magnetization transfer
asymmetry (MTRasym) analysis using symmetric
RF saturation frequencies Δω (±3.5ppm) around water. Here, a novel metric for
APTw or CESTw MRI is proposed using the MTR to suppress confounding signals of tissue compartments
with fluid content (i.e., cysts, hemorrhage, fluid parts of
necrotic tissue).
Applications are anticipated in further simplifying brain tumor grading.
Methods
A spectrally averaged value
of the magnetization transfer ratio is used to re-scale CESTw images
forming a new fluid correcting metric.
Definitions
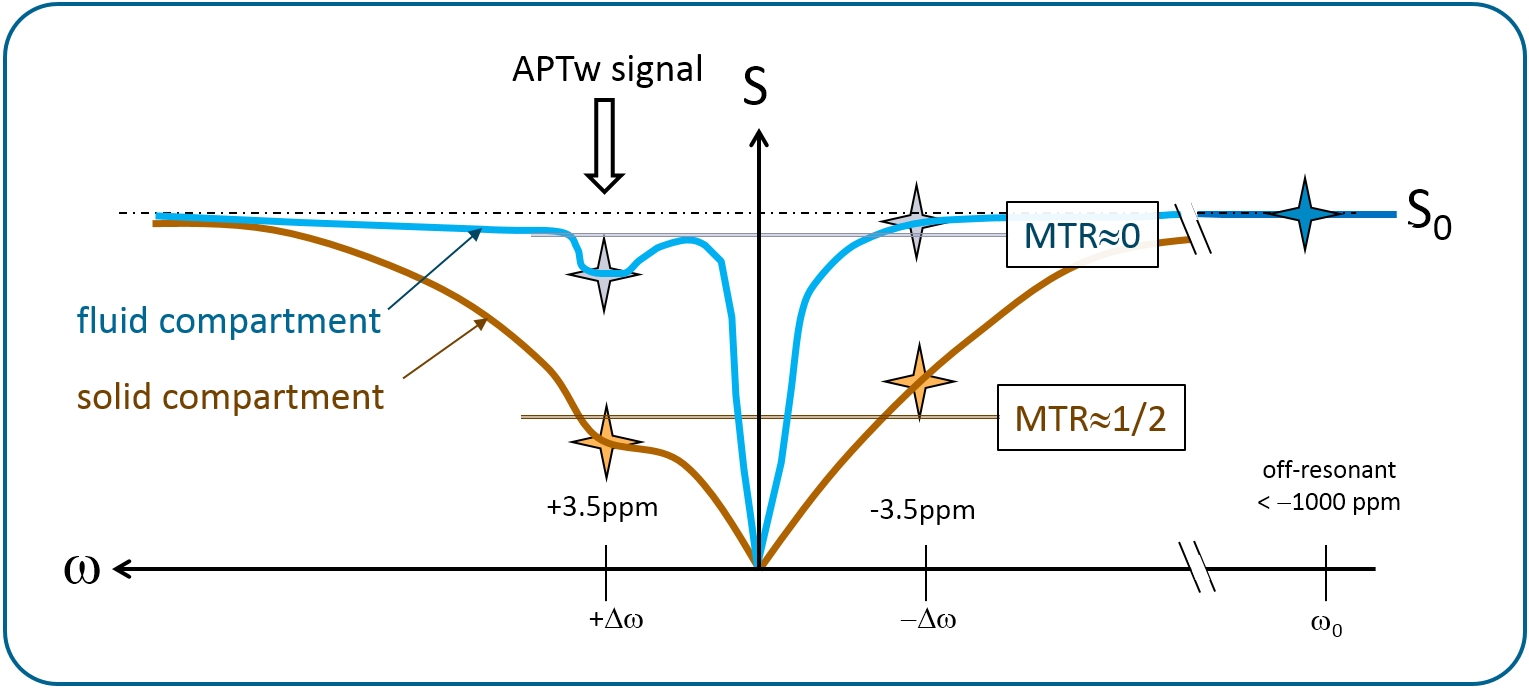
Magnetization transfer ratio is defined as:$$$MTR[\Delta\omega] = 1 - \frac{S[\Delta\omega]}{S_0}$$$, where S[Δω] denotes the signal at the saturation frequency Δω and S0 the signal at a large saturation frequency offset (e.g. Δω<-1000ppm). A standard method to derive CESTw images is: $$$MTR_{asym}[\Delta\omega] = MTR[-\Delta\omega]-MTR[\Delta\omega]$$$. For APTw imaging, Δω=+3.5ppm is chosen. We define the new metric as follows:
$$$CEST_{w;fc} = MTR_{asym;fc} := MTR_{asym}[\Delta\omega]\timesε\times( MTR[\Delta\omega]+MTR[-\Delta\omega] )$$$. [Eq. 1]
ε shall be adjusted once for the specific protocol (and application) to yield similar values in solid compartments as for standard CESTw images. For APTw MRI with standard settings (saturation time Tsat= 2 seconds, B1,rms=2μT, Δω=+3.5ppm)4, ε=1.0 is favorably chosen. For practical calculations the metric can be re-written as: $$$CEST_{w;fc} = MTR_{asym}\timesε\times(2-\frac{S[\Delta\omega]+S[-\Delta\omega]}{S_0})$$$. Another mathematically identical notation: $$$CEST_{w;fc} = ε\times(MTR^2[-\Delta\omega]-MTR^2[\Delta\omega])$$$.
Rationale
In a solid compartment, using the abovementioned protocol settings for the example of APTw imaging, the signal at Δω=±3.5ppm is typically reduced by a factor of 2, so MTR[±3.5ppm]≈1/2, see Figure 1. Thus, in the solid compartment, MTR[+3.5ppm]+MTR[-3.5ppm]≈1/2+1/2=1.0, and the metric according to Eq.1 is not changing the APT signal (for ε=1.0). The average of MTR at two saturation frequency offsets is chosen to reduce the influence of actual APT (or fat/NOE effects) on the weighting process. For compartments with significant fluid content, MTR is significantly lower as compared to solid compartments. With MTR[±3.5ppm]≈0 for pure fluids (e.g. in cysts, CSF), APTw;fc ≈ 0 according to Eq.1, thus compartments with significant fluid content are suppressed.
Initial study on examplary glioblastoma cases
This study was
performed retrospectively on selected APT imaging data of 12 patients with brain tumors, from whom informed consent was obtained. A 3.0T MRI scanner (Achieva TX,
Philips Healthcare, Netherlands) with 2-channel body coil transmission and 8-channel
head coil reception was used with the following parameters: 40×50ms = 2s sinc-gaussian saturation (100% duty cycle by alternated transmission), B1,rms=2μT, 25 Z-spectral images S[ω] (ω=−6…6ppm,
step 0.5ppm, and S0, ω=−1560ppm),
2D single-shot fast spin-echo, driven equilibrium refocusing, sensitivity
encoding R=2, FOV 230 × 230mm2
, voxel size 1.8 × 1.8 × 5 mm3,
TR/TE = 5s/6.2ms, acquisition time 2½ min. MTRasym;fc was calculated using ε=1.
Results
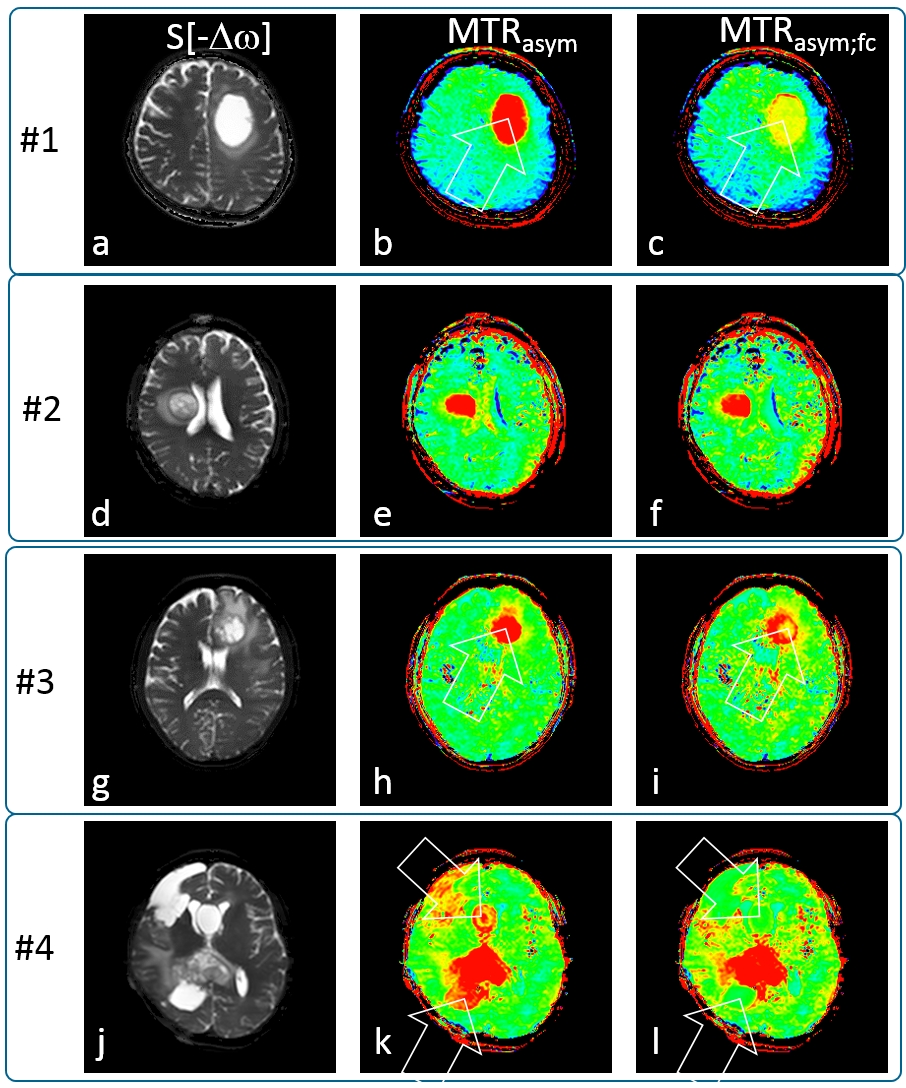
Figure 2 shows exemplary glioblastoma cases with S[-3.5ppm] for anatomical reference, standard MTRasym[+3.5ppm] and MTRasym;fc[+3.5ppm]. A tumor with large central fluid content (Fig.2abc) shows only very thin rim enhancement after fluid correction (arrow). Another example, Fig2.def, appears to be solid tumor as the fluid correction does not alter the APTw contrast appearance. Further, Fig2.ghi, is a confirmed glioblastoma with a small fluid portion (likely necrosis at the tumor center, readily removed by the metric (i). Finally, a very chaotic tumor representation, Fig2.jkl, is considerably cleaned up by fluid correction, cysts being removed and partly fluid areas being suppressed. The statistical analysis (N=12) on ROIs defined by an experienced radologist shows that cystic/necrotic compartments are signficantly reduced: 6.4±1.8% before, 3.4±1.5% after correction, P<0.0001. Solid tumor MTRasym values are essentially maintained: 4.5±1.3% before, 4.8±1.1% after correction (slight but insignificant change, P=0.06).
Discussion
The results demonstrate the potential of the fluid suppressing metric to more selectively visualize solid tumors. An essential feature of this
metric is to conserve numerical values of standard CESTw in solid
tissues, which is readily observed in Fig2.def and confirmed by statistics on 12 cases. A slight change may be fine-corrected in future by slightly tuning the ε parameter of the metric. Furthermore, no extra acquisition time is needed, because the
metric
can be computed from the minimum Z-spectral data also required for
standard CEST MRI. Further
analysis is needed to evaluate if fluid suppression may enhance tumour grading by better
highlighting aggressive sub-volumes. The metric appears to be useful in all applications
of CEST MRI, when suppression of compartments with significant fluid content is
desired. For different saturation protocols, suitable tuning of the metric MTRasym;fc[ε] will be required based on typical Z-spectral features for the tissues of interest (e.g. white matter/grey matter versus tumor tissue).
Acknowledgements
The authors would like to thank Masami Yoneyama and Marc van Cauteren, Philips Electronics Japan.References
[1] Zhou
J, Payen JF, Wilson DA, Traystman RJ, van Zijl PCM. Nature
Medicine 2003; 9:1085.
[2] Jones CK, Schlosser MJ, Zijl PCM, Pomper MG, Golay X, Zhou J. Magn Reson Med 2006;
56:585.
[3] Zhou J, Tryggestad E, Wen Z, Lal B, Zhou T, Grossman R, Wang S, Yan
K, Fu DX, Ford E, Tyler B, Blakeley J, Laterra J, van Zijl PCM. Nature Medicine 2011; 17:130. [4] Togao O et al. Neuro Oncol. 2014 Mar;16(3):441-8
Figures