3155
Cross-Platform Comparison of Regional Brain Stiffness1200 1st St Sw, Mayo Clinic, Rochester, MN, United States, 2University of Delaware, Newark, DE, United States, 3200 1st St Sw, Mayo Clinic, Phoenix, AZ, United States
Synopsis
Brain MR Elastography (MRE) has been shown to add value to neurological imaging. Brain biomechanical properties are correlated with age, gender, exercise and memory in normal volunteers. In patients with neurological diseases, such as multiple sclerosis, dementia and intracranial tumors, global and regional brain mechanical properties may be sensitive biomarkers. Characterization of the cross-platform performance of regional stiffness measurements using 3D brain MRE is important for future multiplatform, multicenter brain MRE studies. The purpose of our study was to compare regional 3D brain MRE in normal volunteers using two vendor platforms.
INTRODUCTION
Brain MR Elastography (MRE) has recently been shown to add value to neurological imaging. Brain biomechanical properties are correlated with age, gender, exercise and memory in normal volunteers 1-3. In patients with neurological diseases, such as multiple sclerosis, dementia and intracranial tumors, global and regional brain mechanical properties have been found to be sensitive biomarkers 4-6. A single-platform, test-retest, repeatability study showed brain MRE to be reproducible within 1% in measuring global brain viscoelasticity and 7% for regional anatomy7. A 2D brain MRE cross-platform study found 2.19% - 9.4% difference between the two platforms in measuring the global brain stiffness 8. A single platform 50Hz 3D brain MRE study found an uncertainty of 3-7% in the visocoelasticity measurements in subcortical gray matter 9. Characterization of the cross-platform performance of regional stiffness measurements using 3D brain MRE is important for future multiplatform, multicenter brain MRE studies. Therefore, the purpose of our study was to compare regional 3D brain MRE in normal volunteers using two vendor platforms.METHODS
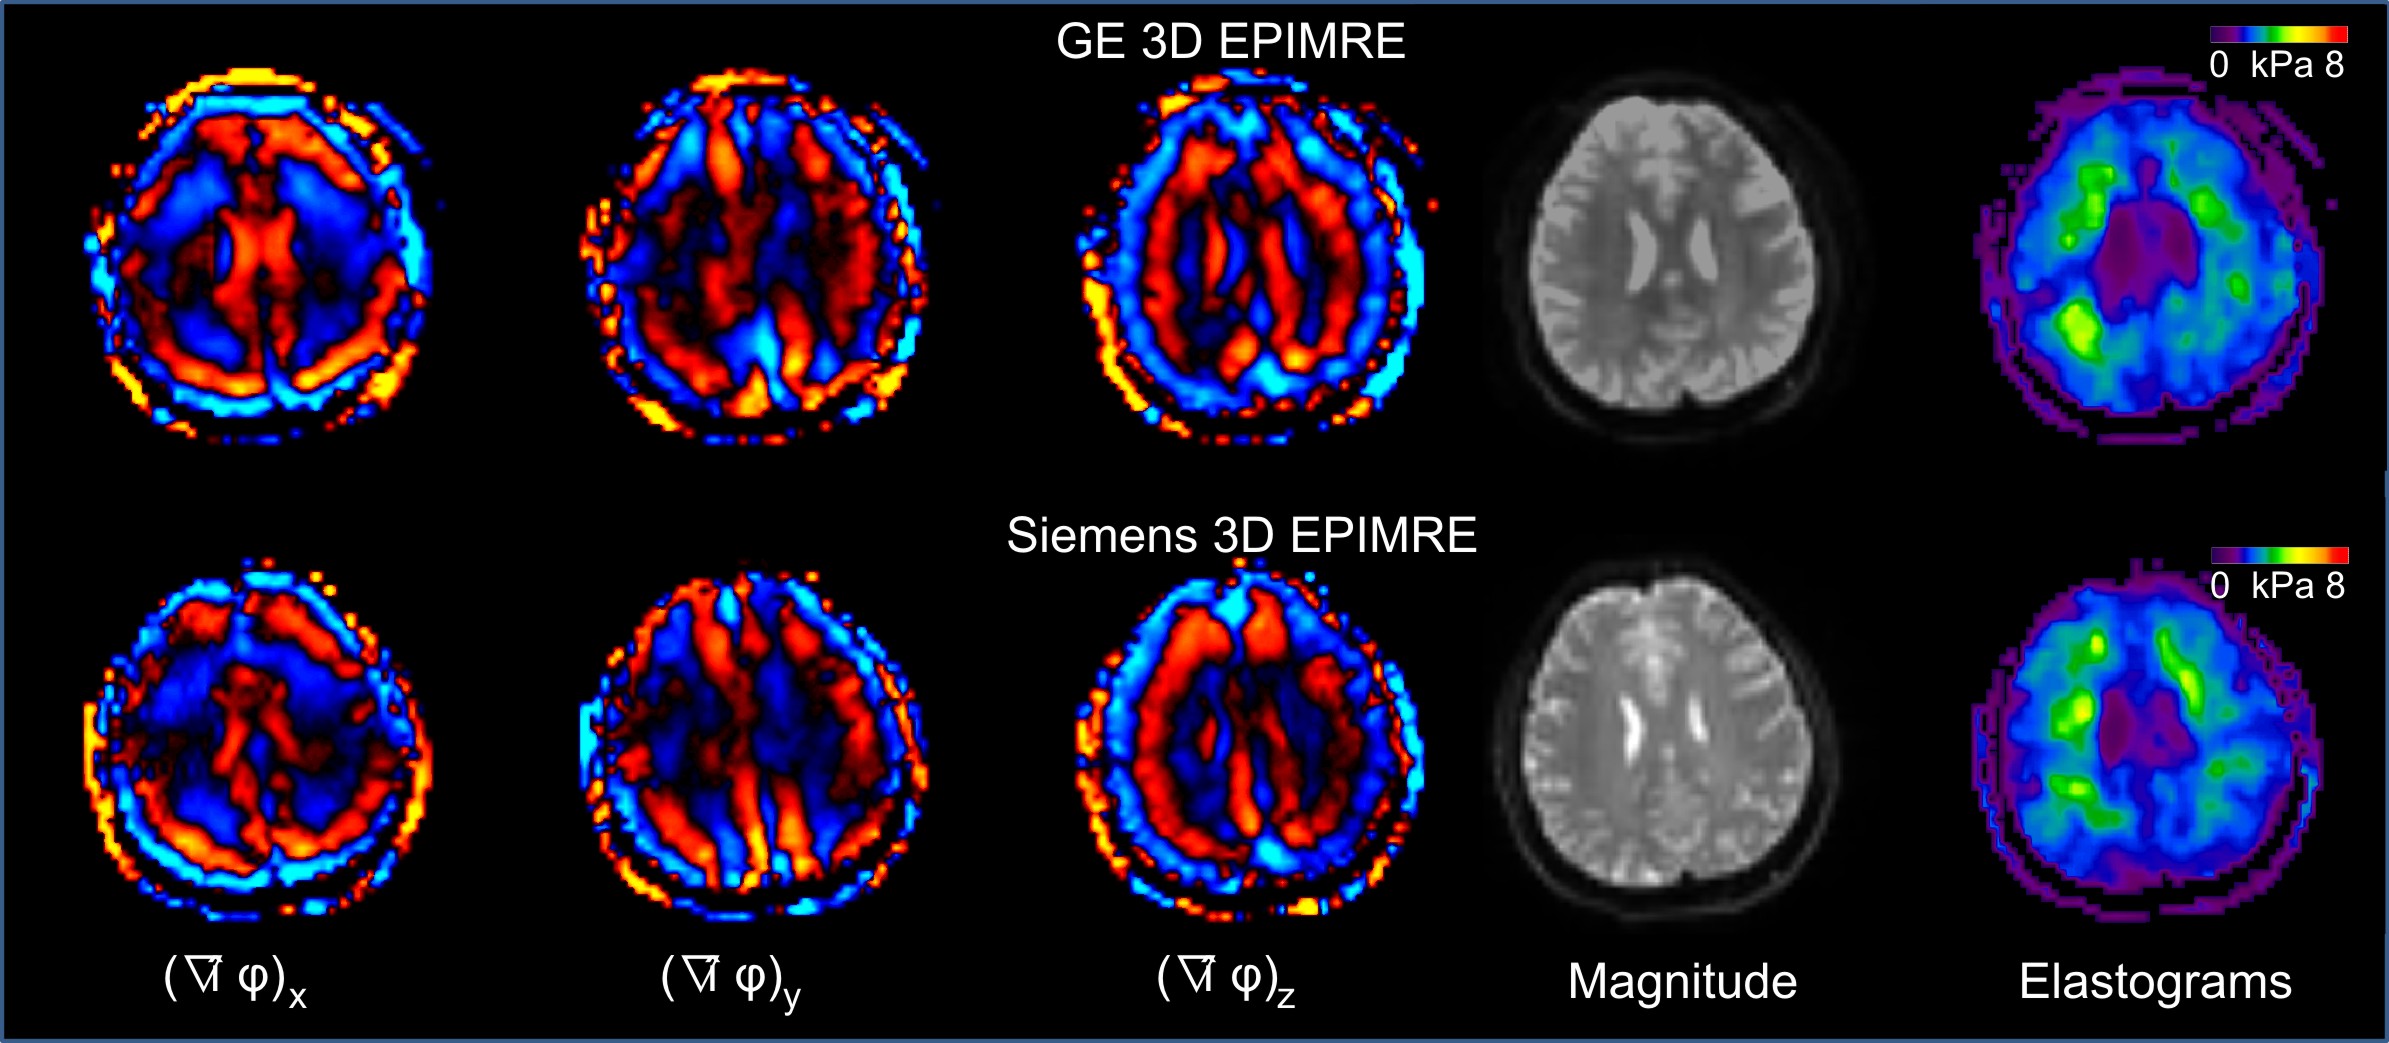
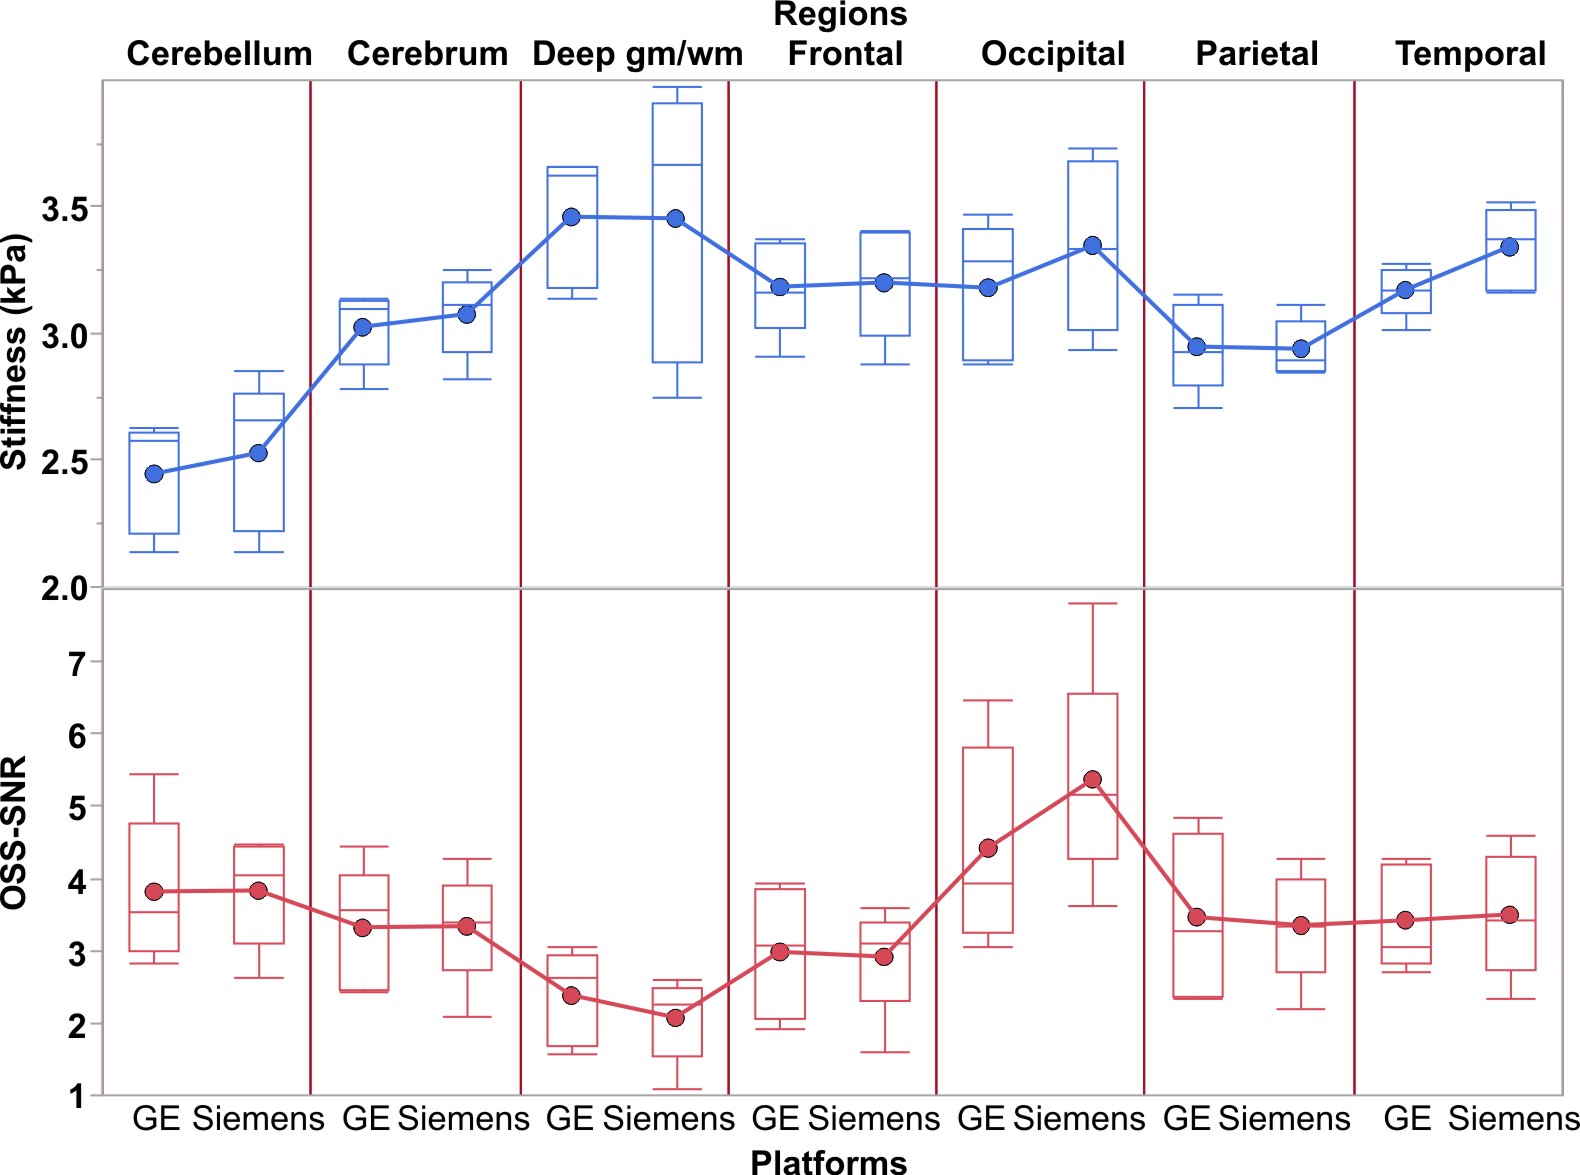
Regional 3D Brain MRE: A SE-EPI technique was performed using a GE Signa HDxt 3T scanner (Milwaukee, WI) and a Siemens Prisma 3T scanner (Erlangen, Germany), with the same flexible brain MRE passive driver. MRE imaging parameters included: slice thickness/gap = 3 mm/0 mm, 48 axial slices, TR = 3601 ms (GE) or 6420 ms (Siemens), TE = 62.3 ms (GE) or 40 ms (Siemens), FOV = 24×24 cm, acquisition matrix = 72×72, 3 orthogonal motion-encoding gradients, motion sensitivity = 3.0 μm/rad (GE) or 2.5 μm/rad (Siemens), and driver frequency = 60 Hz. A T1-weighted volume for atlas registration7 was acquired with 196 sagittal, 1.2-mm-thick, slices (TR/TE = 6.96/2.83 ms, FOV = 27 cm, matrix = 256×256) on the GE platform and was used to generate 7 regions of interest (ROIs) in the brain (cerebellum, cerebrum, deep gray/white matter, frontal, occipital, parietal, and temporal). The ROIs were registered to the MRE images and the median stiffness (kPa) and mean Octahedral Shear Strain Signal-to-Noise Ratio (OSS-SNR) was reported 10.
Subjects: 5 healthy volunteers without known brain disease were enrolled in this prospective, IRB-approved study, with written informed consent.
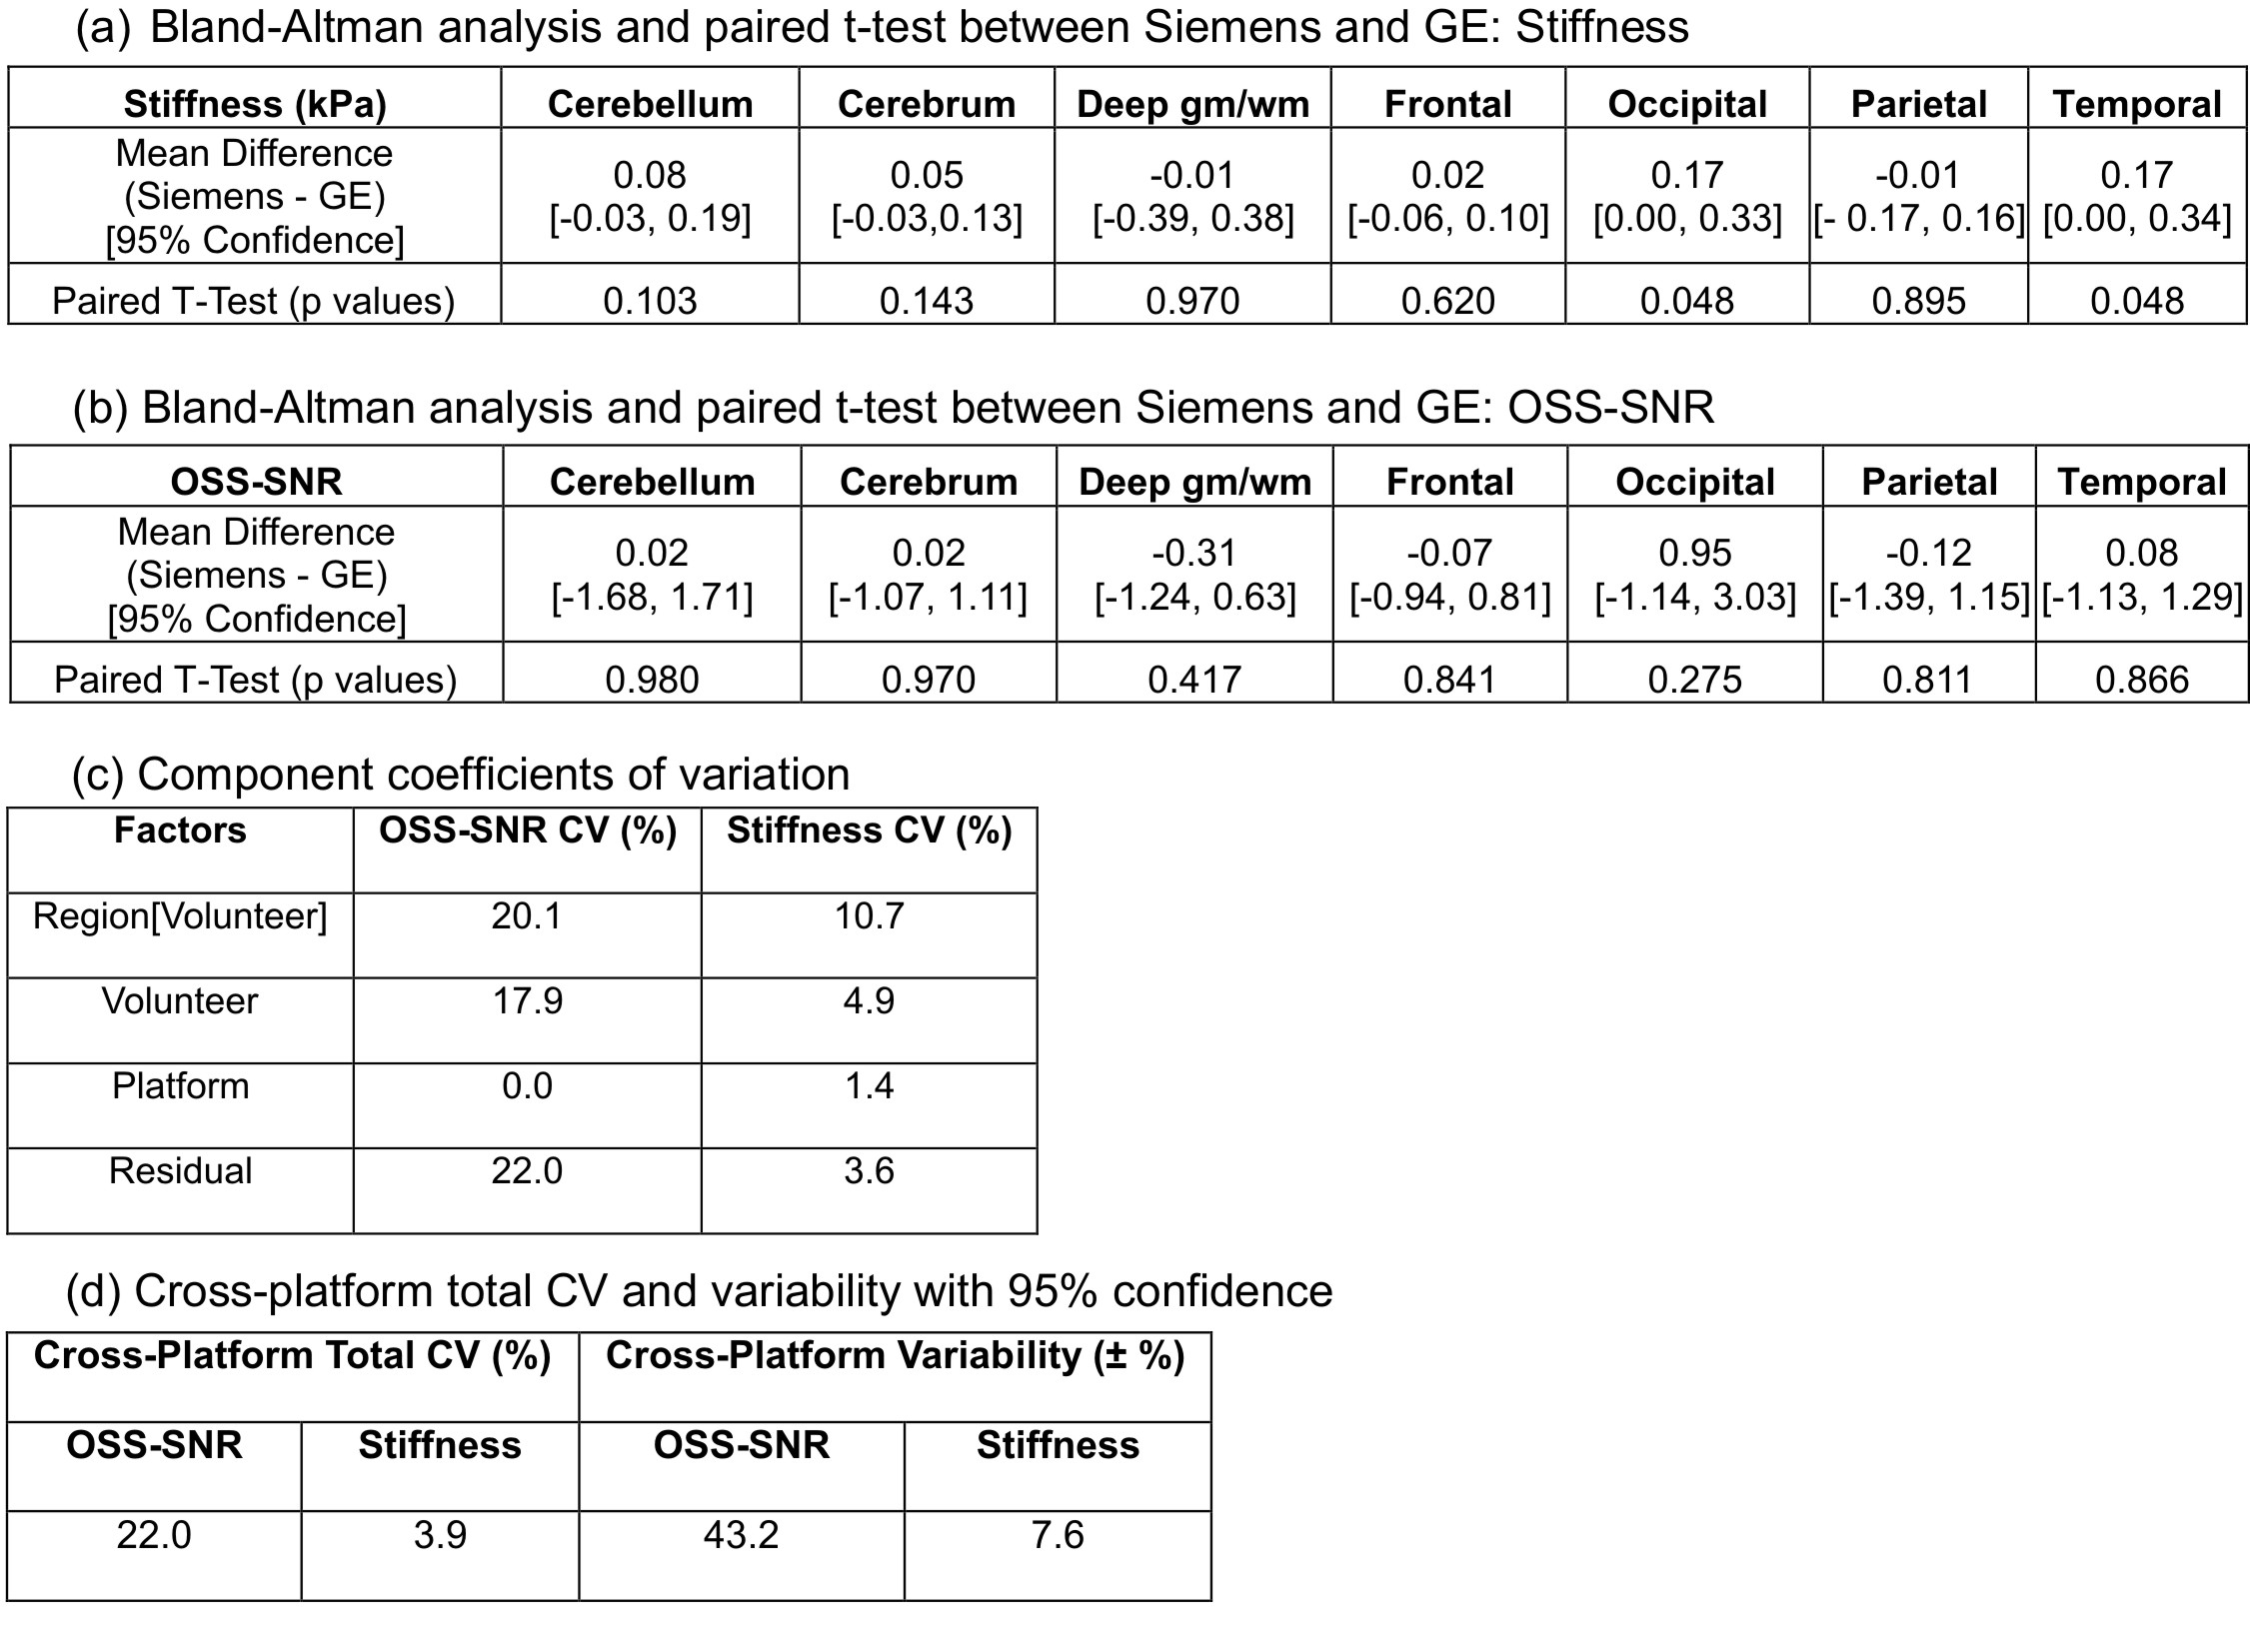
Statistical Analysis: For each of the 7 brain regions, Bland-Altman analysis was performed to compare stiffness and OSS-SNR values from the two techniques, and a paired two-sided T-test was also performed (p < 0.05 indicates statistical significance). A linear mixed effect model was used to analyze the component coefficient of variation (CV, standard deviation/mean, %) from each random factor (platform, brain regions and volunteers) and the residual; the intercept was a fixed effect. The total CV due to the different platforms was calculated as $$$ CV_{total}= \sqrt{CV^2_{platform}+CV^2_{residual}} $$$. With this total CV, 95% of the measurements will fall in the rage of $$$ ± 1.96 × CV_{total} $$$ across the two platforms, which is the cross-platform variability. Because the brain regions belong to each individual volunteer, the brain region variable was nested in the volunteer variable in the statistical analysis. JMP 12 Pro (Cary, NC) was used for the statistical analysis.
RESULTS
An example of the 3D brain MRE images from the two platforms is shown in Fig. 1. The brain stiffness and OSS-SNR in the 7 brain regions are shown for each vender in Fig. 2. Among the 7 regions, two (occipital: p = 0.048, temporal: p = 0.048) were observed to have statistically significantly different stiffnesses between the two platforms (Fig. 3a). No regions had a statistically significant difference in OSS-SNR (Fig. 3b). The mixed effect model shows that the platform variable alone was responsible for 0% (OSS-SNR) and 1.4% (stiffness) CV of the model. The residual CV of 22% (OSS-SNR) and 3.6% (stiffness) cannot be explained by the current model (Fig. 3c). For a stiffness measurement in a specific brain region between the two platforms, there was ± 7.6% variation with 95% confidence (Fig. 3d).
DISCUSSION
In the five brain regions that did not show statistically significant stiffness differences between the two platforms, the mean stiffness difference ranged from -0.07 to 0.08 kPa, which suggests the two platforms are equivalent in those regions. It is not clear why a significant difference was found for the other two regions. Possible explanations could include differences in the geometric distortion and coil sensitivities of the two platforms. Future studies will focus on identifying and controlling for these additional factors.CONCLUSION
Regional 3D brain MRE is equivalent between GE and Siemens implementations of SE-EPI brain MRE for measuring the stiffness of the cerebellum, cerebrum, deep gray/white matter, frontal, and parietal regions. For a stiffness measurement in a specific brain region, the two platforms have a ± 7.6% variation with 95% confidence.
Acknowledgements
No acknowledgement found.References
1. Arani A, Murphy MC, Glaser KJ, et al. Measuring the effects of aging and sex on regional brain stiffness with MR elastography in healthy older adults. Neuroimage 2015;111:59-64.
2. Sack I, Streitberger KJ, Krefting D, Paul F, Braun J. The influence of physiological aging and atrophy on brain viscoelastic properties in humans. PLoS One 2011;6:e23451.
3. Schwarb H, Johnson CL, Daugherty AM, et al. Aerobic fitness, hippocampal viscoelasticity, and relational memory performance. Neuroimage 2017;153:179-88.
4. Streitberger KJ, Sack I, Krefting D, et al. Brain viscoelasticity alteration in chronic-progressive multiple sclerosis. PLoS One 2012;7:e29888.
5. Murphy MC, Jones DT, Jack CR, Jr., et al. Regional brain stiffness changes across the Alzheimer's disease spectrum. Neuroimage Clin 2016;10:283-90.
6. Murphy MC, Huston J, 3rd, Glaser KJ, et al. Preoperative assessment of meningioma stiffness using magnetic resonance elastography. J Neurosurg 2013;118:643-8.
7. Murphy MC, Huston J, 3rd, Jack CR, Jr., et al. Measuring the characteristic topography of brain stiffness with magnetic resonance elastography. PLoS One 2013;8:e81668.
8. Murphy MC, Glaser KJ, Bolster BDJ, Litwiller DV, Kruse SA, Ehman RL. Cross-Platform Comparison of Brain MRE. Proc Intl Soc Mag Reson Med 19; 2011; Montréal, Québec, Canada: ISMRM. p. 1488.
9. Johnson CL, Schwarb H, M DJM, et al. Viscoelasticity of subcortical gray matter structures. Hum Brain Mapp 2016;37:4221-33.
10. McGarry MD, Van Houten EE, Perrinez PR, Pattison AJ, Weaver JB, Paulsen KD. An octahedral shear strain-based measure of SNR for 3D MR elastography. Phys Med Biol 2011;56:N153-64.
Figures