3154
Functional MRI reveals resting state network alterations upon DREADD-induced silencing of the right dorsomedial prefrontal cortex in mice.Lore Peeters1, Rukun Hinz1, Stephan Missault1, Marleen Verhoye1, Annemie Van der Linden1, and Georgios A. Keliris1
1Bio-Imaging Lab, University of Antwerp, Wilrijk, Belgium
Synopsis
Combining chemogenetics with non-invasive functional MRI (fMRI) allows establishing a link between the activity of selected populations of neurons with large-scale network activity. Here, we show that Kappa Opioid Receptor (KOR) DREADD-induced decreases in neural activity result in network alterations that can be picked up by pharmacological and resting state fMRI. In particular, inhibition of the right dorsomedial prefrontal cortex (dmPFC), a core region of the attention network in rodents, induces functional connectivity changes between other regions of the attentional network and between regions of distinct sensory networks (e.g. the visual network).
Introduction
In the past decade, chemogenetic tools have been developed to allow researchers to interrogate the neural circuitry in the brain by spatiotemporally controlling the activity of specific neurons. A novel inhibitory Kappa Opioid Receptor (KOR) DREADD (Designer Receptors Exclusively Activated by Designer Drugs), selectively activated upon binding of the inert ligand Salvinorin B (SalB), was recently developed. Using this DREADD, a recent study has shown that KORD-mediated neural inhibition alters behavior in mice (1). In this work, we unilaterally targeted dmPFC – a major node of the attention network – in order to understand its contribution to brain functional connectivity (FC). To this end, we have first used pharmacological MRI to uncover the spatial distribution as well as the time evolution of the DREADD effects, and then resting state fMRI during a selected time window to measure alterations in FC within and across networks.Methods
Male adult C57BL/6 mice (n=21) were subjected to a stereotactic surgery targeting the right dmPFC with an adeno-associated virus (AAV) virus. Mice received either (n = 12), AAV-CaMKII-HA-KORD-IRES-mCitrine (Vector Core, University of North Carolina), for the expression of KORD in excitatory neurons or a control virus (n = 9), AAV-CaMKIIa-EGFP (Vector Core, University of North Carolina). All imaging procedures started at least three weeks after viral injections and were performed on a 9.4 T MRI system (Bruker Biospec, Germany). For all scans mice were anesthetized with a subcutaneous (s.c.) bolus of 0.05 mg/kg medetomidine, followed by a s.c. infusion of 0.1 mg/kg/h medetomidine and 0.3% isoflurane. Two separate pharmacological fMRI (phMRI) acquisitions were performed in different scanning sessions using two concentrations of SalB (low: 3 mg/kg, high: 6mg/kg). PhMRI scans (Two-shot GE-EPI: TE= 20 ms, TR = 15000 ms, matrix = 64x64, FOV = (20x20) mm2, 16 slices) were acquired starting 10 min before to 50 min after s.c. SalB administration (duration 1h). Resting state fMRI scans (GE-EPI: TE = 16 ms, TR = 2000 ms, matrix = 128x64, FOV = (20x20) mm2, 16 slices) of KORD expressing mice were acquired 10 min after s.c. administration of SalB (3mg/kg) or a control compound, DMSO. Breathing rate, temperature and blood oxygenation were monitored during the scan sessions. All data was processed using SPM12 and REST v1.8 in Matlab 2014a. Statistical analysis was performed using SPM12 and GraphPad Prism 6.Results
PhMRI revealed significant decreases in BOLD signal following administration of SalB (3 mg/kg). These changes were more pronounced during the time period of 10 – 20min following SalB injections and gradually diminished back to baseline levels (Fig 1). In contrast, SalB injection in the sham treated group could not evoke any of the above mentioned effects (Fig 2). Comparison of the two phMRI sessions (high vs low dose) did not show a significant dose-dependent effect. Thus, the low SalB dose was selected for rsfMRI measurements during the 10 – 20min post-injection time window. Region of interest-based resting state fMRI analysis revealed significantly decreased FC between different regions of the attention network (right parietal association cortex – right dorsocentral striatum, right parietal association cortex – right lateral posterior thalamus, right dorsocentral striatum – left dorsocentral striatum). In addition, upon right hemisphere KORD injection the intrahemispheric FC of the right attention network was significantly decreased (Fig 3). Furthermore, a seed based analysis of the right visual cortex revealed significantly decreased FC in the visual network (Fig 4).Conclusion
Neural inactivation of the right dmPFC using KORD reduces the BOLD signal measured by phMRI in a wide network of areas. For the first time, our results also demonstrated altered FC in the targeted network. Interestingly, FC alterations could also be observed in a distinct sensory network, i.e. the visual network. We suggest DREADD-fMRI as a promising tool to assess whole brain large-scale network functional connectivity and activity upon neural activity modulation in selected neural populations. As such, this technique will allow to gain more insight in the underlying mechanisms of functional and dysfunctional neural networks.Acknowledgements
This research was supported by University Research Fund of University of Antwerp (BOF DOCPRO FFB150340) and by the Fund for Scientific Research Flanders (FWO G048917N).References
1. Vardy E, Robinson JE, Li C, et al. A New DREADD Facilitates the Multiplexed Chemogenetic Interrogation of Behavior. Neuron. 2015 May 20;86(4):936-46.Figures
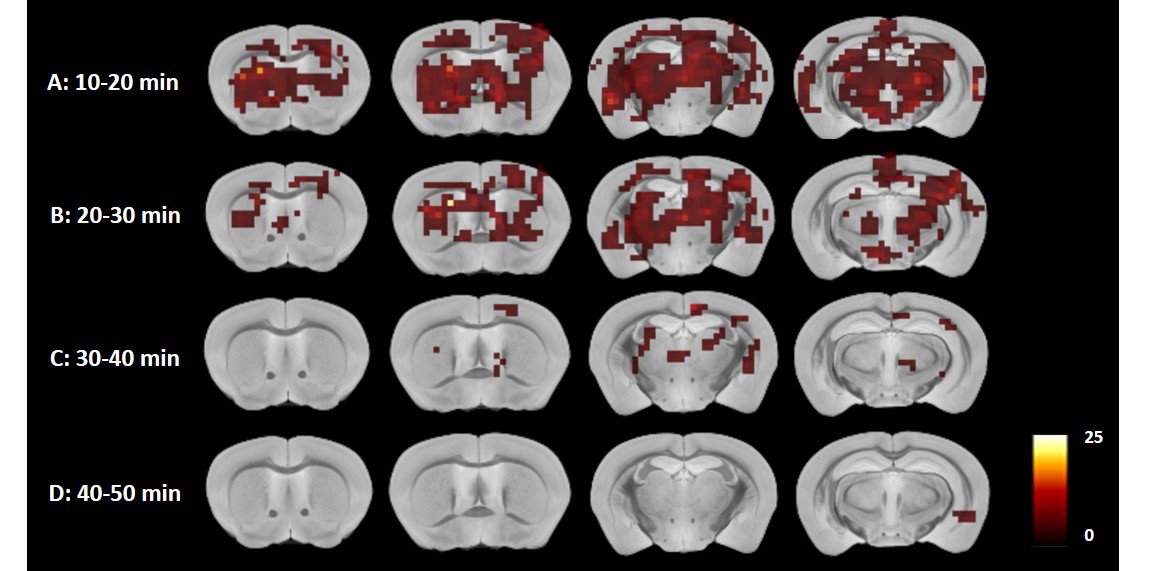
Fig 1. Statistical difference
maps of BOLD signal during baseline (i.e. before SalB injection) and four time
windows after SalB administration (Baseline > time window A, B, C and D). (A)
10-20 min, (B) 20-30 min, (C) 30-40 min, (D) 40-50 min (uncorrected p<0.005,
minimal cluster size = 10). Color scale represents T-values.
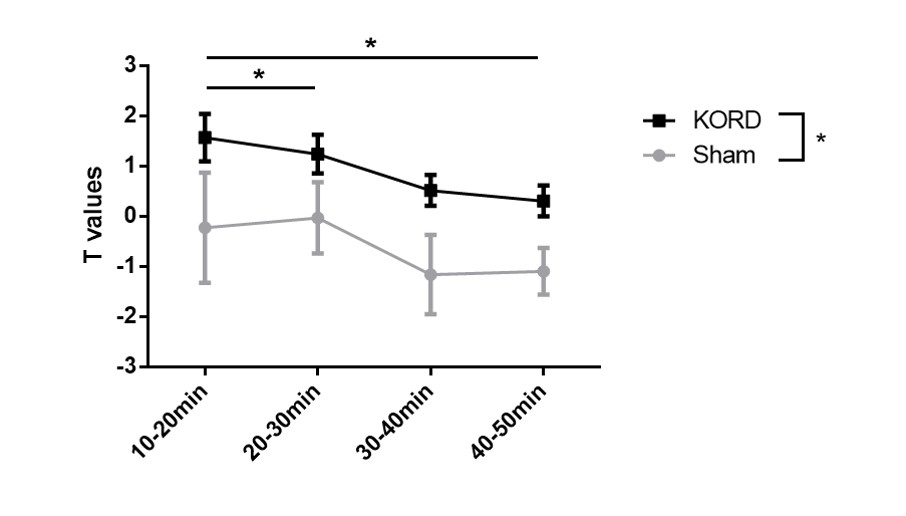
Fig 2. Average T values obtained
from the phMRI scans (see Fig 1) in the right dmPFC upon injection of SalB
(3mg/kg) in KORD expressing mice and sham operated mice. Graph shows a
significant group effect between the two groups. In addition, the KORD injected
mice demonstrate a significant time effect. Graph shows mean T-values ± SEM. Tukey’s
multiple comparisons test * p<0.05
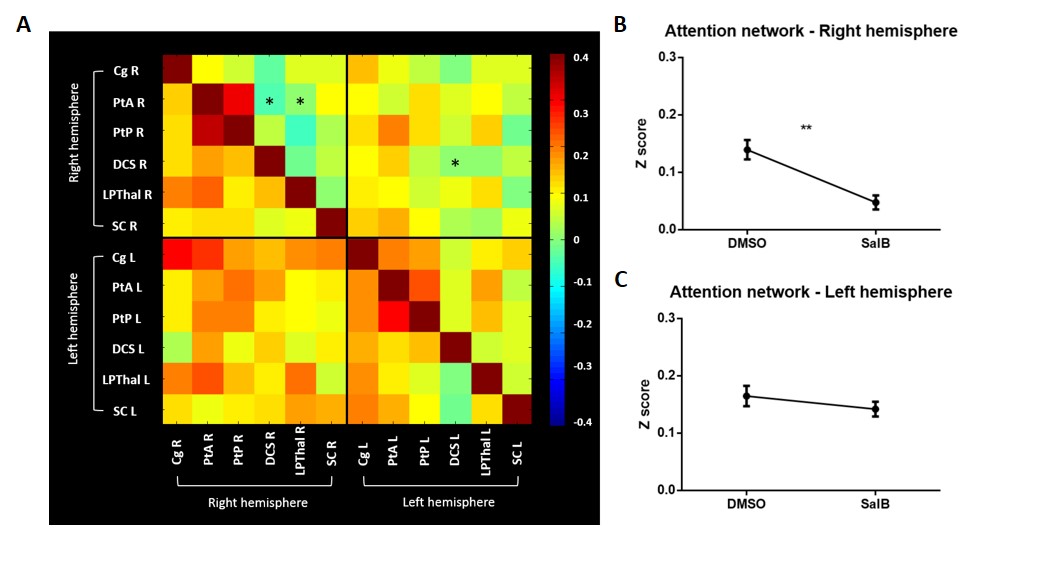
Fig 3. Functional correlation
between regions of the attention network. (A) Functional connectivity matrix
represents correlations between regions of the attention network upon injection
of DMSO (lower half) or SalB (upper half). Stars indicate significant FC differences
between the two groups: FDR corrected * p<0.05. (B+C) Graphs show the
quantification of Z scores in the attention network of both hemispheres upon DMSO
injection or SalB injection. ** p<0.001. Cg: Cingulate cortex, PtA: parietal
association cortex, PtP: posterior parietal cortex, DCS: dorsocentral striatum,
LPThal: lateral posterior thalamus, SC: superior colliculus.
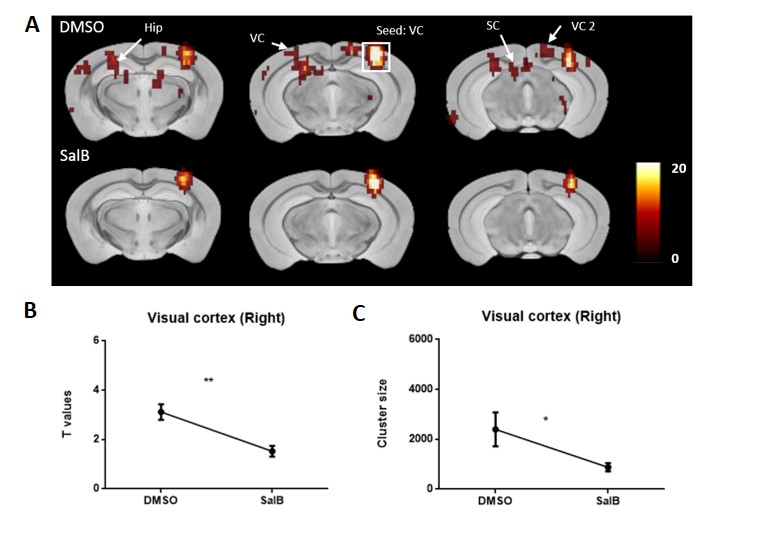
Fig 4. Statistical functional
connectivity map for a seed in the right visual cortex upon DMSO injection and
SalB injection. (A) Functional connectivity maps of the right visual cortex
after DMSO (upper map) and SalB injection (lower map) (uncorrected p<0.001,
k=10). (B+C) Graphs show the mean T-values ± SEM and the total cluster size of
all significantly correlated clusters (minimal cluster size = 10) with the seed
region. ** p<0.001, * p<0.05. VC: visual cortex, VC 2: secondary visual
cortex, Hip: hippocampus, SC: superior colliculus.