3153
Susceptibility weighted imaging with Compressed-SENSE: Quantitative and Clinical evaluation1Philips Innovation Campus, Philips India Limited, Bengaluru, India, 2Fortis Memorial Research Institute, Gurugram, India, 3Philips Research Europe, Hamburg, Germany, 4Philips India Limited, Gurugram, India
Synopsis
The current work evaluates the influence of a combined SENSE and compressed sensing algorithm, Compressed-SENSE, on the quantitative and qualitative aspects of SWI data. Quantitative evaluation is done using quantitative susceptibility maps. Clinical qualitative assessment is done in patients with cerebral glioma using ITSS score as the metric for image diagnostic quality.
Introduction
Susceptibility weighted imaging (SWI) is an integral part of clinical neuroimaging protocols including stroke, neurovascular disorders, trauma and brain tumor imaging.1,2 It is a 3D high resolution, flow compensated, spoiled gradient echo technique which uses both magnitude and phase information for enhanced sensitivity to susceptibility-effect-causing structures like venous blood, hemorrhage, iron/calcification in tissue.3 Additionally, quantitative susceptibility mapping (QSM), obtained from gradient-echo phase data, provides important physiological information such as blood oxygenation and tissue iron content.4,5 Despite use of parallel imaging, current SWI acquisition times can range from 3mins to 5mins, depending on the spatial resolution and coverage. Acceleration techniques like compressed sensing (CS) offer a possible means of further reducing this acquisition time. Few earlier studies have evaluated the utility of CS for SWI.6,7 While these studies focused on the influence of CS on the quality of SWI magnitude, they have not evaluated its influence on the quantitative accuracy of SWI phase. Furthermore, compressed sensing with parallel imaging has not been evaluated in SWI before. In this work, we evaluate the influence of a compressed sensing with parallel imaging technique - Compressed-SENSE8 (CSENSE) - on the accuracy of quantitative phase and on the diagnostic quality of SWI in glioma patients.Materials and Methods
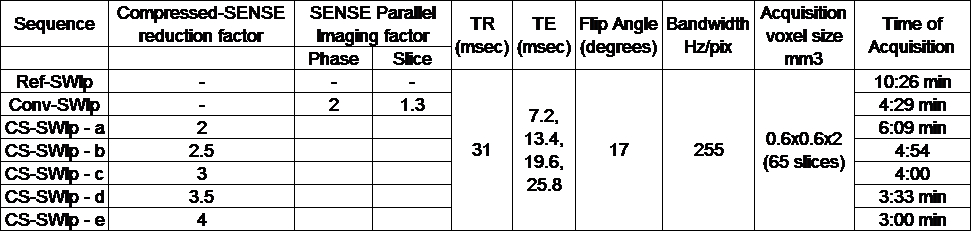
Compressed sensing relies on pseudo-random sampling of k-space leading to in-coherent aliasing, which is then removed through iterative reconstruction.9 Parallel imaging on the other hand utilizes the spatially distributed coil-sensitivities as an additional means of spatial encoding.10 The CSENSE algorithm used in this work efficiently combines the strengths of both, providing additional acceleration. It iteratively computes the image by simultaneously ensuring fidelity with the acquired complex k-space and sparseness in a pre-determined orthogonal transformation. The fidelity constraint ensures that the phase is preserved through iterations. Quantitative evaluation: QSM maps (using JEDI11) from SWI data alone, acquired at different CSENSE reduction factors (CS-SWIp), were computed and mean susceptibility values of 5 gray matter nuclei were statistically compared using ANOVA test. The table shown in Figure-1 summarizes the parameters used for data acquisition. After obtaining informed consent, two adult healthy volunteers were imaged for this part of the study. SWI acquisition with full k-space sampling (Ref-SWIp) served as reference for evaluating susceptibility values from CS-SWIp. Conventional SWI (Conv-SWIp) data, which is currently used in clinical imaging, with a SENSE parallel imaging was also acquired. Standard deviation of susceptibility values within the CSF region in the third ventricles was used to estimate the background noise in QSM maps. Clinical evaluation: Twelve patients with cerebral gliomas were imaged with CS-SWIp (reduction factor 3.6) in addition to the Conv-SWI that is routinely acquired for diagnostic imaging. SWIp magnitude data from both acquisitions were randomly presented to an experienced neuro-radiologist in a blinded fashion for assessing intra-tumoral susceptibility signal (ITSS) score.12 Correlation between ITSS scores for Conv-SWIp and CS-SWIp were statistically evaluated using Spearman’s rank correlation test. The study was approved by local ethics committee. Imaging was performed on a 3.0T Philips Ingenia system using the SWIp sequence.Results
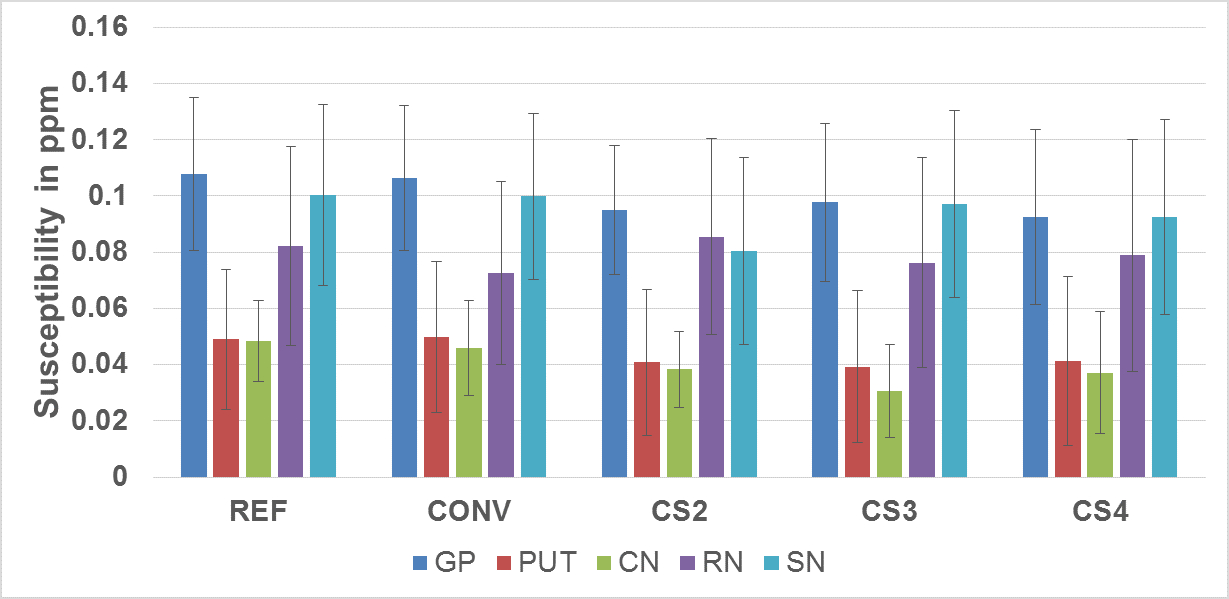
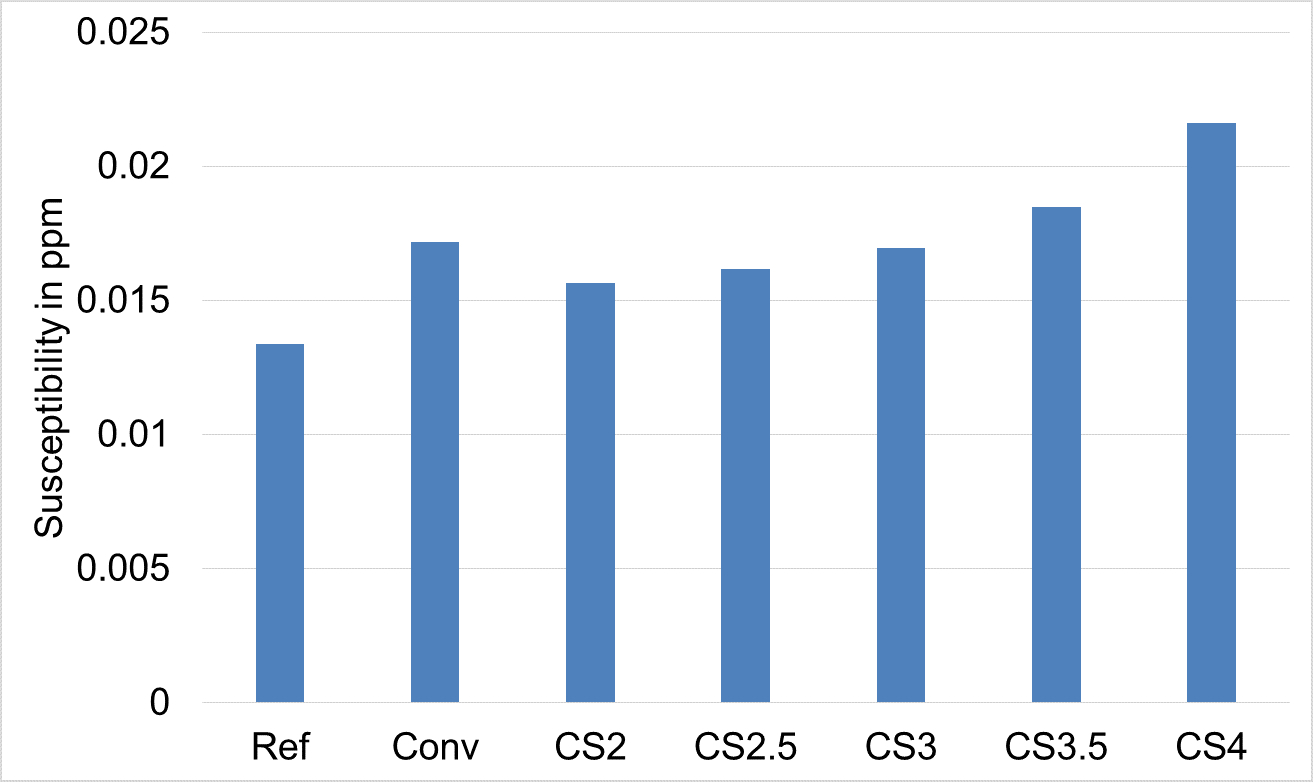
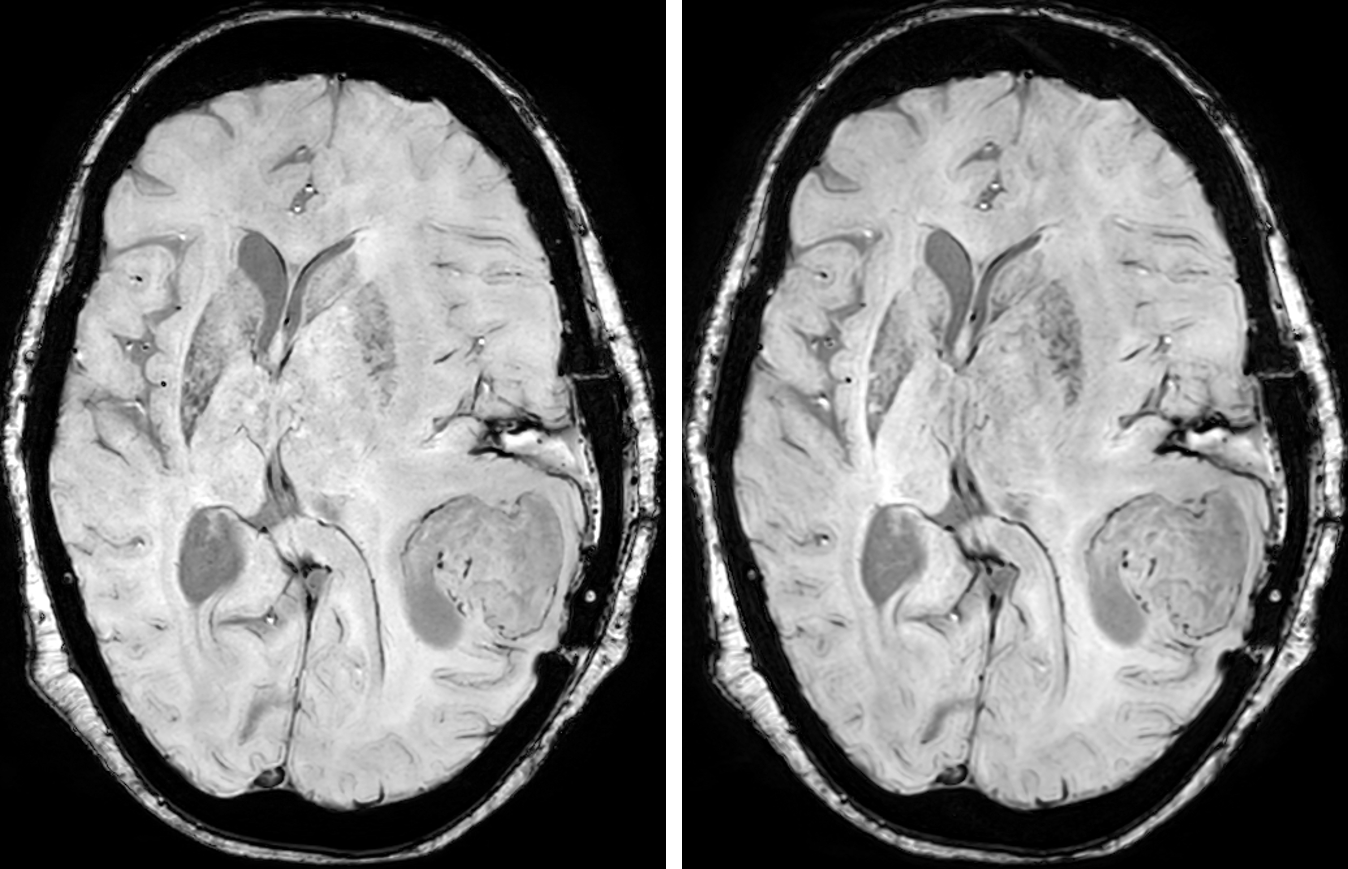
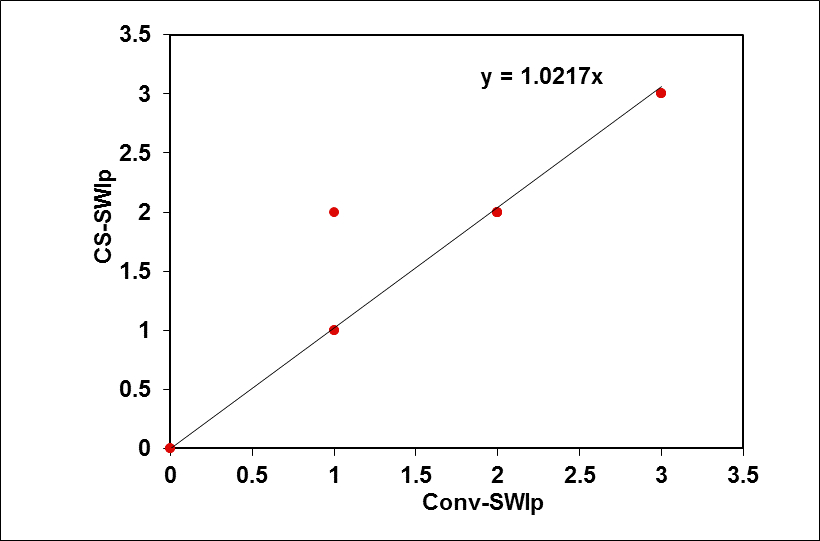
Figure-2 shows the susceptibility values along with the corresponding standard deviations from one subject. Figure 3 shows the standard deviation of susceptibility values in CSF region. Statistically, measurements from the Ref-SWI, Conv-SWI and CS-SWIp with different CSENSE factors were found to be equivalent (p=0.99) in all the subjects. However, the noise in the QSM maps increased with increasing CSENSE factor. Figure 4 shows Conv-SWIp and CS-SWIp images from one of the patients. Intra-tumoral contrast is visually similar between the images. Except in one case, the ITSS scores for 11 patients were identical between Conv-SWIp and CS-SWIp (Spearman’s rho: 0.96, p<0.05, Figure-5).Discussion
The increasing standard deviation in QSM maps with increasing CSENSE factors is consistent with previously observed behavior in CS algorithms where incoherent aliasing increases with increasing factors. While this increased ‘noise’ is present in the SWIp magnitude images as well, the influence on contrast-to-noise ratio was not significant to influence the ITSS score. Study Limitations: We did not compare CSENSE with other methods like l1-spirit. Furthermore, the sample size in clinical evaluation was small. Future studies will focus on evaluation in other conditions with a larger sample size, along with comparison with other existing methods.Conclusion
The Compressed-SENSE algorithm did not significantly influence the diagnostic quality of SWIp, while providing a 30% reduction in imaging time compared to the conventional SWIp. Furthermore, mean tissue magnetic susceptibility values were not influenced by CSENSE, up to reduction factor 4. However, measurement noise in the QSM maps increased with increasing CSENSE factor.Acknowledgements
No acknowledgement found.References
1. Wintermark, M. et al. Imaging Recommendations for Acute Stroke and Transient Ischemic Attack Patients. J. Am. Coll. Radiol. 10, 828–832 (2013).
2. Wintermark, M., Sanelli, P. C., Anzai, Y., Tsiouris, A. J. & Whitlow, C. T. Imaging evidence and recommendations for traumatic brain injury: Conventional neuroimaging techniques. J. Am. Coll. Radiol. 12, e1–e14 (2015).
3. Haacke, E. M., Xu, Y., Cheng, Y.-C. N. & Reichenbach, J. R. Susceptibility weighted imaging (SWI). Magn. Reson. Med. 52, 612–618 (2004).
4. Langkammer, C. et al. Quantitative susceptibility mapping (QSM) as a means to measure brain iron? A post mortem validation study. Neuroimage 62, 1593–1599 (2012).
5. Haacke, E. M., Tang, J., Neelavalli, J. & Cheng, Y. C. N. Susceptibility mapping as a means to visualize veins and quantify oxygen saturation. J. Magn. Reson. Imaging 32, 663–676 (2010).
6. Wu, Y. et al. Accelerated MR Diffusion Tensor Imaging Using Distributed Compressed Sensing. Magn. Reson. Med. 86392243, 763–772 (2013).
7. Chen, W., Jin, Z., Liu, F. & Du, Y. P. Application of SVD-based sparsity in compressed sensing susceptibility weighted imaging. in 2012 5th International Conference on Biomedical Engineering and Informatics, BMEI 2012 447–450 (2012). doi:10.1109/BMEI.2012.6513159
8. Philips showcases newest MR-based innovations and the value of collaboration at ISMRM 2017. Available at: https://www.usa.philips.com/a-w/about/news/archive/standard/news/press/2017/20170422-philips-showcases-newest-mr-based-innovations-collaboration-ismrm-2017.html.
9. Lustig, M., Donoho, D. & Pauly, J. M. Sparse MRI: The application of compressed sensing for rapid MR imaging. Magn. Reson. Med. 58, 1182–1195 (2007).
10. Pruessmann, K. P., Weiger, M., Scheidegger, M. B. & Boesiger, P. SENSE: Sensitivity encoding for fast MRI. Magn. Reson. Med. 42, 952–962 (1999).
11. Meineke, J., Wenzel, F., Wilkinson, I. & Katscher, U. No significant increase of magnetic susceptibility found in subcortical gray matter of patients with Alzheimer’s Disease. in ISMRM 25th Annual Meeting, Honolulu, HI #2348 (2017).
12. Park, M. J. et al. Semiquantitative assessment of intratumoral susceptibility signals using non-contrast-enhanced high-field high-resolution susceptibility-weighted imaging in patients with gliomas: Comparison with MR perfusion imaging. Am. J. Neuroradiol. 30, 1402–1408 (2009).
Figures