3152
MT and QSM of the Locus Coeruleus and Substantia Nigra on human healthy subjects1Department of Clinical Neurosciences, University of Cambridge, Wolfson Brain Imaging Centre, Cambridge, United Kingdom, 2Department of Clinical Neurosciences, University of Cambridge, Cambridge Centre for Frontotemporal Dementia and related disorders, Cambridge, United Kingdom, 3University of Cambridge, Behavioural and Clinical Neuroscience Institute, Cambridge, United Kingdom, 4University of Cambridge, Department of Clinical Neurosciences, Cambridge, United Kingdom, 5Medical Research Council Cognition and Brain Sciences Unit, Cambridge, United Kingdom
Synopsis
The Locus Coeruleus (LC) and the Substantia Nigra (SN) are located in the mid-brain are known to show severe cell loss in several neurodegenerative diseases (e.g., Alzheimer’s disease). Developing new imaging techniques to quantify the signal changes in these regions is of high clinical relevance. In this pilot study of five healthy adults from different age groups, the LC and SN were evaluated for neuromelanin and iron content with an Magnetisation Transfer-weighted sequence and with Quantitative Susceptibility Mapping, respectively.
Introduction
The Locus Coeruleus (LC) is a small, tubular and elongated structure which is anatomically close to the fourth ventricle. The LC is the main source of the brain’s noradrenergic innervation, and has been implicated in specific cognitive functions, including attention, memory and cognitive control, and arousal regulation. Noradrenergic neurons of the LC produce neuromelanin (NM)1, which is thought to play a neuroprotective role by chelating environmental toxins including heavy metals2. Recently, it has been reported that the source of image contrast in the neuromelanin-rich LC is predominantly related to a Magnetization Transfer (MT) effect3, shown by high-resolution images at 7T.
Neuromelanin is also found in the dopaminergic neurons of the Substantia Nigra (SN)4, a structure that is also known to have high iron concentrations. Quantitative Susceptibility Mapping (QSM) estimated from T2*-weighted images has been proposed to correlate with iron concentration in the brain, and showed a superior sensitivity over R2* mapping in disease5.
Since both the LC and the SN show severe cell loss in several neurodegenerative diseases (e.g., Alzheimer’s disease)6,7, developing new imaging techniques to quantify the signal changes in these regions is of high clinical relevance. In this pilot study of five healthy adults from different age groups, the LC and SN were evaluated for neuromelanin and iron content with an MT-weighted sequence and with QSM, respectively.
Acquisition
Five healthy volunteers (2 female, (36±16)y.o.) were scanned on a 7T Siemens Terra MRI scanner under local ethics. A 3D MT-weighted sequence (MT-TFL) was developed similarly to Nikos et al. (2017)3, where a train of 18 RF-pulses with a peak amplitude of 3.37uT and at 6.72ppm off-resonance preceded a turbo-flash readout train. MT-TFL imaging parameters were: TE/TR=(3.44/886)ms, flip-angle=8º, voxel-size=0.4x0.4x0.5mm3, BW=300Hz/px, no acceleration, slices=104, 15%-oversampling, acquisition time=4’51’’. Three runs of the MT-TFL sequence were acquired from each subject.
Single-echo, 0.7mm isotropic resolution T2*-weighted images were acquired for QSM: TE/TR=20/31ms; FA=15º; BW=70Hz/px; acceleration-factor=2x2; FOV=224x224x157mm3; scan-time=9’30’’. A 1.0mm isotropic MP2RAGE sequence was acquired for planning the MT-TFL Field-of-View and for image registration.
Analysis
The STI Suite software package was used for calculating QSM. Each single-echo T2* phase dataset was first masked and then unwrapped. This was followed by background phase removal with V-SHARP using default settings8. QSM maps were estimated with the LSQR method9, and were registered to the MT-TFL space with FSL’s FLIRT10 (12-DOF affine registration). A CSF mask obtained from the MP2RAGE images was used to correct the QSM reference ($$$\Delta\chi=\bar{\chi}_{VOI}-\bar{\chi}_{CSF}$$$).
The LC and SN volumes-of-interest (VOIs) were manually drawn on the MT-TFL images with ITK-Snap (http://www.itksnap.org). In the vicinity of each of the LC and SN structures an additional VOI of 4x4x2mm3 was drawn to serve as reference, VOIref. From the MT-TFL scans, the MT contrast (MTc) on both structures calculated as: $$$MTc=(\bar{I}_{VOI}-\bar{I}_{VOIref})/(\bar{I}_{VOI}+\bar{I}_{VOIref})\times200$$$. The average $$$\Delta\chi$$$ in the LC and SN was measured.
Results
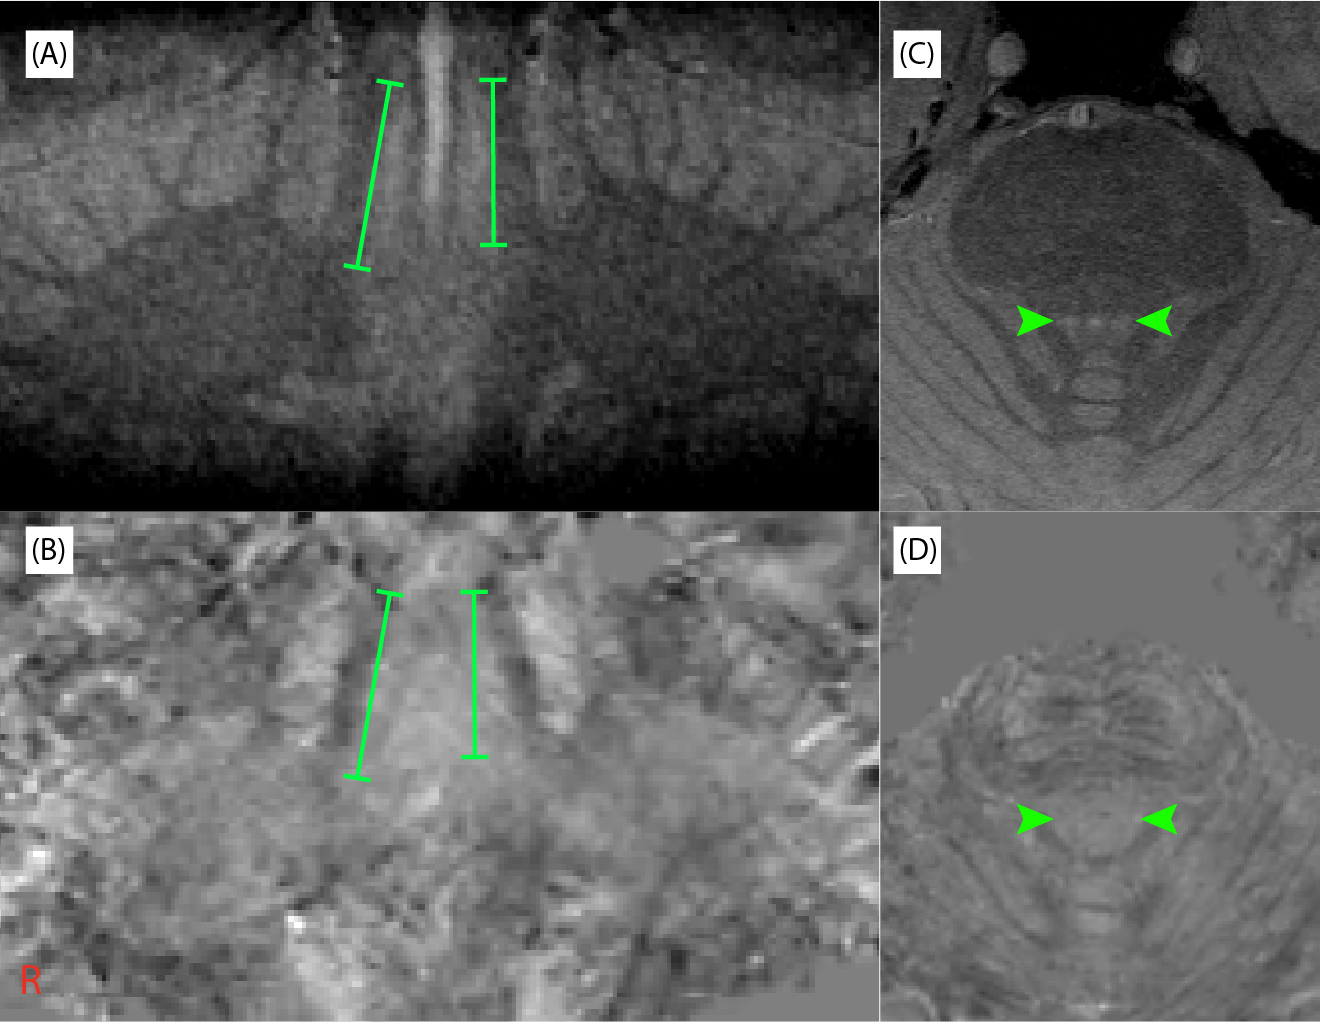
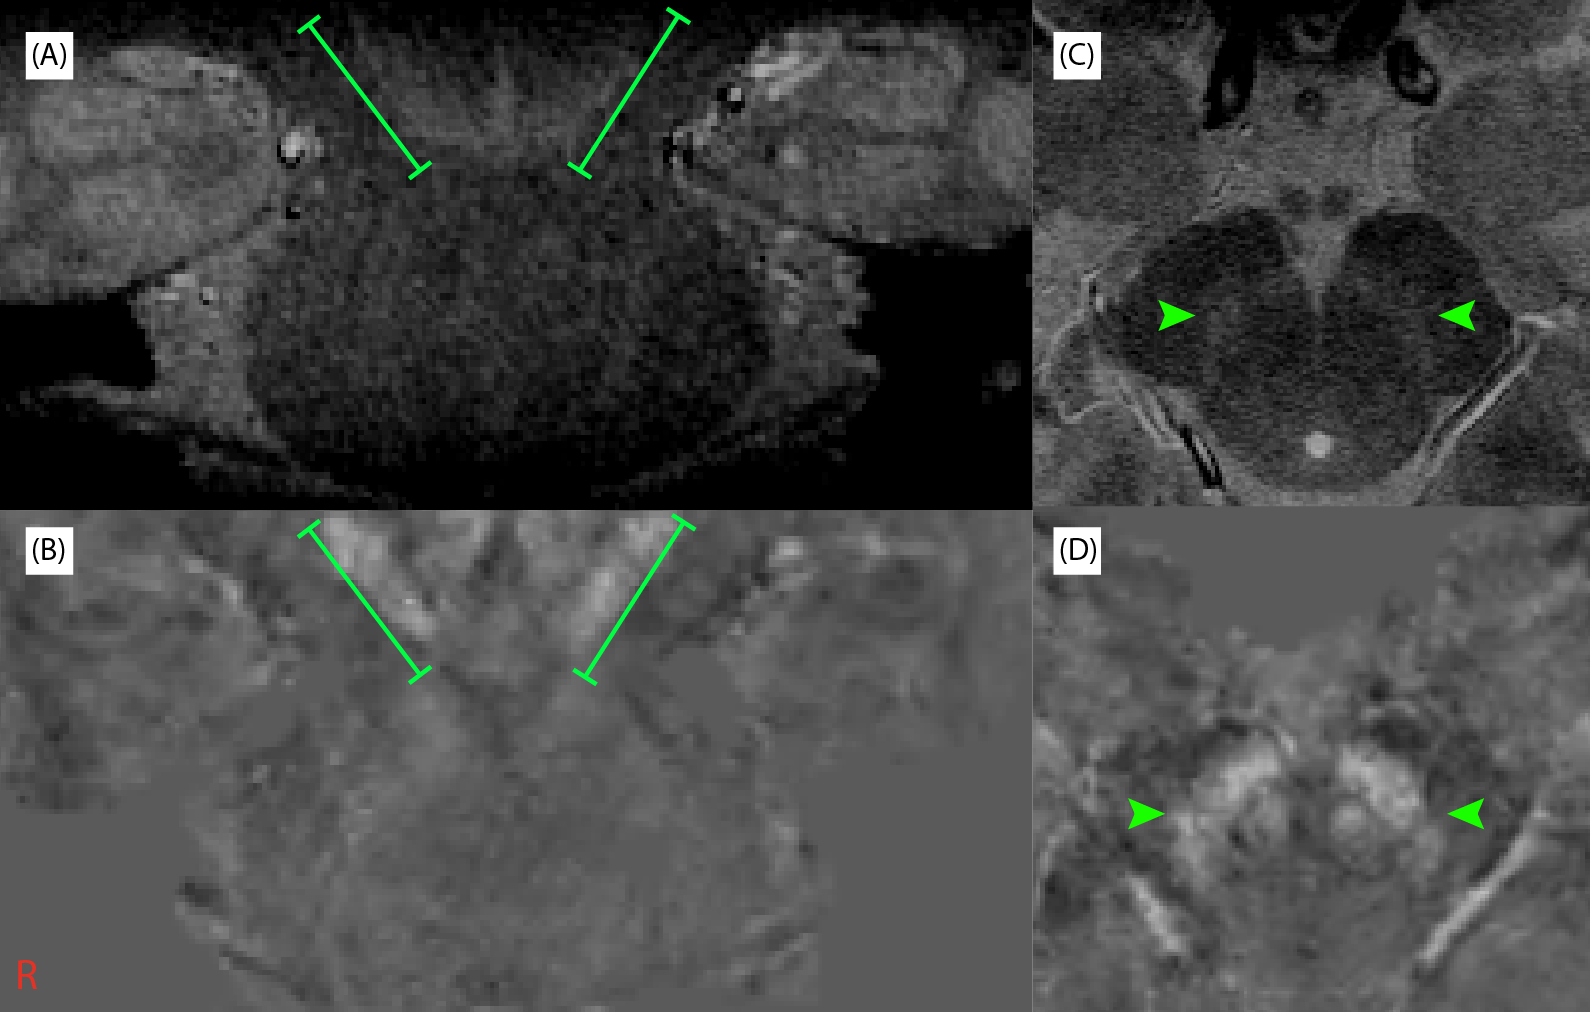
In all subjects, contrast was found in the LC and SN with a single-average MT-TFL scan. In Figure 1 coronal and axial views of the LC are displayed for an example subject, showing a hyperintensive LC in the MT-TFL (A,C), but no visible contrast in the QSM maps (B,D). The SN region is depicted for the same subject in Figure 2, which was found hyperintense both with the MT-TFL and the QSM data.
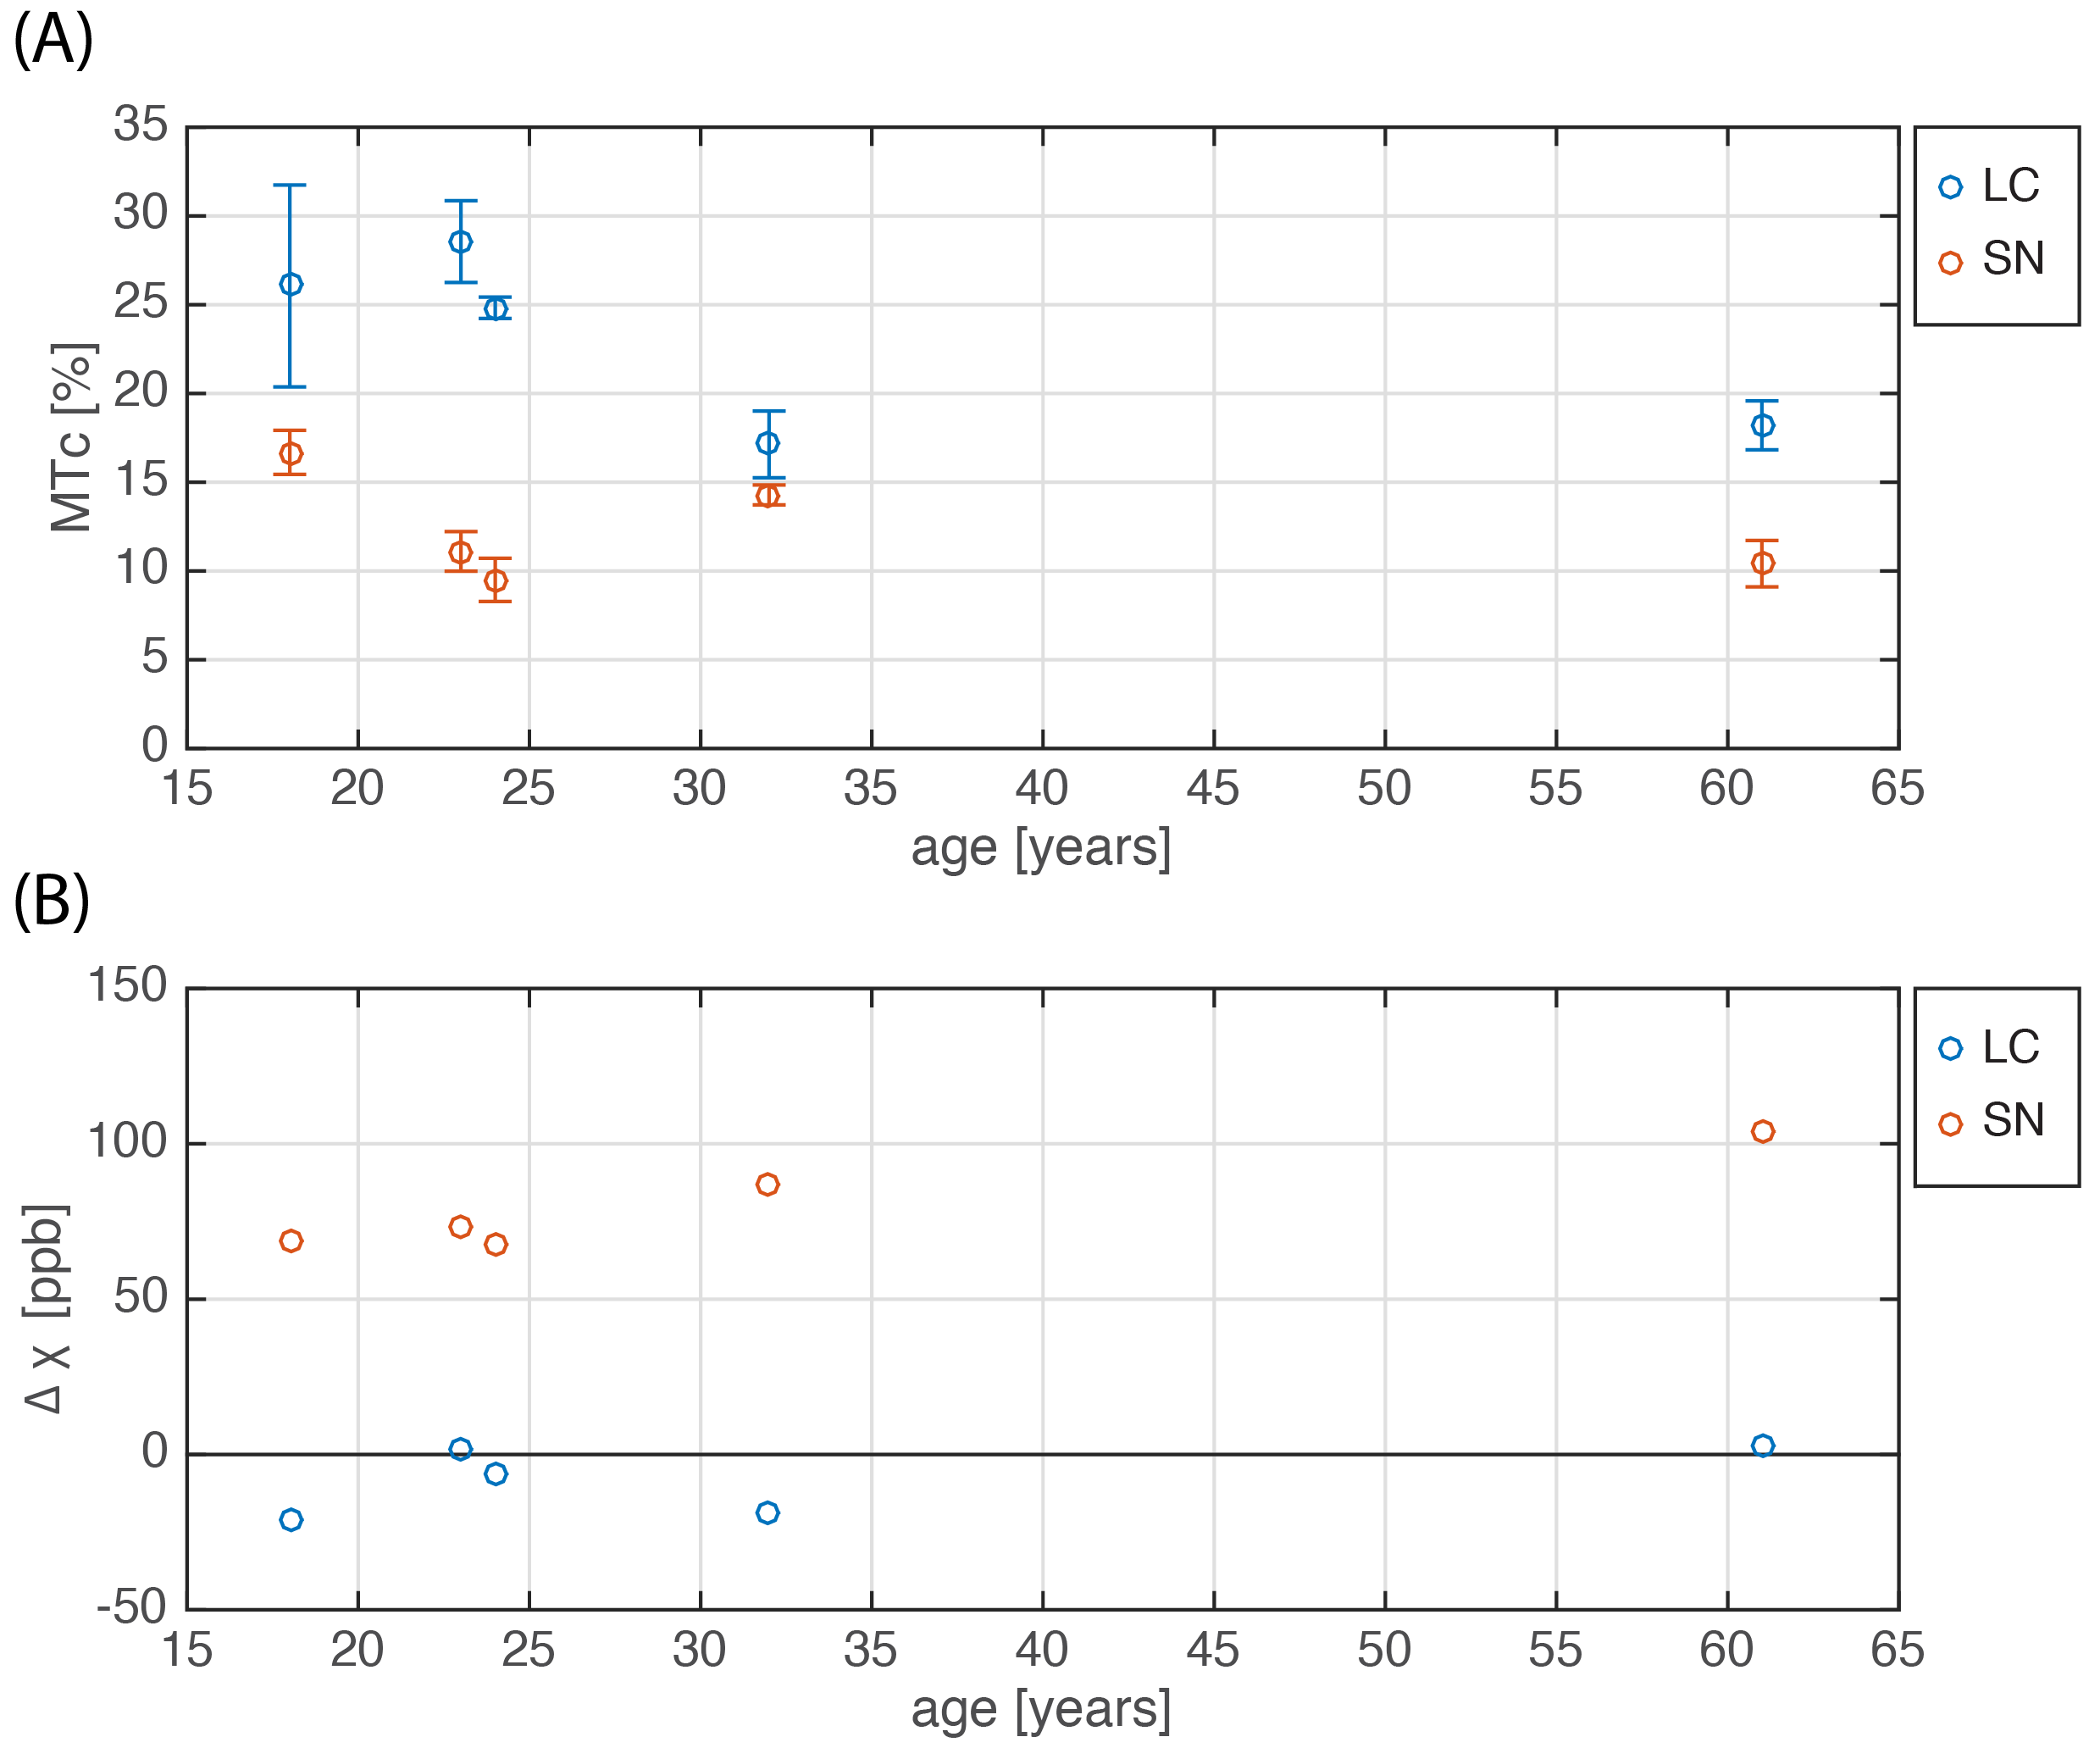
Figure 3(A) shows quantitative results of the MTc contrast. On average across all subjects, the MTc=(22.84±4.35)% in the LC was higher than in the SN (MTcSN=(22.84±4.35)%). Test-retest repeatability measurements of the MT-TFL scan showed a variability of MTc of (2.89±1.88)% in the LC and (8.00±0.35)% for SN. The subject-average $$$\Delta\chi$$$ in the SN was (65.0±28.8)ppb, consistent with what is found in literature for different age groups11, while for the LC the $$$\Delta\chi$$$ values were close to zero in all subjects ($$$\Delta\chi$$$=(-5.0±14.9)ppb) (Figure 3(B)).
Discussion and Conclusions
In this pilot experiment we attempt to evaluate the neuromelanin and iron content in two deep brain structures that show severe cell loss in disease. As in previous reports, we were able to obtain high-resolution images of the LC and SN with the MT-TFL sequence at 7T3. However, our pilot results show that, in contrast to SN, the high-resolution QSM data was not sensitive to the iron binding with neuromelanin in the LC. This may be because the iron linked to the NM is in a different chemical state than other forms of iron that contribute to the QSM contrast4,12. Further investigation of T2*-weighted and MT-weighted imaging of the LC and SN is needed, in a larger cohort and across different age groups, to detect in-vivo the chemical compounds of these structures.Acknowledgements
No acknowledgement found.References
1. Sara SJ. The locus coeruleus and noradrenergic modulation of cognition. Nature reviews neuroscience. 2009 Mar 1;10(3):211-23.
2. Zucca FA, Segura-Aguilar J, Ferrari E, Muñoz P, Paris I, Sulzer D, Sarna T, Casella L, Zecca L. Interactions of iron, dopamine and neuromelanin pathways in brain aging and Parkinson's disease. Progress in neurobiology. 2017 Aug 1;155:96-119.
3. Priovoulos N, Jacobs HI, Ivanov D, Uludag K, Verhey FR, Poser BA. High-resolution in vivo imaging of human locus coeruleus by magnetization transfer MRI at 3T and 7T. NeuroImage. 2017 Jul 22.
4. Zucca FA, Bellei C, Giannelli S, Terreni MR, Gallorini M, Rizzio E, Pezzoli G, Albertini A, Zecca L. Neuromelanin and iron in human locus coeruleus and substantia nigra during aging: consequences for neuronal vulnerability. Journal of neural transmission. 2006 Jun 1;113(6):757-67.
5. Langkammer C, Liu T, Khalil M, Enzinger C, Jehna M, Fuchs S, Fazekas F, Wang Y, Ropele S. Quantitative susceptibility mapping in multiple sclerosis. Radiology. 2013 May;267(2):551-9.
6. He N, Ling H, Ding B, Huang J, Zhang Y, Zhang Z, Liu C, Chen K, Yan F. Region‐specific disturbed iron distribution in early idiopathic Parkinson's disease measured by quantitative susceptibility mapping. Human brain mapping. 2015 Nov 1;36(11):4407-20.
7. Matthews KL, Chen CP, Esiri MM, Keene J, Minger SL, Francis PT. Noradrenergic changes, aggressive behavior, and cognition in patients with dementia. Biological psychiatry. 2002 Mar 1;51(5):407-16.
8. Li W, Avram AV, Wu B, Xiao X, Liu C. Integrated Laplacian‐based phase unwrapping and background phase removal for quantitative susceptibility mapping. NMR in Biomedicine. 2014 Feb 1;27(2):219-27.
9. Li W, Wu B, Liu C. Quantitative susceptibility mapping of human brain reflects spatial variation in tissue composition. Neuroimage. 2011 Apr 15;55(4):1645-56.
10. Jenkinson M, Smith S. A global optimisation method for robust affine registration of brain images. Medical image analysis. 2001 Jun 30;5(2):143-56.
11. Lin PY, Chao TC, Wu ML. Quantitative susceptibility mapping of human brain at 3T: a multisite reproducibility study. American Journal of Neuroradiology. 2015 Mar 1;36(3):467-74.
12. Reimão S, Ferreira S, Nunes RG, Pita Lobo P, Neutel D, Abreu D, Gonçalves N, Campos J, Ferreira JJ. Magnetic resonance correlation of iron content with neuromelanin in the substantia nigra of early‐stage Parkinson's disease. European journal of neurology. 2016 Feb 1;23(2):368-74.
Figures