3151
APT CEST in cerebrospinal fluid in patients with multiple sclerosis at 3T1Department of Biomedical Engineering, Vanderbilt University, Nashville, TN, United States, 2Vanderbilt University Institute of Imaging Science, Vanderbilt University Medical Center, Nashville, TN, United States, 3Phillips Healthcare, Baltimore, MD, United States, 4Department of Neurology, Vanderbilt University, Nashville, TN, United States, 5Department of Radiology and Radiological Sciences, Vanderbilt University Medical Center, Nashville, TN, United States
Synopsis
There is currently no clinically available MRI method capable of monitoring chronic, systemic inflammation in the central nervous system as a confirmatory biomarker. Chemical exchange saturation transfer (CEST) is a novel MR technique sensitive to low concentration, exchangeable mobile solutes. Amide proton transfer (APT) CEST provides information about concentration of proteins/peptides with amide backbones. Our results show that APT CEST of CSF in the spinal cord demonstrates significant changes when compared between the control and MS cohort.
Introduction
MS diagnosis is made through MRI detection of lesion presentation (dissemination in space) and evolution (dissemination in time), however, confirmation is aided by detecting chronic inflammation of the central nervous system (CNS)1. Conventional MRI relies on T1- (pre- and post-contrast) and T2-weighting to detect inflammation or blood-brain-barrier-breakdown. There is currently no clinically available MRI method capable of monitoring chronic, systemic inflammation. As the destructive autoimmune effects in MS accumulate, proteins collect in the cerebrospinal fluid (CSF) and lumbar puncture (LP) is used to assay the presence of oligoclonal bands (OCBs), which are present in ~95% of MS patients2. Presence/absence of OCBs aid in diagnosis of MS, but provides no information on disease progression or severity. We hypothesize that chemical exchange saturation transfer (CEST) MRI is sensitive to protein changes in the CSF, may offer a better understanding of disease severity and progression. CEST MRI is sensitive to low concentration, labile proton moieties attached to mobile solutes through their exchange of spectrally selective saturation with surrounding water. Amide proton transfer (APT) CEST focuses on amide backbone protons of proteins/peptides, which resonate at 3.5 ppm downfield from water. APT CEST provides information about protein/peptide concentration and pH. In the CSF, due to long T1 and T2 relaxation times and lack of a semi-solid matrix, APT CEST has minimal confounding MT and nuclear Overhauser effects. Changes in CSF relaxation have been detected using T2 contrast methods3, however, evaluation of the sensitivity of APT CEST to CSF composition between MS and healthy volunteers has not been explored. We hypothesize that APT CEST, sensitive to protein concentration and exchange will be sensitive to CSF differences between cohorts and may offer a unique biomarker for protein accumulation, systemically.
Methods
Five healthy volunteers (2M/3F, 31 ± 10 years of age) and four RRMS patients (2M/2F, 46 ± 16 years of age, average Expanded Disability Status score: 4, average disease duration: 11 years) were recruited after signed, informed consent. A 3T whole body scanner was used (Phillips, Best, The Netherlands). Excitation and reception were achieved using the quadrature body coil and a 16-channel sensitivity encoding (SENSE) neurovascular coil, respectively. A single slice CEST acquisition was obtained in the cervical spinal cord (C3-4) using a Sinc-gauss, 150ms, 2 microT saturation pulse at 36 offset frequencies arrayed between ±5 ppm with respect to water (Additional parameters: FoV: 160mm x 160 mm, voxel size = 1mm x 1 mm, SENSE = 2, TR/TE = 305/12ms, FA = 20°, ProSet fat suppression, NSA = 5). One 20mm slice was used to minimize flow effects within the field of view.
Data analysis was performed in Matlab (Mathworks, Nattick, MA). APT CEST data was fit to a single Lorentzian, B0 corrected using WASSR and novel respiration correction was employed to remove temporal B0 fluctuations4. APTw was calculated by integrating the area between the Lorentzian fit and the z-spectrum between 2 and 4ppm downfield from water5. The CSF was manually extracted using a region of interest drawn around a portion of CSF and the mean APTw for the CSF was reported. A Wilcoxon rank sum test was performed to determine if CSF APT CEST effect was significantly different between the healthy control and MS cohorts.
Results
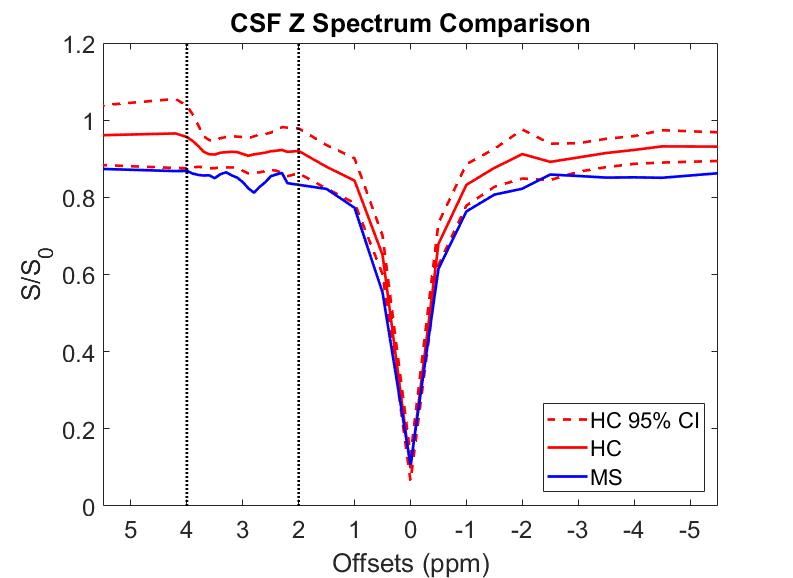
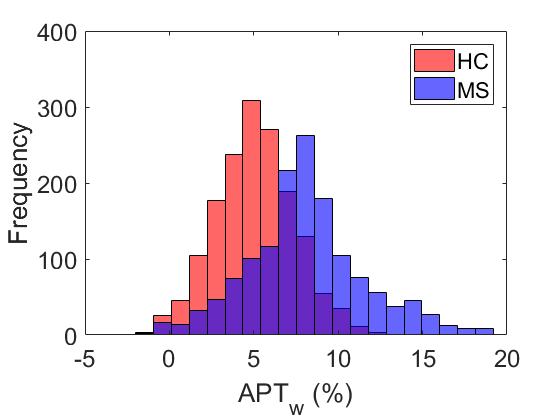
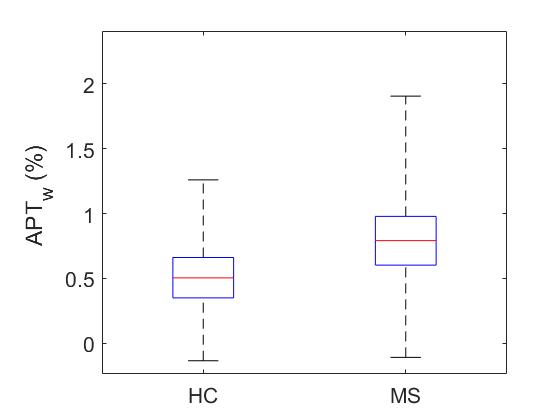
The mean z-spectra for both healthy and MS subjects are shown in Figure 1, as well as the 95% confidence interval (CI) for the healthy controls. Black dotted lines are added to partition the area of APT frequency ranges. From Dw = 2-4ppm, the MS z-spectra lies outside the 95% CI for the healthy controls and significant APTw differences were noted (p<0.001). Figure 2 compares the mean (over each cohort) APTw histogram expressed as percent difference from the Lorentzian fit. It can be easily seen that the APTw values are shifted upward in the MS cohort, which is further corroborated by Figure 3 which shows the mean APTw signal for each cohort. Mean APT effect in healthy controls (0.508±0.23%) and MS patients (0.809±0.39%) indicates a discriminatory capacity between cohorts. While the variance is still large, a trend towards increased CEST effect in the MS patients is noted.Discussion
APT CEST of SC CSF is significantly different between control and MS cohorts. APTw values show increasing trend in the CSF and the z-spectrum is visibly dissimilar across cohorts within the 2-4 ppm range. Future studies will examine larger portions of the z-spectrum to determine the most sensitive exchange moiety for detecting differences between cohorts, which could lead to APT CEST becoming a viable tool for monitoring disease progression through the CSF.Acknowledgements
National MS Society Conrad Hilton Foundation R21 (NIH/NINDS 1R21NS087465-01)References
1. Katz Sand, I. (2015). "Classification, diagnosis, and differential diagnosis of multiple sclerosis." Curr Opin Neurol 28(3): 193-205.
2. Correale J, de los Milagros M, Molinas B (2002). "Oligoclonal bands and antibody responses in Multiple Sclerosis". Journal of Neurology. 249 (4): 375–389.
3. Daoust, A., et al. (2017). "Transverse relaxation of cerebrospinal fluid depends on glucose concentration." Magn Reson Imaging 44: 72-81
4. By S, Barry RL, Smith AK, Lyttle BD, Box BA, Bagnato FR, Pawate S, Smith SA. Amide proton transfer CEST of cervical spinal cord in multiple sclerosis patients at 3T.
5. Zhou J, Payen J-F, Wilson DA, Traystman RJ, van Zijl PCM. Using the amide proton signals of intracellular proteins and peptides to detect pH effects in MRI. Nat Med 2003;9:1085–1090.
Figures