3149
On Resonance Variable Delay Multiple Pulse (onVDMP) CEST MRI Detects Transient Lactate Depletion during Experimental Autoimmune Encephalomyelitis Progression1Radiology, Johns Hopkins School of Medicine, Baltimore, MD, United States, 2Radiology, Kennedy Krieger Institute, Baltimore, MD, United States, 3Neurology, Johns Hopkins School of Medicine, Baltimore, MD, United States
Synopsis
On resonance variable delay multiple pulse CEST MRI detected a transient reduction in lactate levels in the cerebrospinal fluid during the disease course of a mouse model of multiple sclerosis, which was validated using magnetic resonance spectroscopy.
Purpose
The lack of specificity in diagnosing multiple sclerosis (MS) with MRI has encouraged the development of supplemental detection methods. The cerebrospinal fluid (CSF) contains certain metabolites that are known to change as the disease progresses1,2. Since on resonance variable delay multiple pulse (onVDMP) CEST MRI has previously been shown to be able to detect several of these metabolites when containing fast exchanging protons3, e.g. hydroxyl and amine protons, we explored onVDMP CEST MRI monitoring of the CSF during the disease course of experimental autoimmune encephalomyelitis (EAE), a mouse model of MS.Methods
Induction of EAE: EAE was induced in C57Bl/6 mice (n=6-8) by i.p. injection of 250 ng of pertussis toxin and s.c. injection of 300 μg of MOG35-55 in IFA supplemented with 4 mg/ml tuberculin on day 0 and day 2. Mice were monitored daily and assessed for paralysis using the following clinical scoring system: 0=healthy, 1=tail paralysis, 2=mild hind limb paralysis, 3=total hind limb paralysis, 4=forelimb paralysis, and 5=moribund/death. Naïve mice were used as a control (n=4-5).
MRI/MRS: Mice were imaged weekly using a horizontal bore Biospec 11.7 T scanner. For transmission, a 72-mm volume resonator was used. For acquisition, 2x2 and 4x1 phased array coils were used for the brain and spinal cord, respectively. Slice thickness was 2 mm for all images except those used for lesion detection (0.7 mm for T1w/FLASH and for T2w images). Other parameters are:
· T2w imaging: TE=20 ms, TR=2 s, RARE factor=8, number of averages (NA)=4, and FOV=128x128.
· T1w/FLASH imaging: TE=6 ms and TR=300 ms, NA=2, and FOV=128x128.
· onVDMP CEST imaging: TE=5 ms, TR=5 s, Rare factor=10, NA=1, repetitions=9, B1=46.8 μT, 32 pulse-exchange modules with a 2 ms pulse width, eight delays (mixing times exponentially distributed from 1.14 to 100 ms), and FOV=128x128. Variation of onVDMP CEST signal over time (%) was defined as 100 * (onVDMPAFTER – onVDMPBEFORE) / onVDMPBEFORE.
· STEAM spectroscopy: TE=3 ms, TR=2.5 s, NA=128, and voxel size = 4x2x2 mm, TARQUIN4 was used to determine metabolite concentrations (mM) of peaks fitted with the standard 1H brain library. Metabolite content analyzed in these studies was normalized to total creatine content.
Statistics: Significance was defined at p<0.05 using an ANOVA with Tukey post-hoc, Student t-test or Pearson correlation, as appropriate.
Results and Discussion
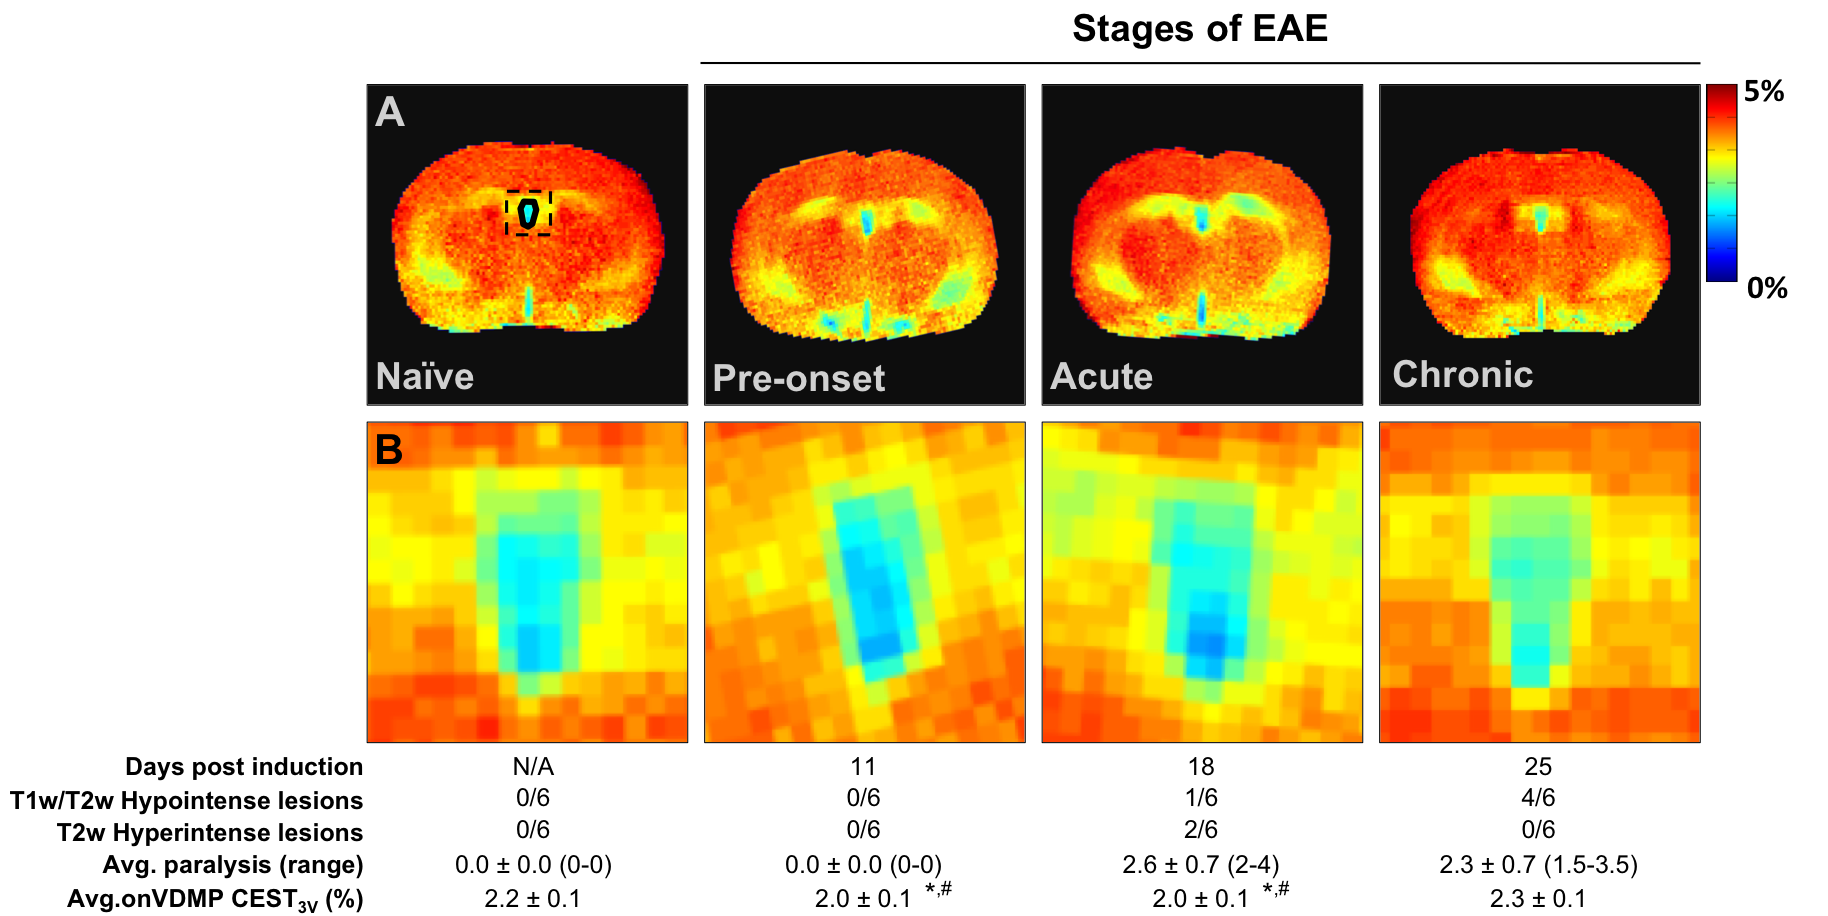
Change in onVDMP CEST signal preceded lesion detection on MRI and paralysis (Figure 1). On MRS lactate content decreased as onVDMP increased, then restored to normal levels as onVDMP did (Figure 2). We postulate that the changes in onVDMP CEST MRI signal are caused by this depletion of lactate, as a) it is the 3rd most abundant metabolite in the CSF (1.6 ± 0.3 mM) following urea and glucose2, b) its signal on phantom onVDMP CEST MRI per mM unit is higher than glucose and urea, and c) its presence has been found to be lower in the CSF of MS patients compared to healthy controls5,6.Acknowledgements
Funding was provided by the NMSS (RG 4994-A-3) and the TEDCO Maryland Stem Cell Fund for Postdoctoral Fellows.References
1. M Calabrese et al. Nat Rev Neurosci. 2015;16(3):147-58.
2. DS Wishart et al. J Chromatogr B Analyt Technol Biomed Life Sci. 2008;871(2):164-73.
3. J Xu et al. Magn Reson Med. 2017;77(2):730-739.
4. M Wilson et al. Magn Reson Med. 2010;65(1):1-12.
5. MA Fonalledas Perello. PRHSJ 2008;27(2):171-174.
6. J Aasly et al. Acta Neurol Scandinavica. 1997;95:9-12.
Figures